Being able to edit your C# (or F# for that matter) code on your Linux VM from Visual Studio in Windows is pretty great. As a Windows developer, you're able to work in an environment you know and trust while still being able to experiment -- and hopefully produce production code -- in Linux, where you may not be quite up to speed. Yet. Visual Studio, that familiar, productive and helpful IDE, is at your fingertips even though your code is far away in a Linux VM.
(Okay, not that far; the VM is running on the Red Hat Container Development Kit on your Windows box, but let's call that last sentence "poetic license" and move on.)
Editing isn't enough; we all know that. Since code sometimes has bugs (cough), we need to debug our code. Sure, we can write to a log and check inputs and outputs against expected results, but even that's not enough. Any kinds of tests, even automated tests (you are using TDD, right? Right?) only confirm the existence -- as rare as they are in your code -- of defects. Finding the cause of a defect, ahhhh ... there's the rub. If only we could run interactive debugging from within Visual Studio against our compiled C# code running in our RHEL VM.
Well guess what; We can. It's called "offroad debugging" and it's not difficult to set up and -- this is a technical term -- it's very cool. It's a bit of work to get set up -- not difficult, just several steps -- but after doing it one time it becomes very easy for future projects. And never forget; if you get stuck, you can reach me on Twitter (@DonSchenck) or email me at dschenck@redhat.com.
Step 1: Enable Visual Studio on Windows
For starters, you must have Visual Studio 2015, Update 2, or newer. If you don't have Visual Studio and just don't know where to start, download Visual Studio Community Edition from the Visual Studio Community web site.
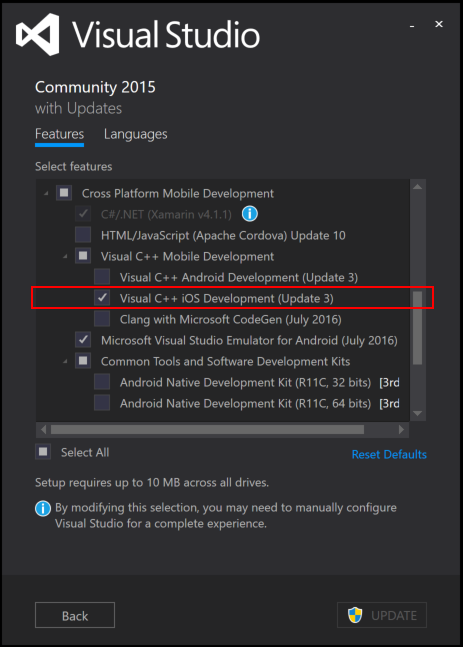
Once you've checked off that prerequisite, you need to enable MIDebugEngine, which is the Windows-side executable that talks to the Linux-side debugging application. This is done by enabling C++ iOS Development (I know, right? ... who would have guessed that you'd need iOS development bits enabled?). Open the Programs and Features applet in the Control Panel, right click on your version of Microsoft Visual Studio, and select "Change". When the dialog box appears, select "Modify" and enable debugging at 'Cross Platform Development --> Visual C++ Mobile Development --> Visual C++ iOS Development'.
Step 2: Install CLRDBG on the Linux VM
CLRDBG is the new cross-platform command line debugger from Microsoft, used for debugging .NET Core code. It’s based on the same debugger that’s been built into Visual Studio, which was then made to run on all platforms: Windows, Linux and MacOS. A wrapper, which allows CLRDBG to talk to the underlying Machine Interface (MI) layer, was added as the command line tool. Installation is a snap -- one simple command on your Linux VM:
curl -sSL https://raw.githubusercontent.com/Microsoft/MIEngine/getclrdbg-release/scripts/GetClrDbg.sh | bash /dev/stdin vs2015u2 ~/clrdbg
If you’re not familiar with Linux, this command reads a script from the github repo and executes it, installing CLRDBG. You can install it into any directory; I suggest ~/clrdbg as it’s easy to remember.
Step 3: Set up SSH
This is the longest step, but once it’s done you won’t need to do it again.
SSH, or secure shell, allows you to securely connect to your VM from the Windows machine. This connection between the two machines is what allows you to control the debugging from Visual Studio on your Windows machine. While Microsoft has promised SSH as part of a future release of Windows, we need it now. PuTTY is the de facto standard in the Windows world; it can be downloaded from the PuTTY page. For debugging, we won’t need graphical interface for PuTTY; we’ll be connecting from the command line. While we don’t need the graphical SSH tool, putty.exe, we’ll need a desktop tool to configure secure keys that allow us to authenticate the Windows session against the Linux VM. That tool, PuTTYgen.exe, can be found at the PuTTY download page. We’ll also be using the plink.exe tool, which must also be downloaded from the same site. Download PuTTYgen.exe and plink.exe and put them anywhere; A good place (easy to remember) is C:\mytools.
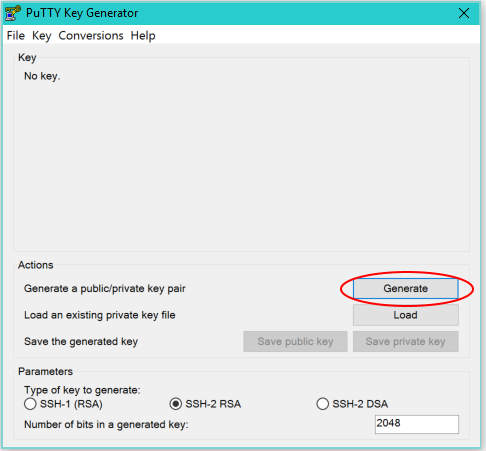
With the tools in hand, we can generate public and private keys to be used for authentication. Run PuTTYgen.exe and select the “Generate” button, then follow the instructions on the screen. This will create public and private keys to allow us to gain access to the Linux VM from a command line.
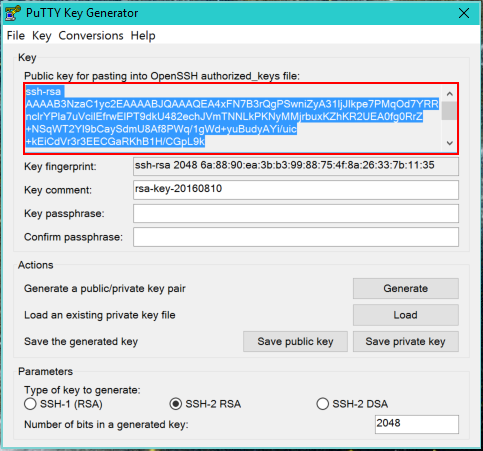
Use the “Save private key” option to save the private key to a file on your hard drive. I’ll use C:\mytools\private_key.ppk for this example. If a prompt asks if you wish to save this without a passphrase, select “Yes”. Next, select the “Public key for pasting into OpenSSH authorized_keys file:” contents and copy it to your clipboard, making certain that all of the characters are selected.
In your VM, paste the public key to the end of the file ~/.ssh/authorized_keys. The easiest way is to use the VIM editor. If you’re not familiar with VIM, I suggest finding a good cheat sheet on the internet; jokes are made about attempts to simply exit VIM -- yes, it’s that different from any Windows editor. Trust me; you want a cheat sheet. Once this is done, the Windows ssh client will pass the contents of the private key (in C:\mytools\private_key.ppk) to the VM, where OpenSSH will use an encryption algorithm to generate a key to compare to the contents of ~/.ssh.authorized_keys to grant or deny access. We can test everything with the following command:
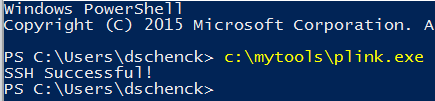
c:\mytools\plink.exe -i c:\mytools\private_key.ppk vagrant@127.0.0.1 -P 2222 -batch -t echo "SSH Successful!"
You should see something like the following:
Step 4: Share a folder/directory
This is covered in the blog post "Using Visual Studio with Linux (Hint: Windows is still required)", which see.
Step 5: Create the Launch Options XML file
When you launch the debugger, this file provides the parameters needed. I do this in Visual Studio, adding the file to the root of the project. You can give it any name, but I call it OffRoadDebug.xml. The contents should reflect your environment, as the following would be for our example:
<?xml version="1.0" encoding="utf-8" ?> <PipeLaunchOptions xmlns="http://schemas.microsoft.com/vstudio/MDDDebuggerOptions/2014" PipePath="c:\mytools\plink.exe" PipeArguments="-i c:\mytools\private_key.ppk vagrant@127.0.0.1 -P 2222 -batch -t ~/clrdbg/clrdbg --interpreter=mi" TargetArchitecture="x64" MIMode="clrdbg" ExePath="dotnet" WorkingDirectory="~/MyShare/mvc" ExeArguments="bin/Debug/netcoreapp1.0/mvc.dll"> </PipeLaunchOptions>
Most of the contents are self-explanatory, but some things to note:
- PipePath points to plink.exe that was downloaded from the PuTTY web site. This is the command line SSH tool.
- The PipeArguments includes a reference to the CLRDBG utility which was installed on the Linux VM in Step 2. If you installed it in a different path, you’ll need to alter this.
- The “ExePath” refers to “dotnet” because that is the process that actually runs your application in Linux. Your application is a DLL that dotnet executes.
- “WorkingDirectory” points to the DLL (your application) as is resides on the VM.
- “ExeArguments” is a path to the DLL, typically underneath your WorkingDirectory. If you built the DLL and set a different directory as the output path, you’ll need to supply the directory path here. In our example, the project is called mvc, so the library is mvc.dll. This must exist before you start debugging, so you need to run
dotnet buildon your VM first.
Each project will have a file such as this. This, and the following step, are the two steps you’ll need to do for each project you wish to debug.
Step 6: Start Debugging
Important: You must first make sure your application is built on the Linux VM, using the dotnet build command.
Open a Command Window in your Visual Studio IDE (menu “View” --> “Other Windows” --> “Command Window”) and type in the following command, replacing the path to the options file (“/ OptionsFile”) with the path to your OffRoadDebug.xml file:
Debug.MIDebugLaunch /Executable:dotnet /OptionsFile:C:\src\mvc\OffRoadDebug.xml
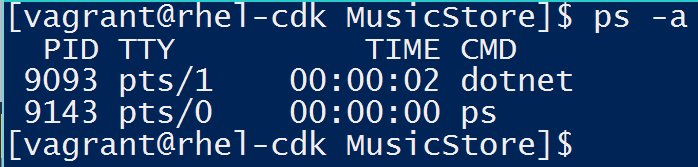
With this, your application will launch and you can set breakpoints and see variable values just as in Windows. Note that if you view your VM session in a terminal session, you will not see your application running. However, you can use the following command on your Linux VM to verify that your command is running:
ps -a
You should expect an output similar to the following:
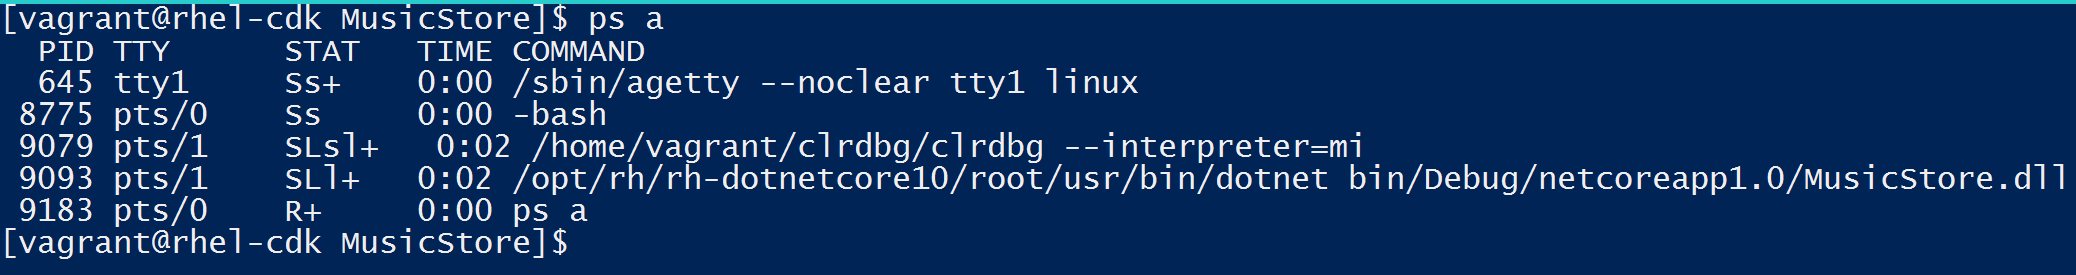
Running this command:
ps a
will show the dotnet command running, with your DLL as the command parameter, such as the following:
Finally, point your browser to the URL -- 10.1.2.2:5000 if using the Red Hat CDK -- and you’ll see your web site. You can now add a breakpoint in Visual Studio and inspect variables, view call stacks, etc.
Happy debugging.
For additional information and articles on .NET Core visit our .NET Core web page for more on this topic.
Last updated: March 16, 2023