Modern microservice architectures demand comprehensive visibility. Running a service mesh like Red Hat OpenShift Service Mesh on Red Hat OpenShift requires tools that not only visualize traffic, but also integrate seamlessly with the platform's core monitoring.
This article demonstrates how to achieve a complete observability solution by combining OpenShift Service Mesh 3.2 with key components of the OpenShift ecosystem. We'll demonstrate how this stack provides a single pane of glass, allowing Kiali to leverage Istio dashboards within Perses, all powered by the OpenShift metrics infrastructure.
Unify data and visualization
True observability requires gathering data from every layer. On OpenShift, cluster monitoring is the built-in solution. It uses Prometheus for collection and exposes a unified query API via Thanos Querier. This means your metrics data is reliable, scalable, and readily accessible cluster-wide.
The next step to unlocking powerful visualization is the cluster observability operator. This operator introduces Perses, a modern, cloud-native dashboarding solution, built for the OpenShift ecosystem consisting of these components:
- Cluster monitoring for a unified metrics backend with Thanos Querier.
- Perses provided by the cluster observability operator for cutting-edge, customizable dashboards.
- OpenShift Service Mesh console for visualizing and managing the service mesh.
Why use Perses for service mesh dashboards?
Perses allows you to create highly flexible, multi-data-source dashboards. By configuring Perses to use the Thanos Querier endpoint, it instantly gains access to all your cluster and application metrics, including those generated by Istio within the service mesh.
You don't have to build complex service mesh views from scratch. You can import pre-built Istio dashboards and use them immediately, using the Istio dashboards from the Perses community.
In this article, we will go through the steps to install OpenShift Service Mesh 3.2 using cluster monitoring as a metrics provider, and then install Perses dashboards to visualize metrics with the cluster observability operator.
The OpenShift Service Mesh console
With OpenShift Service Mesh 3.2, the OpenShift Service Mesh console can be configured to display these community-sourced Perses dashboards directly within its interface. The Service Mesh console is an integrated view from Kiali, the observability console for Istio .
When you navigate to a service in Kiali's graph, the metrics view can now pull in the corresponding, rich Perses Istio dashboard with extended dashboards.
Enable Thanos Querier and Perses integration
Now we will enable Thanos Querier and Perses Integration with OpenShift Service Mesh 3.2.
Prerequisites:
- OpenShift cluster: We will use OpenShift 4.20 for this guide.
- The cluster observability operator: We will use v1.2.2 for this guide.
- OpenShift Service Mesh 3.2 operator
- Kiali operator 2.17
Install and set up cluster monitoring and Istio
Enabling cluster monitoring is a crucial step in the setup process of enabling the collection of metrics for user-defined workloads on your OpenShift cluster.
oc apply -f - <<EOF
apiVersion: v1
kind: ConfigMap
metadata:
 name: cluster-monitoring-config
 namespace: openshift-monitoring
data:
 config.yaml: |
   enableUserWorkload: true
EOF
Install OpenShift Service Mesh 3.2 and a sample application. First, create the namespaces for Istio and the Istio CNI:
oc create ns istio-system
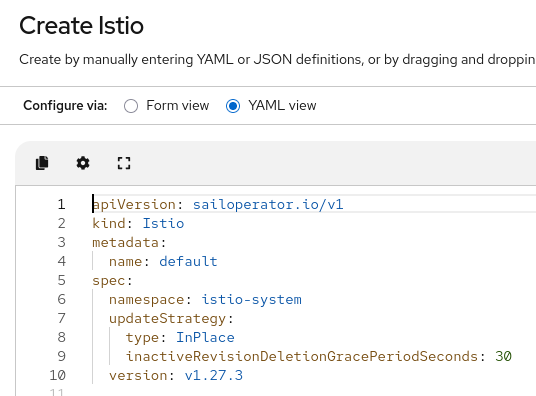
oc create ns istio-cniCreate an Istio resource. For this example, it will be created with default values (Figure 2):
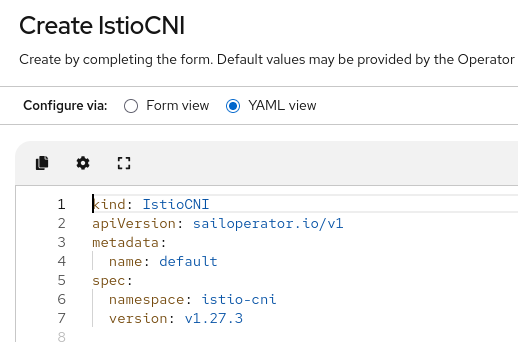
Create an Istio CNI resource (Figure 3):
Now, we will create a sample application, bookinfo that will be added to the mesh:
kubectl create namespace bookinfo
kubectl label namespace bookinfo istio.io/rev=default
kubectl apply -n bookinfo -f https://raw.githubusercontent.com/istio/istio/master/samples/bookinfo/platform/kube/bookinfo.yaml
kubectl apply -n bookinfo -f https://raw.githubusercontent.com/istio/istio/master/samples/bookinfo/platform/kube/bookinfo-versions.yaml
Install the Gateway API CRDs (If needed).
kubectl get crd gateways.gateway.networking.k8s.io &> /dev/null || \
  { kubectl kustomize "github.com/kubernetes-sigs/gateway-api/config/crd?ref=v1.1.0" | kubectl apply -f -; }
Create the bookinfo gateway.
kubectl apply -n bookinfo -f https://raw.githubusercontent.com/istio/istio/master/samples/bookinfo/gateway-api/bookinfo-gateway.yaml
kubectl wait -n bookinfo --for=condition=programmed gtw bookinfo-gateway
Create a route. Once created, it can be accessed to generate traffic:
oc expose svc/productpage -n bookinfo
oc get route productpage -n bookinfo
Install the monitoring resources. First, the service monitor will be created in the Istio namespace:
oc apply -f - <<EOF
apiVersion: monitoring.coreos.com/v1
kind: ServiceMonitor
metadata:
 name: istiod-monitor
 namespace: istio-system
spec:
 endpoints:
 - interval: 30s
   port: http-monitoring
   scheme: http
 selector:
   matchLabels:
     istio: pilot
EOF
An additional pod monitor for each namespace that needs to be monitored, including the Istio system namespace:
Note: Please copy the contents from https://raw.githubusercontent.com/josunect/yamls/refs/heads/main/openshiftMonitoring/istio-pod-monitor.yaml to make sure it works.
oc apply -f - <<EOF
apiVersion: monitoring.coreos.com/v1
kind: PodMonitor
metadata:
  name: istio-proxies-monitor
  namespace: istio-system
spec:
  selector:
    matchExpressions:
      - key: istio-prometheus-ignore
        operator: DoesNotExist
  podMetricsEndpoints:
    - path: /stats/prometheus
      interval: 30s
      relabelings:
        - action: keep
          sourceLabels: ["__meta_kubernetes_pod_container_name"]
          regex: "istio-proxy"
        - action: keep
          sourceLabels: ["__meta_kubernetes_pod_annotationpresent_prometheus_io_scrape"]
        - action: replace
          regex: (\d+);(([A-Fa-f0-9]{1,4}::?){1,7}[A-Fa-f0-9]{1,4})
          replacement: '[$2]:$1'
          sourceLabels: ["__meta_kubernetes_pod_annotation_prometheus_io_port", "__meta_kubernetes_pod_ip"]
          targetLabel: "__address__"
        - action: replace
          regex: (\d+);((([0-9]+?)(\.|$)){4})
          replacement: '$2:$1'
          sourceLabels: ["__meta_kubernetes_pod_annotation_prometheus_io_port", "__meta_kubernetes_pod_ip"]
          targetLabel: "__address__"
        - action: labeldrop
          regex: "__meta_kubernetes_pod_label_(.+)"
        - sourceLabels: ["__meta_kubernetes_namespace"]
          action: replace
          targetLabel: namespace
        - sourceLabels: ["__meta_kubernetes_pod_name"]
          action: replace
          targetLabel: pod_name
EOF
Note: Please copy the contents from https://raw.githubusercontent.com/josunect/yamls/refs/heads/main/openshiftMonitoring/bookinfo-pod-monitor.yaml to make sure it works.
oc apply -f - <<EOF
apiVersion: monitoring.coreos.com/v1
kind: PodMonitor
metadata:
  name: bookinfo-proxies-monitor
  namespace: bookinfo
spec:
  selector:
    matchExpressions:
      - key: istio-prometheus-ignore
        operator: DoesNotExist
  podMetricsEndpoints:
    - path: /stats/prometheus
      interval: 30s
      relabelings:
        - action: keep
          sourceLabels: ["__meta_kubernetes_pod_container_name"]
          regex: "istio-proxy"
        - action: keep
          sourceLabels: ["__meta_kubernetes_pod_annotationpresent_prometheus_io_scrape"]
        - action: replace
          regex: (\d+);(([A-Fa-f0-9]{1,4}::?){1,7}[A-Fa-f0-9]{1,4})
          replacement: '[$2]:$1'
          sourceLabels: ["__meta_kubernetes_pod_annotation_prometheus_io_port", "__meta_kubernetes_pod_ip"]
          targetLabel: "__address__"
        - action: replace
          regex: (\d+);((([0-9]+?)(\.|$)){4})
          replacement: '$2:$1'
          sourceLabels: ["__meta_kubernetes_pod_annotation_prometheus_io_port", "__meta_kubernetes_pod_ip"]
          targetLabel: "__address__"
        - action: labeldrop
          regex: "__meta_kubernetes_pod_label_(.+)"
        - sourceLabels: ["__meta_kubernetes_namespace"]
          action: replace
          targetLabel: namespace
        - sourceLabels: ["__meta_kubernetes_pod_name"]
          action: replace
          targetLabel: pod_name
EOF
The last resource is a telemetry:
oc apply -f - <<EOF
apiVersion: telemetry.istio.io/v1
kind: Telemetry
metadata:
 name: enable-prometheus-metrics
spec:
 metrics:
   - providers:
       - name: prometheus
EOF
Give read permissions to the kiali service account:
oc apply -f - <<EOF
apiVersion: rbac.authorization.k8s.io/v1
kind: ClusterRoleBinding
metadata:
 name: kiali-monitoring-rbac
roleRef:
 apiGroup: rbac.authorization.k8s.io
 kind: ClusterRole
 name: cluster-monitoring-view
subjects:
- kind: ServiceAccount
  name: kiali-service-account
  namespace: istio-system
EOF
Once created, we will generate bookinfo traffic, as shown in Figure 4.

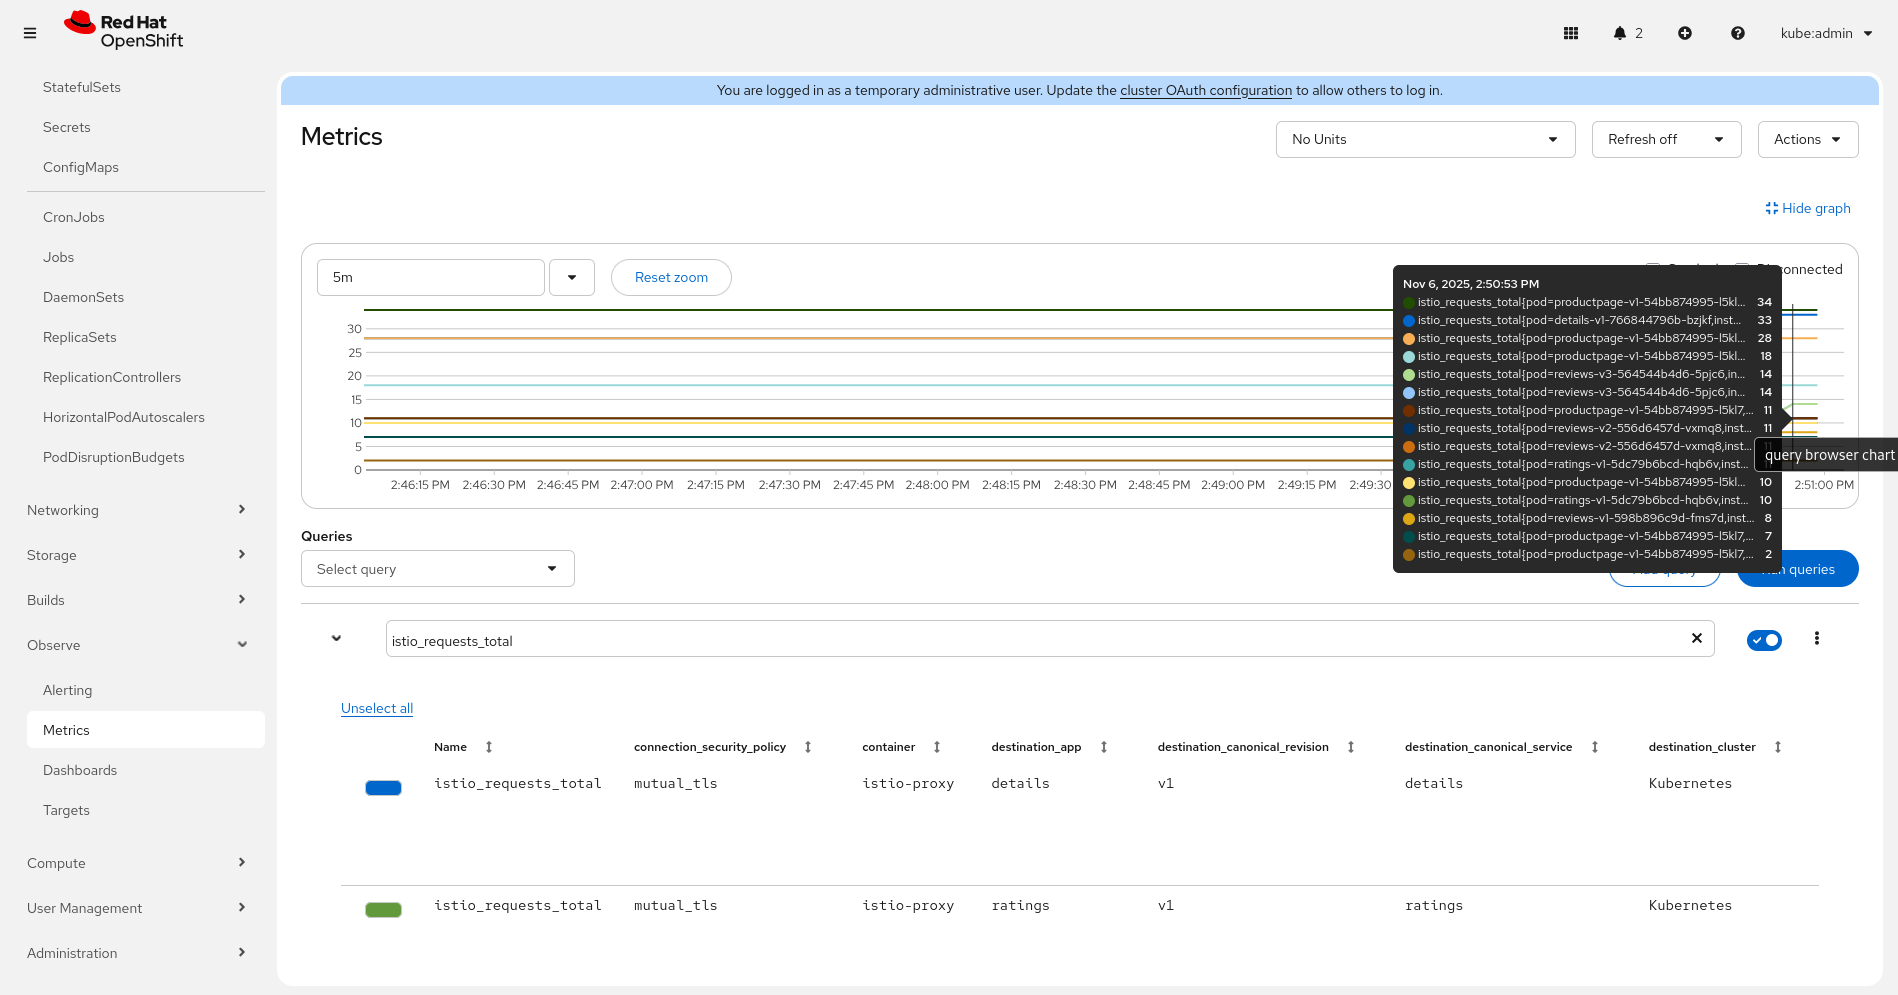
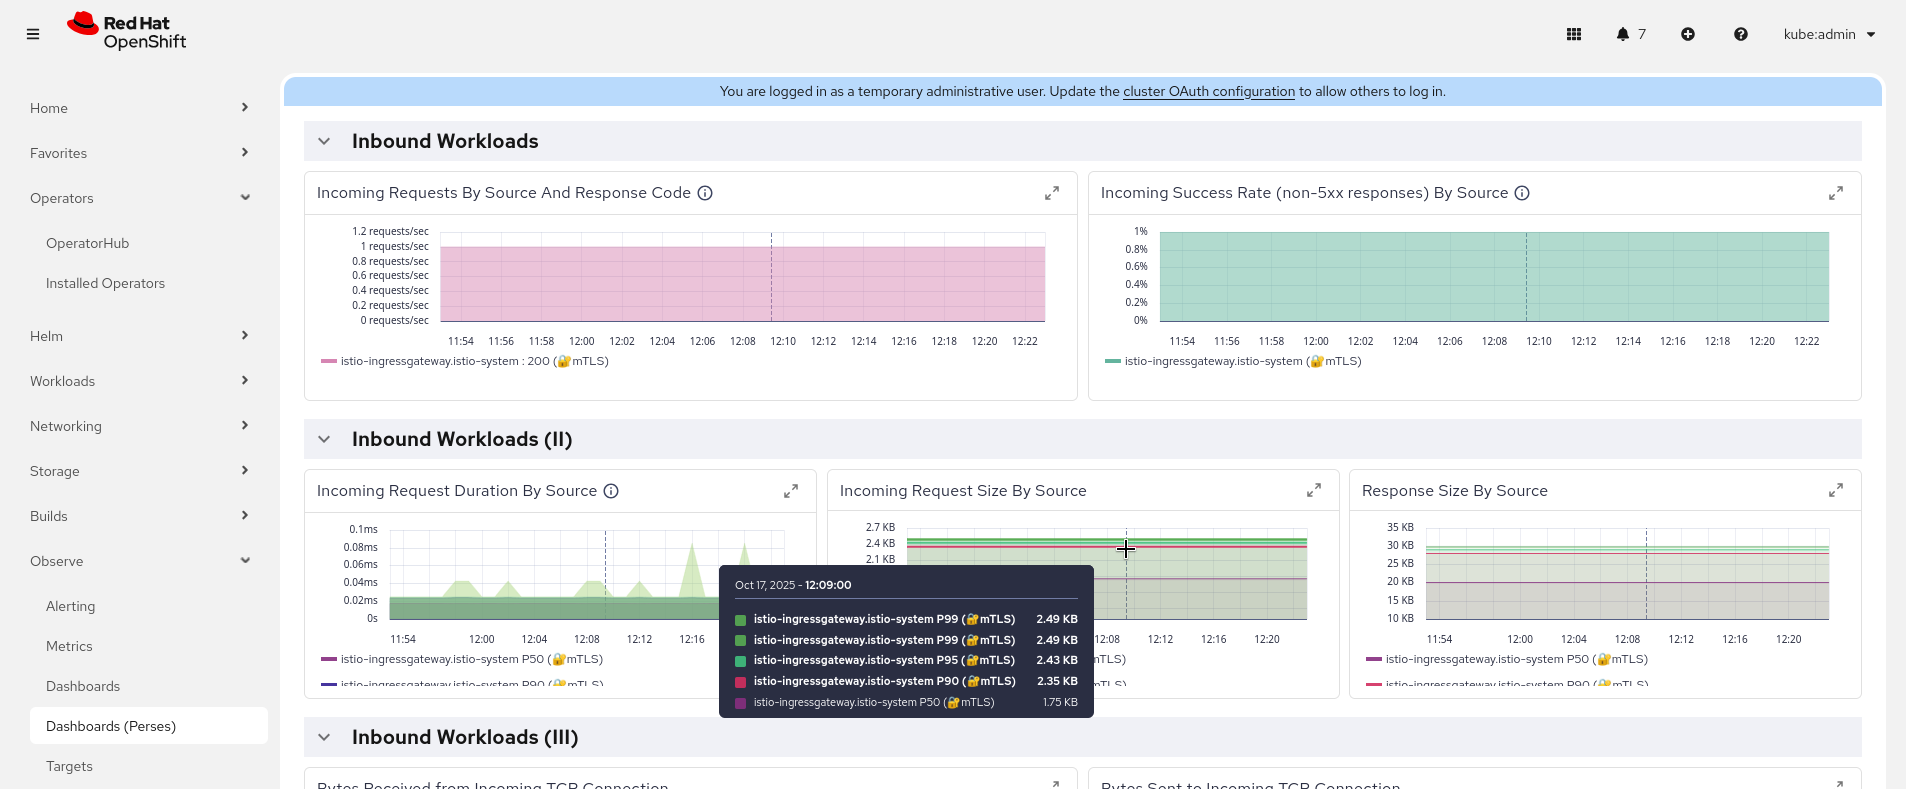
Validate metrics in Observe > Metrics looking for some HTTP metrics like istio_requests_total (Figure 5):
Install the Kiali resource
Install Kiali with the following configuration to access Prometheus and set up the Perses integration.
external_services:
...
perses:
auth:
ca_file: ''
insecure_skip_verify: false
password: ''
type: none
use_kiali_token: false
username: ''
dashboards:
- name: Istio Service Dashboard
variables:
datasource: var-datasource
namespace: var-namespace
service: var-service
version: var-version
- name: Istio Workload Dashboard
variables:
datasource: var-datasource
namespace: var-namespace
version: var-version
workload: var-workload
- name: "Istio Mesh Dashboard"
variables:
namespace: "var-namespace"
workload: "var-workload"
datasource: "var-datasource"
- name: "Istio Ztunnel Dashboard"
variables:
namespace: "var-namespace"
workload: "var-workload"
enabled: true
external_url: 'https://console-openshift-console.apps.SERVER'
health_check_url: ''
internal_url: ''
is_core: false
project: perses-dev
url_format: openshift
prometheus:
auth:
ca_file: /kiali-cabundle/service-ca.crt
insecure_skip_verify: false
type: bearer
use_kiali_token: true
thanos_proxy:
enabled: true
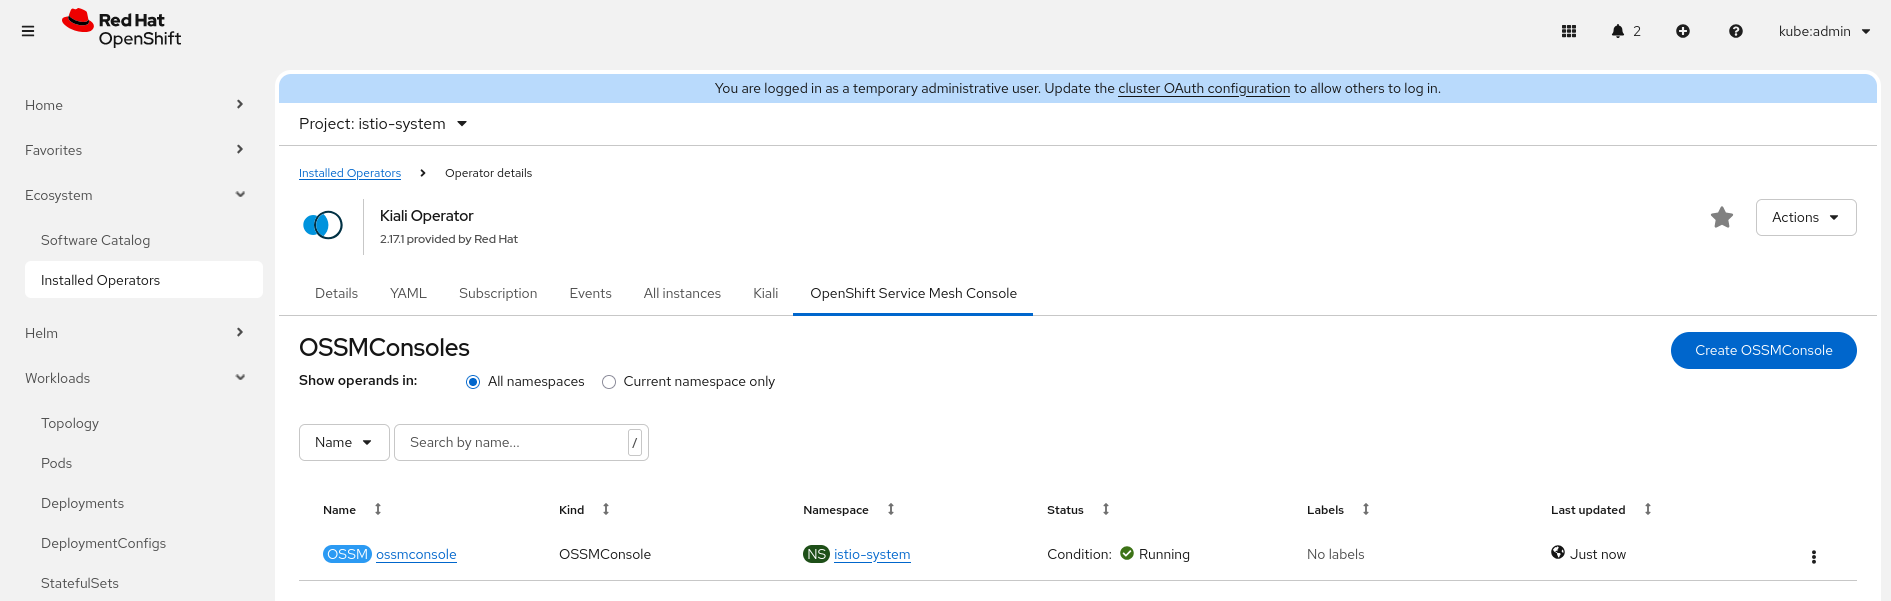
url: https://thanos-querier.openshift-monitoring.svc.cluster.local:9091For an integrated view in OpenShift, we can also create an OpenShift Service Mesh console resource that will enable the Service Mesh menu and the tab for the workloads and services from the Kiali operator (Figure 6).
Cluster monitoring
Let’s create a UI plug-in to enable the Perses dashboards (Figure 7).
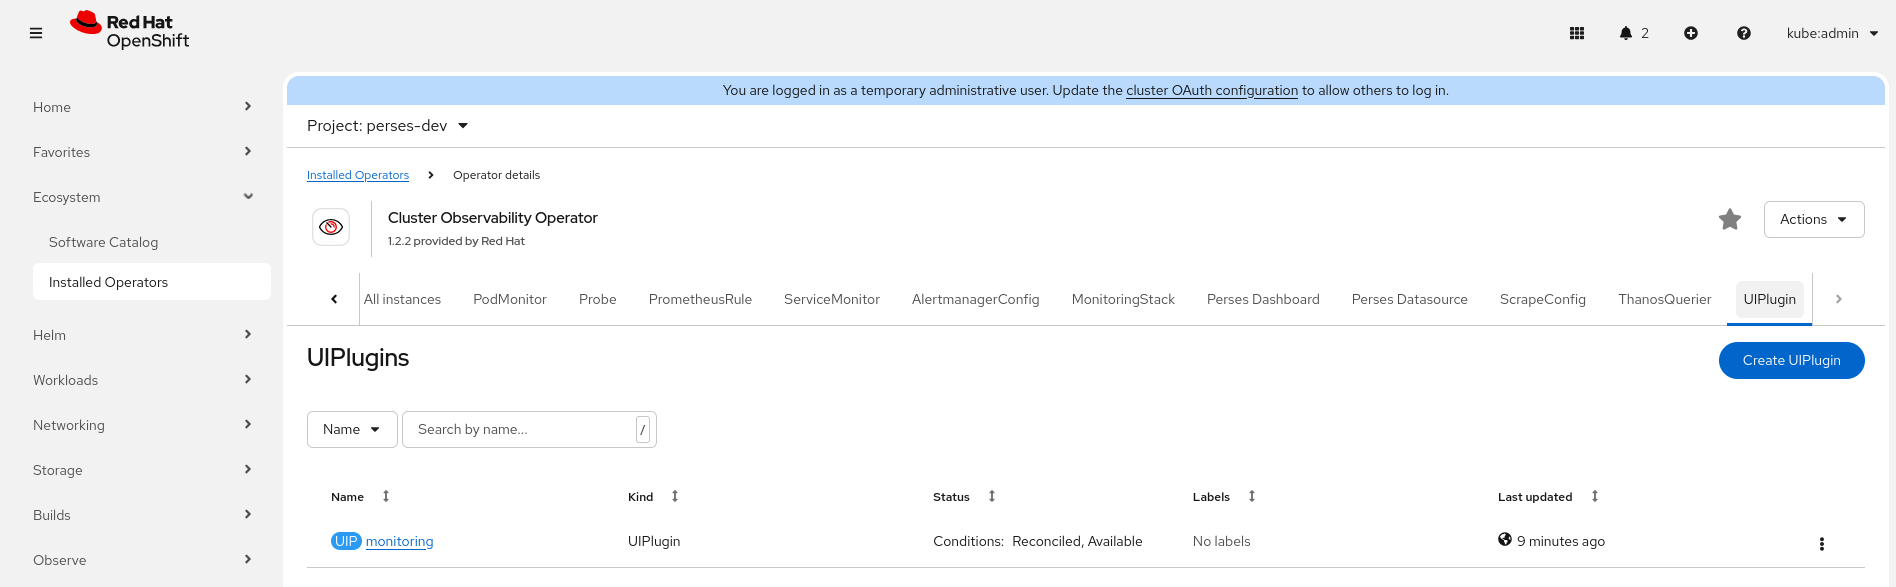
Use the configuration in Figure 8.

oc apply -f - <<EOF
apiVersion: observability.openshift.io/v1alpha1
kind: UIPlugin
metadata:
 name: monitoring
spec:
 type: Monitoring
 monitoring:
   perses:
     enabled: true
EOF
That should enable the menu Observe> Dashboards (Perses) in the OpenShift console.
Create the namespace for the Perses resources:
oc create ns perses-dev
Create a PersesDatasource for Thanos:
oc apply -f - <<EOF
apiVersion: perses.dev/v1alpha1
kind: PersesDatasource
metadata:
  name: prometheus-datasource
  namespace: perses-dev
spec:
  config:
    display:
      name: "Thanos Querier Datasource"
    default: true
    plugin:
      kind: "PrometheusDatasource"
      spec:
        proxy:
          kind: HTTPProxy
          spec:
            url: https://thanos-querier.openshift-monitoring.svc.cluster.local:9091
            secret: prometheus-datasource-secret
  client:
    tls:
      enable: true
      caCert:
        type: file
        certPath: /ca/service-ca.crt
EOF
Now, install the Istio Perses dashboards from the Perses community mixins repository:
oc apply -f https://github.com/perses/community-mixins/raw/refs/heads/main/examples/dashboards/operator/istio/istio-control-plane.yaml
oc apply -f https://github.com/perses/community-mixins/raw/refs/heads/main/examples/dashboards/operator/istio/istio-mesh.yaml
oc apply -f https://raw.githubusercontent.com/perses/community-mixins/refs/heads/main/examples/dashboards/operator/istio/istio-performance.yaml
oc apply -f https://raw.githubusercontent.com/perses/community-mixins/refs/heads/main/examples/dashboards/operator/istio/istio-workload-dashboard.yaml
oc apply -f https://raw.githubusercontent.com/perses/community-mixins/refs/heads/main/examples/dashboards/operator/istio/istio-service-dashboard.yaml
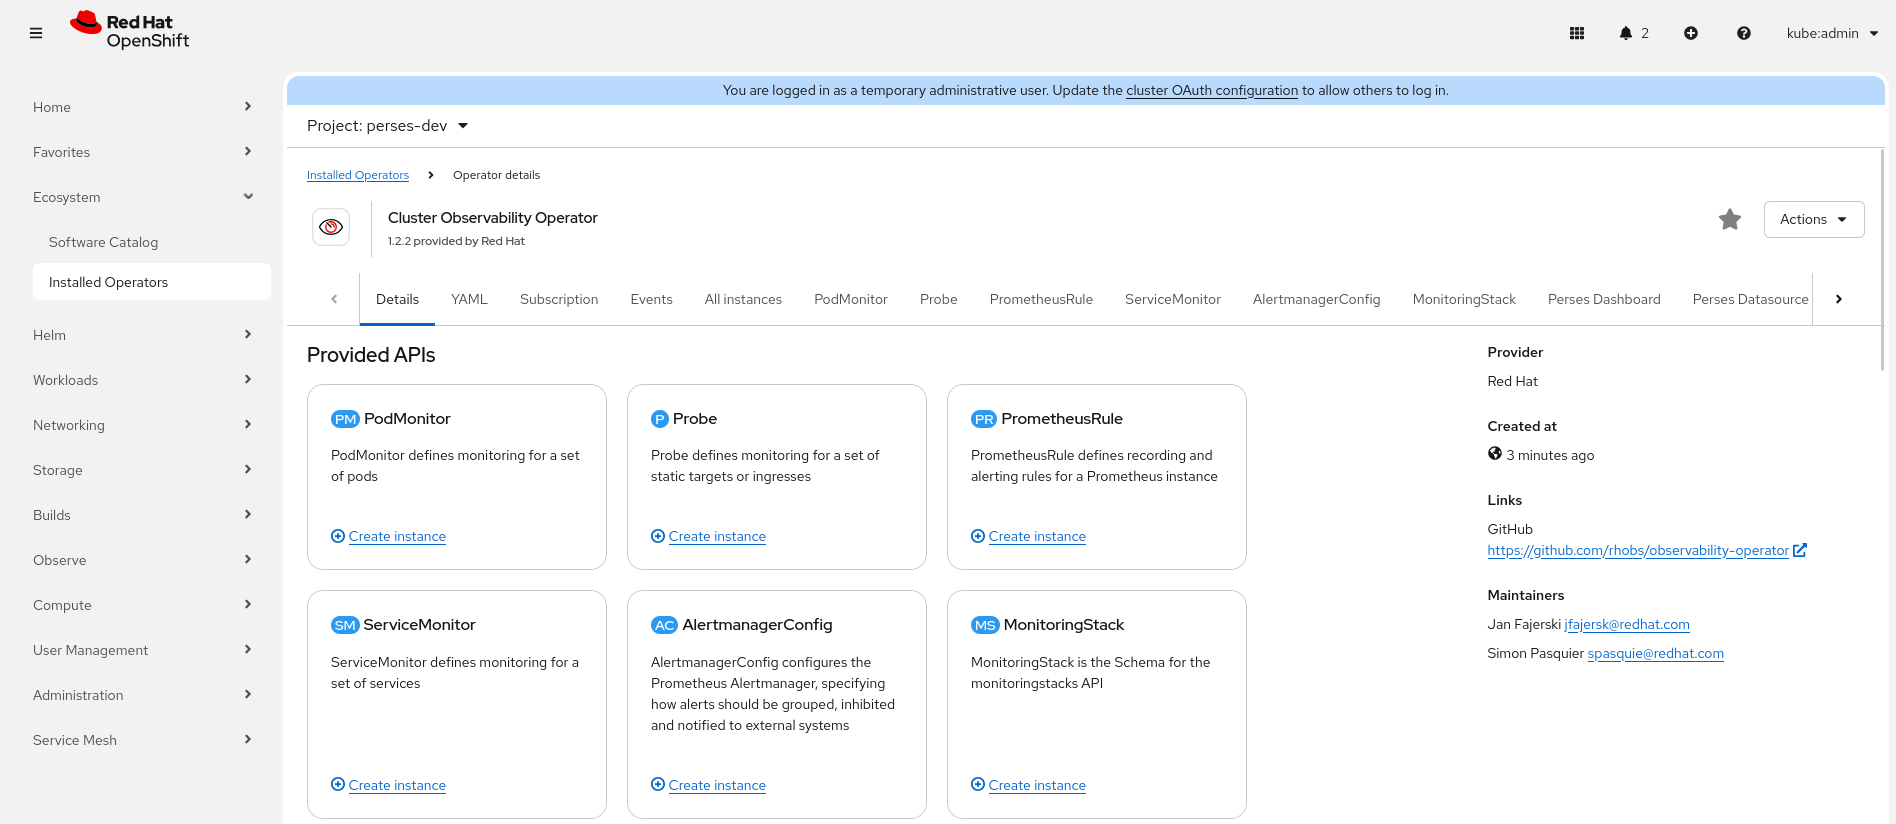
oc apply -f https://raw.githubusercontent.com/perses/community-mixins/refs/heads/main/examples/dashboards/operator/istio/istio-ztunnel-dashboard.yaml We can validate their installation in the perses-dev namespace, as shown in Figure 9.
The integration with the service mesh console allows navigating to the detailed Perses dashboard for every workload or service (Figure 10).
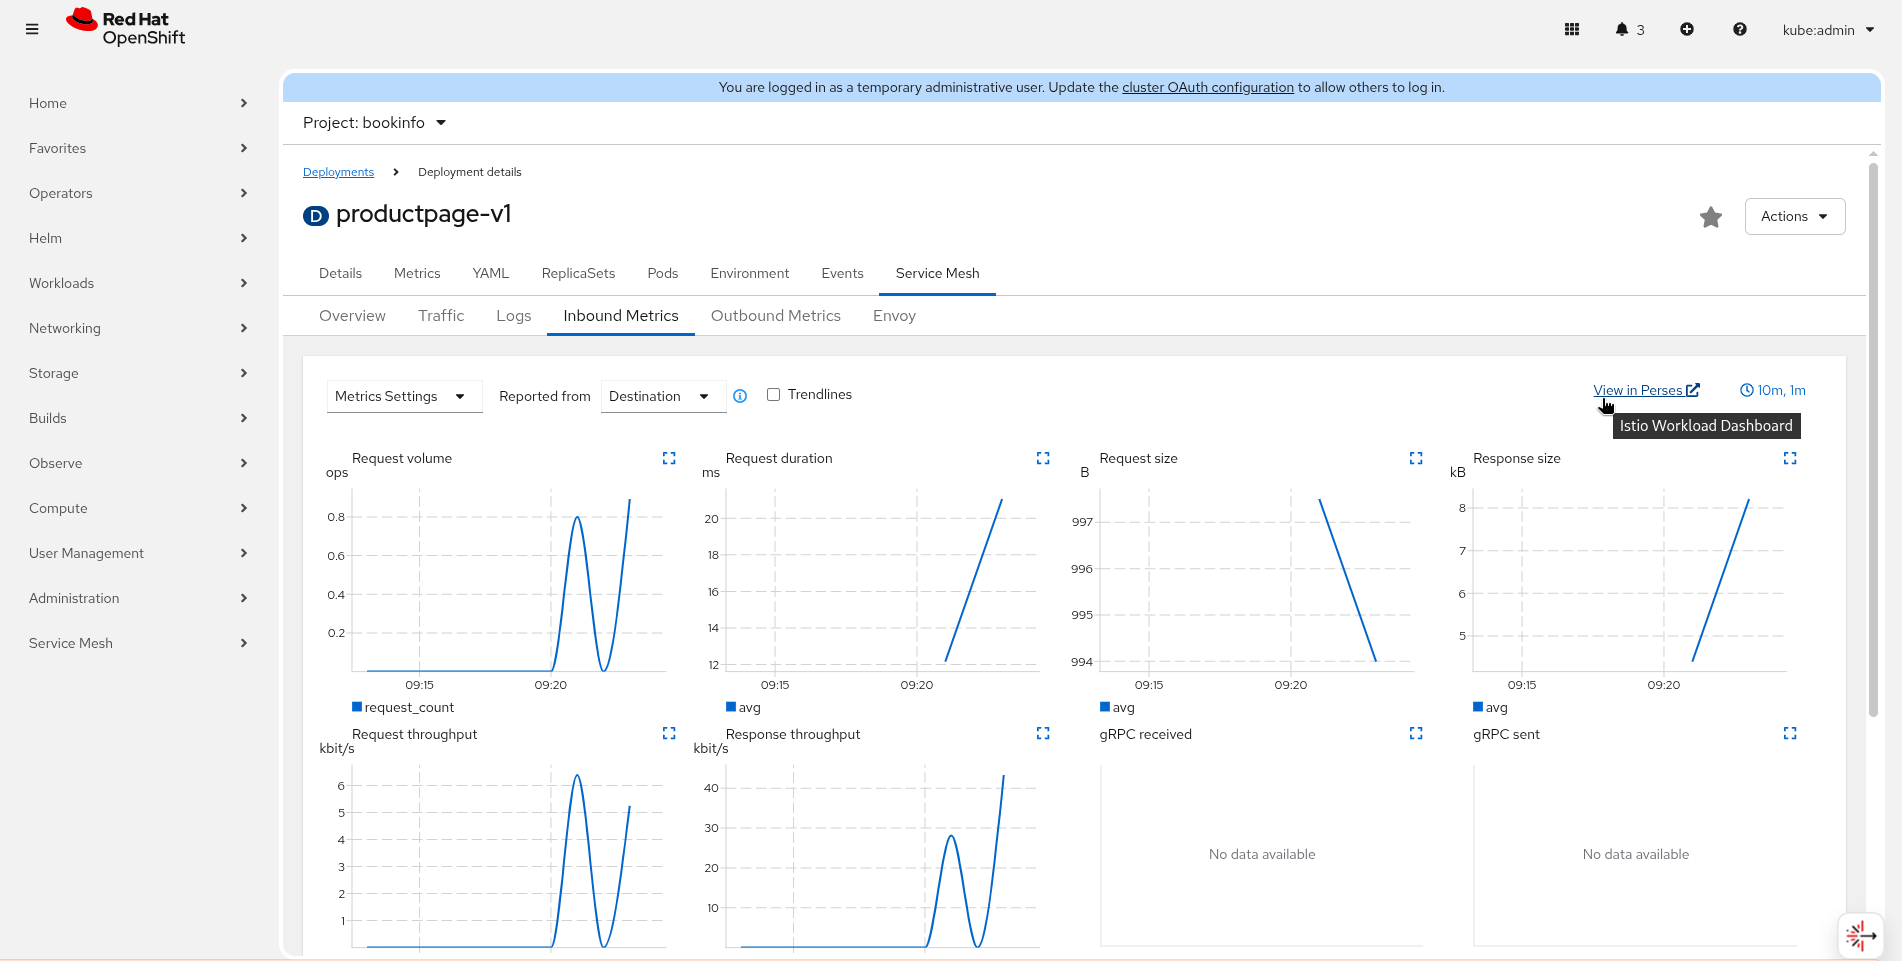
The same view will appear in the standalone Kiali.
Wrap up
Modern distributed systems on OpenShift require an observability solution that is as agile and comprehensive as the applications they host. By integrating OpenShift Service Mesh 3.2 with the cluster observability operator (Perses) and the core cluster monitoring system, we have created a unified stack.