The first installment in this series provided a brief introduction to the Cluster Observability Operator (COO). This article serves as a detailed guide for configuring alerts within the COO namespace. In the following sections, I will present specific examples for two structural configurations within the COO monitoring stack.
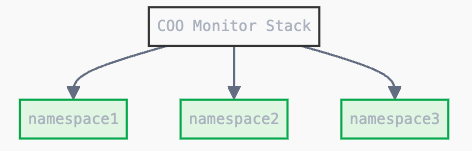
Case 1: One monitoring stack for multiple namespace.
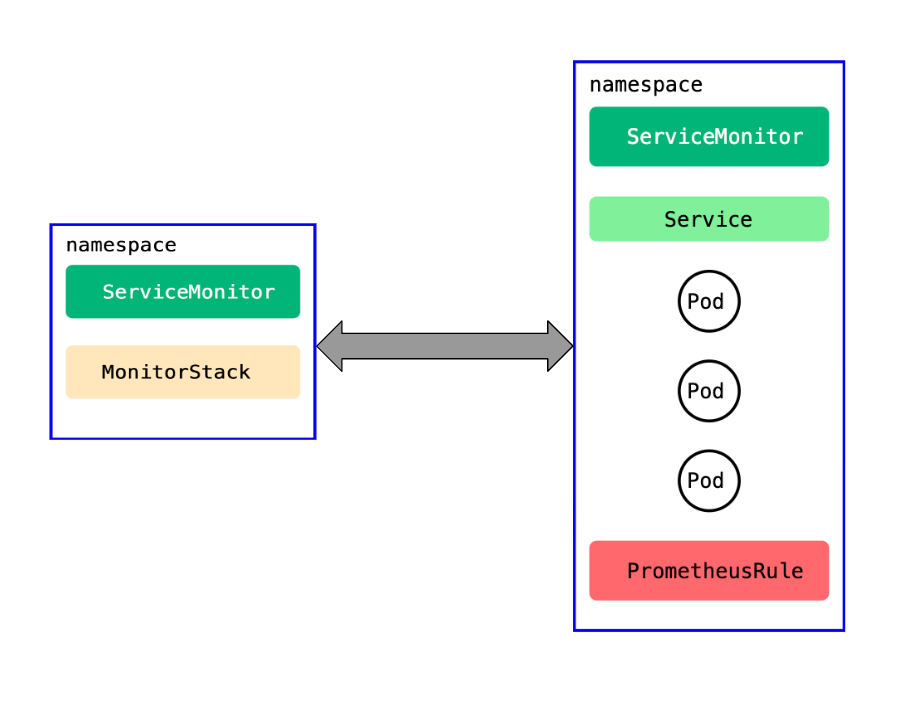
Create a namespace to host the COO instance and utilize this monitoring stack to monitor the namespaces coo-ns2, coo-ns3, and coo-ns4 as shown in Figures 1 and 2.
Create a project to host the COO monitoring stack. Give a label for the namespace monitoring.rhobs: coo-stack:
apiVersion: v1
kind: Namespace
metadata:
  name: coo-namespace
  labels:
    monitoring.rhobs:coo-stack
Create a COO monitoring stack, ensuring that the namespaceSelector matches the project label monitoring.rhobs:coo-stack. The resourceSelector should be set to k8s-app: prometheus-coo-example-monitor. This label should match the ServiceMonitor label. See below:
apiVersion: monitoring.rhobs/v1alpha1
kind: MonitoringStack
metadata:
  name: my-coo-monitoring-stack
  namespace: coo-namespace
spec:
  alertmanagerConfig:
    disabled: false
  logLevel: debug
  namespaceSelector:
    matchLabels:
      monitoring.rhobs: coo-stack
  prometheusConfig:
    replicas: 2
  resourceSelector:
    matchLabels:
      k8s-app: prometheus-coo-example-monitor
  resources:
    limits:
      cpu: 500m
      memory: 512Mi
    requests:
      cpu: 100m
      memory: 256Mi
  retention: 16d
Set the label app: prometheus-coo-example for the deployment/pod you wish to monitor:
apiVersion: monitoring.rhobs/v1
kind: ServiceMonitor
metadata:
 labels:
   k8s-app: prometheus-coo-example-monitor
 name: coo-servicemonitor-forcoonamespace
 namespace: coo-namespace
spec:
 endpoints:
 - interval: 30s
   port: web
   scheme: http
 selector:
   matchLabels:
     app: prometheus-coo-example
Check the info below namespace coo-namespace, shown in Figure 3.

Create the namespace coo-ns2, also with label monitoring.rhobs: coo-stack:
apiVersion: v1
kind: Namespace
metadata:
  name: coo-ns2
  labels:
    monitoring.rhobs: coo-stack
Run a Deployment:
apiVersion: apps/v1
kind: Deployment
metadata:
  labels:
    app: prometheus-coo-example
  name: coo-example-app2
  namespace: coo-ns2
spec:
  replicas: 1
  selector:
    matchLabels:
      app: prometheus-coo-example
  template:
    metadata:
      labels:
        app: prometheus-coo-example
    spec:
      containers:
      - image: ghcr.io/rhobs/prometheus-example-app:0.4.2
        imagePullPolicy: IfNotPresent
        name: coo-example-app2
Create a Service:
apiVersion: v1
kind: Service
metadata:
  labels:
   app: prometheus-coo-example
  name: coo-example-service-app2 # alter 条件是这个
  namespace: coo-ns2
spec:
  ports:
  - port: 8080
    protocol: TCP
    targetPort: 8080
    name: web
  selector:
    app: prometheus-coo-example
  type: ClusterIP
Also create a Service Monitor:
apiVersion: monitoring.rhobs/v1
kind: ServiceMonitor
metadata:
  labels:
    k8s-app: prometheus-coo-example-monitor
  name: prometheus-coo-example-servicemonitor2
  namespace: coo-ns2
spec:
  endpoints:
  - interval: 30s
    port: web
    scheme: http
  selector:
    matchLabels:
      app: prometheus-coo-example
Create a PrometheusRule and place the label k8s-app: prometheus-coo-example-monitor:
apiVersion: monitoring.rhobs/v1
kind: PrometheusRule
metadata:
  name: coo-alert2
  namespace: coo-ns2
  labels:
    k8s-app: prometheus-coo-example-monitor
spec:
  groups:
  - name: example
    rules:
    - alert: VersionAlert
      for: 1m
      expr: version{job="coo-example-service-app2"} > 0
      labels:
        severity: warning
Use the same method to create coo-ns3 and coo-ns4.
To verify it the alert has been configured correctly, try oc get all. Find the svc. In my case, mine is my-coo-monitoring-stack-prometheus. See Figure 4.
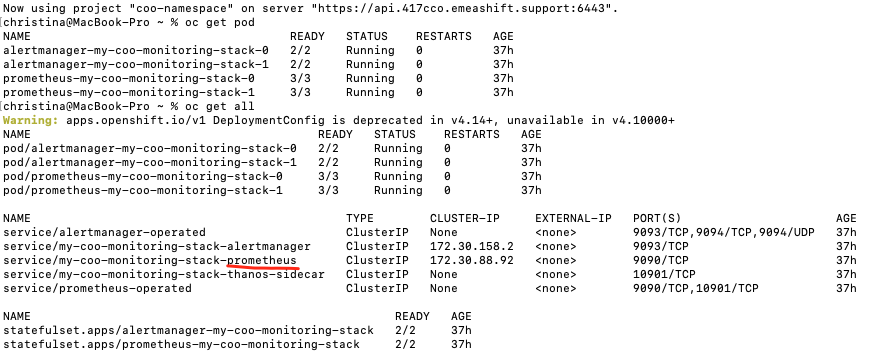
oc port-forward svc/my-coo-monitoring-stack-prometheus 9090:9090 --address 0.0.0.0 -n coo-namespaceTry:
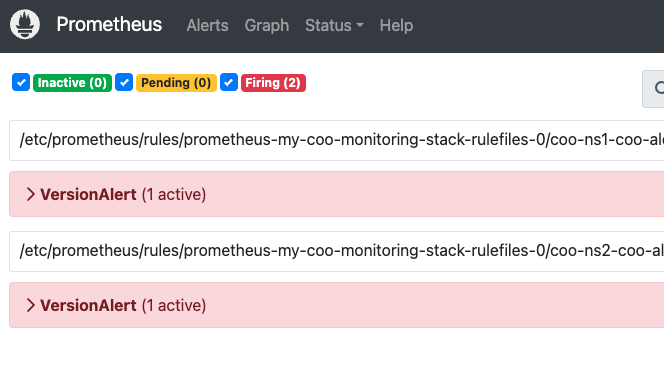
localhost:9090You will see a Prometheus UI Page. Click Alert and you should find the alert there. See Figure 5.
Next, let's move on and examine case 2. The structure in this example is shown in Figures 6 and 7.
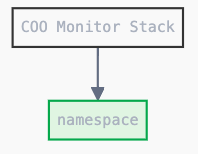
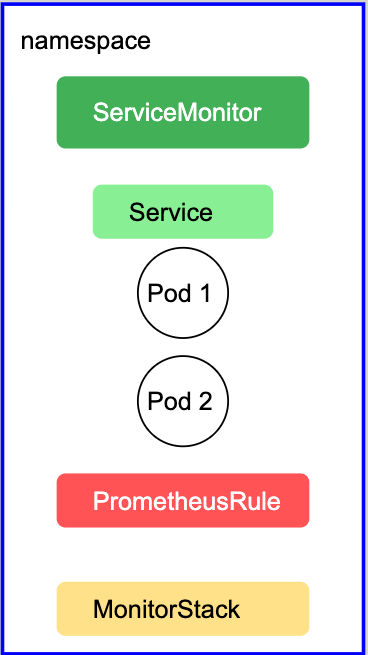
Case 2: Deploy the monitoring stack at the namespace you wish to monitor
In this instance, deploy the monitoring stack below namespace coo-ns1.
If you already had the namespace, assign a label for the namespace. If not, create a namespace, then make deployment and configure alerts for the namespace. Give a label for the namespace monitoring.rhobs: coo-stack:
apiVersion: v1
kind: Namespace
metadata:
  name: coo-ns1
  labels:
    monitoring.rhobs: coo-stack
Next, create a monitoringStack. Make sure the namespaceSelector is monitoring.rhobs: coo-stack, the same as the namespace label. Give a label k8s-app: prometheus-coo-example-monitor to resourceSelector:
apiVersion: monitoring.rhobs/v1alpha1
kind: MonitoringStack
metadata:
  name: my-coo-monitoring-stack
  namespace: coo-ns1
spec:
  alertmanagerConfig:
    disabled: false
  logLevel: debug
  namespaceSelector:
    matchLabels:
      monitoring.rhobs: coo-stack
  prometheusConfig:
    replicas: 2
  resourceSelector:
    matchLabels:
      k8s-app: prometheus-coo-example-monitor
  resources:
    limits:
      cpu: 500m
      memory: 512Mi
    requests:
      cpu: 100m
      memory: 256Mi
  retention: 16d
Create a ServiceMonitor. Give the label k8s-app: prometheus-coo-example-monitor. Also give a label app: prometheus-coo-example used for the deployment, service, and pod:
apiVersion: monitoring.rhobs/v1
kind: ServiceMonitor
metadata:
 labels:
   k8s-app: prometheus-coo-example-monitor
 name: coo-servicemonitor-forcoonamespace
 namespace: coo-ns1
spec:
 endpoints:
 - interval: 30s
   port: web
   scheme: http
 selector:
   matchLabels:
     app: prometheus-coo-example
Create a Service. Use the same label app: prometheus-coo-example:
apiVersion: v1
kind: Service
metadata:
  labels:
   app: prometheus-coo-example
  name: coo-example-service-app1
  namespace: coo-ns1
spec:
  ports:
  - port: 8080
    protocol: TCP
    targetPort: 8080
    name: web
  selector:
    app: prometheus-coo-example
  type: ClusterIP
Create a Deployment. Use the same label app: prometheus-coo-example:
apiVersion: apps/v1
kind: Deployment
metadata:
  labels:
    app: prometheus-coo-example
  name: coo-example-app1
  namespace: coo-ns1
spec:
  replicas: 1
  selector:
    matchLabels:
      app: prometheus-coo-example
  template:
    metadata:
      labels:
        app: prometheus-coo-example
    spec:
      containers:
      - image: ghcr.io/rhobs/prometheus-example-app:0.4.2
        imagePullPolicy: IfNotPresent
        name: coo-example-app1
Create a PrometheusRule. It is to configure the alert you wish to fire once you trigger the condition. Use the label k8s-app: prometheus-coo-example-monitor from the previous configuration:
apiVersion: monitoring.rhobs/v1
kind: PrometheusRule
metadata:
  name: coo-alert1
  namespace: coo-ns1
  labels:
    k8s-app: prometheus-coo-example-monitor
spec:
  groups:
  - name: example
    rules:
    - alert: VersionAlert
      for: 1m
      expr: version{job="coo-example-service-app1"} > 0
      labels:
        severity: warning
To verify it the alert has been configured correctly, try oc get all. Find the svc. In my case, mine is my-coo-monitoring-stack-prometheus:
kubectl port-forward svc/my-coo-monitoring-stack-prometheus 9090:9090 --address 0.0.0.0 -n coo-ns1 Try:
localhost:9090You will see a Prometheus UI Page. Click Alert and you should find the alert there.
This guide provides you with a step-by-step understanding of the procedure. You can modify the the configuration to satisfy your business requirements.