Redhat Developers  Logo
  • Products

    Featured

    • Red Hat Enterprise Linux
      Red Hat Enterprise Linux Icon
    • Red Hat OpenShift AI
      Red Hat OpenShift AI
    • Red Hat Enterprise Linux AI
      Linux icon inside of a brain
    • Image mode for Red Hat Enterprise Linux
      RHEL image mode
    • Red Hat OpenShift
      Openshift icon
    • Red Hat Ansible Automation Platform
      Ansible icon
    • Red Hat Developer Hub
      Developer Hub
    • View All Red Hat Products
    • Linux

      • Red Hat Enterprise Linux
      • Image mode for Red Hat Enterprise Linux
      • Red Hat Universal Base Images (UBI)
    • Java runtimes & frameworks

      • JBoss Enterprise Application Platform
      • Red Hat build of OpenJDK
    • Kubernetes

      • Red Hat OpenShift
      • Microsoft Azure Red Hat OpenShift
      • Red Hat OpenShift Virtualization
      • Red Hat OpenShift Lightspeed
    • Integration & App Connectivity

      • Red Hat Build of Apache Camel
      • Red Hat Service Interconnect
      • Red Hat Connectivity Link
    • AI/ML

      • Red Hat OpenShift AI
      • Red Hat Enterprise Linux AI
    • Automation

      • Red Hat Ansible Automation Platform
      • Red Hat Ansible Lightspeed
    • Developer tools

      • Red Hat Trusted Software Supply Chain
      • Podman Desktop
      • Red Hat OpenShift Dev Spaces
    • Developer Sandbox

      Developer Sandbox
      Try Red Hat products and technologies without setup or configuration fees for 30 days with this shared Openshift and Kubernetes cluster.
    • Try at no cost
  • Technologies

    Featured

    • AI/ML
      AI/ML Icon
    • Linux
      Linux Icon
    • Kubernetes
      Cloud icon
    • Automation
      Automation Icon showing arrows moving in a circle around a gear
    • View All Technologies
    • Programming Languages & Frameworks

      • Java
      • Python
      • JavaScript
    • System Design & Architecture

      • Red Hat architecture and design patterns
      • Microservices
      • Event-Driven Architecture
      • Databases
    • Developer Productivity

      • Developer productivity
      • Developer Tools
      • GitOps
    • Secure Development & Architectures

      • Security
      • Secure coding
    • Platform Engineering

      • DevOps
      • DevSecOps
      • Ansible automation for applications and services
    • Automated Data Processing

      • AI/ML
      • Data Science
      • Apache Kafka on Kubernetes
      • View All Technologies
    • Start exploring in the Developer Sandbox for free

      sandbox graphic
      Try Red Hat's products and technologies without setup or configuration.
    • Try at no cost
  • Learn

    Featured

    • Kubernetes & Cloud Native
      Openshift icon
    • Linux
      Rhel icon
    • Automation
      Ansible cloud icon
    • Java
      Java icon
    • AI/ML
      AI/ML Icon
    • View All Learning Resources

    E-Books

    • GitOps Cookbook
    • Podman in Action
    • Kubernetes Operators
    • The Path to GitOps
    • View All E-books

    Cheat Sheets

    • Linux Commands
    • Bash Commands
    • Git
    • systemd Commands
    • View All Cheat Sheets

    Documentation

    • API Catalog
    • Product Documentation
    • Legacy Documentation
    • Red Hat Learning

      Learning image
      Boost your technical skills to expert-level with the help of interactive lessons offered by various Red Hat Learning programs.
    • Explore Red Hat Learning
  • Developer Sandbox

    Developer Sandbox

    • Access Red Hat’s products and technologies without setup or configuration, and start developing quicker than ever before with our new, no-cost sandbox environments.
    • Explore Developer Sandbox

    Featured Developer Sandbox activities

    • Get started with your Developer Sandbox
    • OpenShift virtualization and application modernization using the Developer Sandbox
    • Explore all Developer Sandbox activities

    Ready to start developing apps?

    • Try at no cost
  • Blog
  • Events
  • Videos

A guide to premade grafana-pcp dashboard development

November 21, 2024
Sam Feifer
Related topics:
ObservabilityOpen source
Related products:
Red Hat Enterprise Linux

Share:

    Creating Grafana dashboards from scratch can be a tedious process. To help grafana-pcp users get started visualizing Performance Co-Pilot (PCP) metrics immediately, the Performance Co-Pilot plugin for Grafana includes some premade dashboards. The grafana-pcp plug-in and the 3 included datasources each have dashboards that a user can import.

    These dashboards do a great job of getting a user started and visualizing a lot of important metrics in a useful way; however, different use cases call for different visualizations. There might be a common use case that does not yet have a premade dashboard bundled in the grafana-pcp plug-in.

    The premade dashboard files in the grafana-pcp plug-in are .jsonnet files. They can be found along with the rest of the grafana-pcp sources in the Performance Co-Pilot Grafana plug-in GitHub repository. The dashboard files are located in the following directories:

    • Plug-in dashboards: src/dashboards

    • Vector dashboards: src/datasources/vector/dashboards 

    • Redis dashboards: src/datasources/redis/dashboards 

    • bpftrace dashboards:  src/datasources/bpftrace/dashboards 

    For a new premade dashboard for the vector datasource, a new Jsonnet file would be created in src/datasources/vector/dashboards.

    Using one of the current Jsonnet files as a guide can help get the dashboard started.

    Example: Top CPU consuming processes dashboard

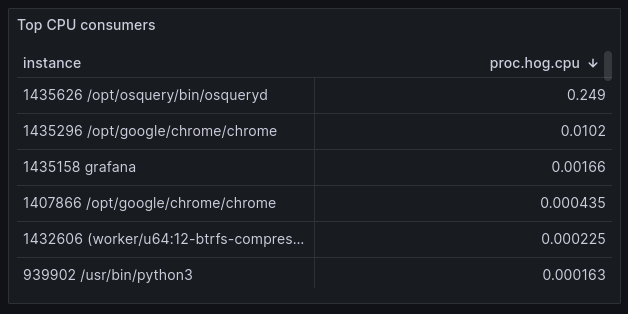
    Figure 1 shows the full finished dashboard and Figure 2 shows a zoomed-in view of the table from the finished dashboard. The following guide goes through developing this dashboard as a premade Jsonnet file in the grafana-pcp plug-in.

    Screenshot of the Top CPU consumers dashboard
    Figure 1: Top CPU Consumers Dashboard
    Figure 1: Top CPU consumers dashboard.
    Zoomed in view of the Top CPU consumers table
    Figure 2. Zoomed in view of the Top CPU Consumers table from the Top CPU Consumers dashboard
    Figure 2: Zoomed-in view of the Top CPU consumers table from the Top CPU consumers dashboard.

    Create a file named pcp-vector-top-cpu-consumers.jsonnet in src/datasources/vector/dashboards and on the first line, import the Grafana library for Jsonnet:

    local grafana = import 'grafonnet/grafana.libsonnet';

    Next, create the dashboard for the datasource. The example below is creating a dashboard for the PCP Vector datasource. The title of the dashboard is "Top CPU Consumers". The dashboard will display metrics from the last 5 minutes (now-5m). Every 5 seconds, the visualization will refresh (update the data). See below:

    grafana.dashboard.new(
        'Top Consumers',
        tags=['pcp-vector'],
        time_from='now-5m',
        time_to='now',
        refresh='5s',
    )
    .addTemplate(
      grafana.template.datasource(
        'datasource',
        'performancecopilot-vector-datasource',
        'PCP Vector',
      )
    )

    Now that the dashboard is set up, visualizations can be added. In this example, we are creating a table. There are examples of graph panels (time series) and other types of visualizations in the other dashboards bundled with grafana-pcp. It is recommended to use these as a guide when creating a visualization of the same type.

    This table will have the title "Top CPU Consumers" and track the proc.hog.cpu metric, which displays the amount of CPU a process is using. The table sorts the instances by their value of proc.hog.cpu in descending order. The resulting visualization lists the processes on a system by their amount of CPU consumption, which can help identify processes that may be using too much CPU.

    The size of the table is determined by the values of w and h. The table's position is denoted by the values of x and y. See below:

    .addPanel(
        grafana.tablePanel.new(
            'Top CPU consumers',
            datasource='$datasource',
            styles=null,
        ) 
        .addTargets([
            { expr: 'proc.hog.cpu', format: 'metrics_table', legendFormat: '$metric' },
        ])  + { options+: {sortBy: [{desc: true, displayName: 'proc.hog.cpu'}]}}, gridPos={
            x: 0,
            y: 0,
            w: 12,
            h: 8,
        }
    )

    Test the dashboard

    After creating the Jsonnet file and making a first draft of the dashboard, it is time to test the dashboard out on Grafana.

    To test the dashboard, it must first be compiled into JSON. This step requires the Grafonnet library and the Jsonnet compiler. To make Grafonnet available, pull down the Grafonnet library into the same directory as the new Jsonnet file:

    git clone https://github.com/grafana/grafonnet-lib.git

    Then, install the Jsonnet compiler:

    yum install jsonnet

    Run the following to to compile the Jsonnet into JSON:

    jsonnet -J ./grafonnet-lib pcp-vector-top-cpu-consumers.jsonnet -o pcp-vector-top-cpu-consumers.json

    The newly created JSON file can now be imported into Grafana to test out the dashboard. In Grafana, when creating a new dashboard, it provides the option to Import dashboard. Choose that option and then upload the JSON file and click Import to create the dashboard in Grafana.

    For this dashboard to work, the PCP Vector datasource must be set up with authentication because the proc metrics (proc.hog.cpu) require authentication. You can find the steps for setting up authentication in the grafana-pcp docs: Authentication — grafana-pcp 5.1.2 documentation

    Get the dashboard into grafana-pcp

    To include the dashboard with the PCP Vector datasource, the new dashboard must be added to the PCP Vector datasource's plugin.json. In src/datasources/vector/plugin.json, add the following block:

            {
                "type": "dashboard",
                "name": "PCP Vector: Top CPU Consumer",
                "path": "dashboards/pcp-vector-top-cpu-consumers.json"
            }

    Once the dashboard is ready to be shared, you can open a pull request for the grafana-pcp project with the new Jsonnet file and the addition to the datasource’s plugin.json. Follow this link to the grafana-pcp GitHub repository.

    Next steps: Try it yourself

    The example and steps provided in this article serve as a good starting point for new dashboard development. With the vast number of PCP metrics and expansive set of use cases, grafana-pcp users are in a strong position to develop dashboards that could benefit both themselves and the grafana-pcp community.

    Last updated: December 2, 2024

    Related Posts

    • Generate automated Grafana metrics dashboards for MicroProfile apps

    • Monitor Ansible Automation Platform using Prometheus, Node Exporter, and Grafana

    • How to deploy the new Grafana Tempo operator on OpenShift

    • Monitor an Ansible Automation Platform database using Prometheus and Grafana

    Recent Posts

    • How to deploy EVPN in OpenStack Services on OpenShift

    • Ollama or vLLM? How to choose the right LLM serving tool for your use case

    • How to build a Model-as-a-Service platform

    • How Quarkus works with OpenTelemetry on OpenShift

    • Our top 10 articles of 2025 (so far)

    What’s up next?

    This cheat sheet covers the basics of installing .NET on Red Hat Enterprise Linux (RHEL), how to get a simple program running, and how to run a program in a Linux container.

    Get the cheat sheet
    Red Hat Developers logo LinkedIn YouTube Twitter Facebook

    Products

    • Red Hat Enterprise Linux
    • Red Hat OpenShift
    • Red Hat Ansible Automation Platform

    Build

    • Developer Sandbox
    • Developer Tools
    • Interactive Tutorials
    • API Catalog

    Quicklinks

    • Learning Resources
    • E-books
    • Cheat Sheets
    • Blog
    • Events
    • Newsletter

    Communicate

    • About us
    • Contact sales
    • Find a partner
    • Report a website issue
    • Site Status Dashboard
    • Report a security problem

    RED HAT DEVELOPER

    Build here. Go anywhere.

    We serve the builders. The problem solvers who create careers with code.

    Join us if you’re a developer, software engineer, web designer, front-end designer, UX designer, computer scientist, architect, tester, product manager, project manager or team lead.

    Sign me up

    Red Hat legal and privacy links

    • About Red Hat
    • Jobs
    • Events
    • Locations
    • Contact Red Hat
    • Red Hat Blog
    • Inclusion at Red Hat
    • Cool Stuff Store
    • Red Hat Summit
    © 2025 Red Hat

    Red Hat legal and privacy links

    • Privacy statement
    • Terms of use
    • All policies and guidelines
    • Digital accessibility

    Report a website issue