Prometheus is widely used within monitoring and alerting stacks for Red Hat OpenShift and Kubernetes environments. It is an essential part of the OpenShift monitoring stack, and is also a part of the Cloud Native Computing Foundation (CNCF). One of its benefits is the ability to stack instances of Prometheus and other compatible tools (Grafana, Thanos, etc.) on top of one another in order to use metrics from monitored systems to perform tasks such as federating, filtering, aggregating, alerting and so on.
There are several ways to relay metrics between such instances—each has its pros and cons. But in this article, I’d specifically like to discuss a method called remote-write and provide a way to quickly set it up outside of the cluster in a local Podman environment. I’ve been looking for such an environment while trying to experiment with some remote-write configurations before deploying them to a cluster. I couldn’t find good examples, so I came up with one.
But first, I will present a little background.
What is Prometheus?
Prometheus is an open source monitoring software. It stores time series for metrics, where each metric is defined by a name and a unique set of arbitrary key-value pairs called labels. The only thing that changes for a given time series throughout the course of time is its value—a numeric value of a given type.
Prometheus is collecting those metrics by pulling on HTTP endpoints that expose a plaintext page containing a list of metrics (each with name and labels) together with their current value.
For example, the snippet below is taken from a Prometheus instance’s own /metrics endpoint that exposes its own metrics. Each line (excluding those starting with #) starts with a metric name, followed by zero or more labels and values (in curly braces), ending with a numeric value.
# HELP go_gc_duration_seconds A summary of the pause duration of garbage collection cycles.
# TYPE go_gc_duration_seconds summary
go_gc_duration_seconds{quantile="0"} 2.7755e-05
go_gc_duration_seconds{quantile="0.25"} 2.826e-05
…
go_gc_duration_seconds_sum 0.001053315
go_gc_duration_seconds_count 7
# HELP go_goroutines Number of goroutines that currently exist.
# TYPE go_goroutines gauge
go_goroutines 29
# HELP net_conntrack_dialer_conn_failed_total Total number of connections failed to dial by the dialer a given name.
# TYPE net_conntrack_dialer_conn_failed_total counter
net_conntrack_dialer_conn_failed_total{dialer_name="alertmanager",reason="refused"} 0
net_conntrack_dialer_conn_failed_total{dialer_name="alertmanager",reason="resolution"} 0
net_conntrack_dialer_conn_failed_total{dialer_name="alertmanager",reason="timeout"} 0
…
If a Prometheus instance will pull on (or scrape) this endpoint, it will create a time series in its database for each unique combination of metrics name and labels’ names and values, and will periodically collect the metric value for each metric and add it to the respective time series.
Prometheus remote-write
The example above suggests that Prometheus instances can be scraped by other Prometheus instances, but there are also several other ways to stack Prometheus and Prometheus-like instances. One such example is federation, in which the Prometheus instance exposes yet another HTTP endpoint that can be scraped by other instances.
Here, we’re going to discuss a push-based option called remote-write. The remote-write protocol is intended to allow Prometheus instances to actively send the metrics they collect/receive to other instances.
Setup requires enabling remote-write sending and receiving on the relevant parties, configuring the sender with the receiver’s target URL, setting up authentication, and deciding what information we want to send to the receiving end. This lab setup deals with configuring what to transmit.
Lab setup
In my work, I was tasked with configuring remote-write from different Prometheus instances to a receiving endpoint that will centralize presentation and alerting for the metrics collected by those instances. As mentioned, there are some aspects for getting the connection working between the sender and the receiver, but one thing I was missing was the ability to convince myself in advance that once I get the connection going, I’m only going to send the information I intended to send and not something else (potentially flooding the target system with unwanted data).
For that purpose, I was looking for a quick way to test my configurations before having them deployed to a real environment—that's where the remote-write mini lab comes in.
The lab requires Podman to be installed, but it can be used with Docker with some modifications. It contains Prometheus configurations adapted from Prometheus’ GitHub repository for creating two Prometheus instances, a writer and a reader. It also contains the commands required for running those instances.
First, clone the GitHub repository:
git clone git@github.com:yftacherzog/prom-remote-write.git
Run the reader:
cd prom-remote-write
podman run --rm \
    --privileged \
    -p 9090:9090 \
    -v./config/reader:/etc/prometheus \
    prom/prometheus \
    --config.file=/etc/prometheus/prometheus.yml \
    --web.enable-remote-write-receiver
Your terminal should now tail the Prometheus logs (let it tail for now):
ts=2023-09-27T09:15:06.294Z caller=main.go:539 level=info msg="No time or size retention was set so using the default time retention" duration=15d
…
ts=2023-09-27T09:17:27.454Z caller=manager.go:1009 level=info component="rule manager" msg="Starting rule manager..."
On another terminal window, run the writer (note the ports difference, and the absence of remote-write-receiver flag):
cd prom-remote-write
podman run --rm \
    --privileged \
    -p 9070:9090 \
    -v./config/writer:/etc/prometheus \
    prom/prometheus \
    --config.file=/etc/prometheus/prometheus.yml
The logs should look similar to the reader except for the last line, which will indicate (after a few seconds) that remote-write is working:
ts=2023-09-27T09:23:11.305Z caller=main.go:539 level=info msg="No time or size retention was set so using the default time retention" duration=15d
…
ts=2023-09-27T09:23:11.313Z caller=manager.go:1009 level=info component="rule manager" msg="Starting rule manager..."
ts=2023-09-27T09:23:24.247Z caller=dedupe.go:112 component=remote level=info remote_name=931a9a url=http://host.containers.internal:9090/api/v1/write msg="Done replaying WAL" duration=12.934864615s
You should now be able to browse to both instances and see the Prometheus UI.
Reader: http://localhost:9090/
Writer: http://localhost:9070/
Now let’s examine the reader’s configurations:
...
scrape_configs:
  # The job name is added as a label `job=<job_name>` to any timeseries scraped from this config.
  - job_name: "prometheus"

    # metrics_path defaults to '/metrics'
    # scheme defaults to 'http'.

    # static_configs:
    #   - targets: ["localhost:9090"]
The reader is not scraping anything. In fact, if you kill both instances (do it—press Ctrl+C on both terminals) and restart only the reader, you won’t have any metrics available for presentation on that instance.
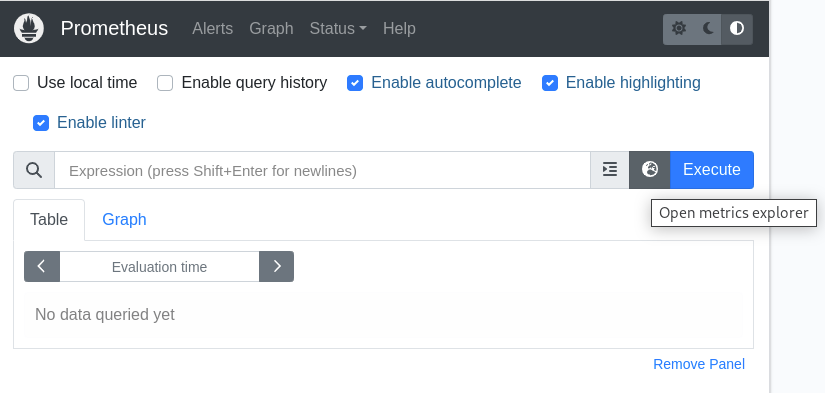
Browse to http://localhost:9090/graph and click the metrics explorer button (Figure 1).
The Metrics Explorer should show no results (Figure 2).

Both instances are generating metrics of their own (check out http://localhost:9090/metrics).
If we examine the writer’s configurations, we’ll see that the writer is scraping the metrics it generates:
scrape_configs:
  # The job name is added as a label `job=<job_name>` to any timeseries scraped from this config.
  - job_name: "prometheus"

    # metrics_path defaults to '/metrics'
    # scheme defaults to 'http'.

    static_configs:
      - targets: ["localhost:9090"]

remote_write:
  - url: "http://host.containers.internal:9090/api/v1/write"

    write_relabel_configs:
      # drop specific metrics from remote-write
    - source_labels: ['__name__']
      regex: 'go_gc_.*'
      action: 'drop'

      # keep only specific labels for the kept metrics
    - regex: '__name__|instance|job|version|branch'
      action: 'labelkeep'
It is also configured to remote-write to the reader. In a real environment, some authentication configurations will be required here, but for now we keep it very simple. Lastly, it contains some write_relabel_configs, which we’ll discuss in a moment.
If you now restart the writer as well, in a few seconds, you could reload the reader page and see metrics on its metrics explorer (Figure 3). You could see almost the exact same picture on the writer as well in.

This means our connection works. Now we can experiment a bit.
We consult the Prometheus configurations reference – specifically, the remote-write section. There, we look at write_relabel_configs, which points us to generic relabel configurations used for other purposes as well.
Relabeling allows us to decide which metrics and which labels we want to remote-write. I won’t repeat what’s explained there, but instead demonstrate how we use it in our setup.
write_relabel_configs is a list of actions applied in order. Each entry filters or modifies the set of metrics we send—both in terms of the identity of the metrics we send (the number of rows in the output) and in terms of the labels each metric has (the columns).
Our current configurations already contain a couple of actions:
    write_relabel_configs:
      # drop specific metrics from remote-write
    - source_labels: ['__name__']
      regex: 'go_gc_.*'
      action: 'drop'

      # keep only specific labels for the kept metrics
    - regex: '__name__|instance|job|version|branch'
      action: 'labelkeep'
The first action drops all metrics with names satisfying the mentioned regular expression. namely, any metric name that starts with go_gc_.
The second action drops all labels other than the ones on the regular expression (__name__ is the internal label for the metric name).
Note that the first action affects the metric along with all its associated labels, while the second affects labels on any metric. In other words, the first action removes rows in the output, and the second action removes columns from metrics containing those labels.
If we check the writer at http://localhost:9070/graph and search for metrics conforming to the regex of the first action, we’re going to see some results (Figure 4).

If we do the same for the reader at http://localhost:9090/graph, we should get nothing (Figure 5).

Next, let’s do another example in which we add a label to every metric.
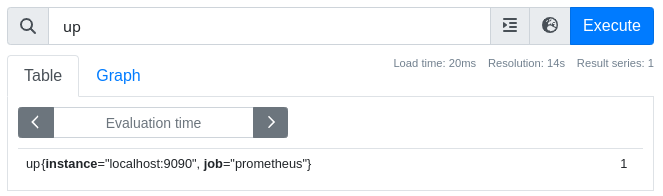
If we examine the up metric on the reader before the change, we see this in Figure 6:

We now add an action under the existing actions on the writer’s configurations as follows:
remote_write:
  - url: "http://host.containers.internal:9090/api/v1/write"

    write_relabel_configs:
      # drop specific metrics from remote-write
    - source_labels: ['__name__']
      regex: 'go_gc_.*'
      action: 'drop'

      # keep only specific labels for the kept metrics
    - regex: '__name__|instance|job|version|branch'
      action: 'labelkeep'

    - action: 'replace'
      target_label: 'source'
      replacement: 'writer-prometheus'
This adds a label called source with value writer-prometheus to every metric to be sent from the writer. After we save the file and restart the writer, we should see another label added to this (or any other) metric on the reader (Figure 7).

We can also confirm that the relabeling done under remote-write, only affects the receiving end, and not the metrics on the origin, as the same query on the writer will be left unchanged (Figure 8).
Lastly, let’s have an example in which we modify a selected label based on its value, and only for a specific metric:
remote_write:
  - url: "http://host.containers.internal:9090/api/v1/write"

    write_relabel_configs:
      # drop specific metrics from remote-write
    - source_labels: ['__name__']
      regex: 'go_gc_.*'
      action: 'drop'

      # keep only specific labels for the kept metrics
    - regex: '__name__|instance|job|version|branch'
      action: 'labelkeep'

    - action: 'replace'
      target_label: 'source'
      replacement: 'writer-prometheus'

    - source_labels:
      - '__name__'
      - 'source'
      separator: ;
      regex: '(up);(writer-prometheus)'
      target_label: 'job'
      action: 'replace'
      replacement: '${2}-baz'
Let’s go over the first three fields one by one.
source_labels: the labels according to which metrics will be selected for evaluation. separator: the separator used in the regex field to separate between the values of the different labels. regex: the regular expression according to which the metrics will be selected.
In this case, the combination of the fields above, means that this action is going to apply to metrics named up that have a source label with value writer-prometheus. The last part is redundant in this case, as all metrics have the same value for this label, but it’s included here to demonstrate having more than a single regex match group.
Next fields are about the transformation to be made to the selected metrics:
target_label: the name of the label on the selected metrics to be affected. action: the action to apply on the target label (additional actions documented here) replacement: the content to replace the target label with.
Here, the combination of these fields means that we will replace the job label on the selected metrics with the value of the second (${2}) regex match group (writer-prometheus) followed by the literal -baz.
If we now restart the writer, we can run a query on the reader to confirm that we only modified the selected metrics, and in the way that we intended (Figure 9).

The relabeling might not make perfect sense, but the idea behind it is to demonstrate how to use the suggested approach and to touch on a few aspects about relabeling.
Summary
The idea behind this article was to give a very brief background for Prometheus and remote-write and to provide a simple procedure for experimenting with remote-write relabeling. There’s a lot more to Prometheus and remote-write than we covered, but hopefully this can bridge a gap for someone as it did for me.
Note: The configurations used in this lab are direct Prometheus configurations.
In my daily job, I seldom configure Prometheus directly. Instead, we use different Prometheus Operators (e.g., Prometheus Operator, OpenShift Cluster Monitor Operator, Observability Operator) that react upon Kubernetes Custom Resources (CRs) to create, configure and maintain Prometheus instances.
The configurations within such CRs result in creation of Prometheus configurations which slightly differ in syntax compared to the CR itself. Most notably, Prometheus configurations follow the snake_case, while the operators follow the camelCase. So, for example, to have remote_write configured in Prometheus, the Kubernetes CR will contain remoteWrite configurations, and target_label will similarly be replaced with targetLabel. This is something to keep in mind when using any configurations created using the lab and applying them to operators-maintained instances.
It is also possible that some configurations supported in Prometheus are not supported by the operator you’re using, so this is another aspect to keep in mind, although I did not run into such issues with configurations related to remote-write.