Since version 7.4, Red Hat Process Automation Manager (RHPAM) and Red Hat Decision Manager (RHDM) provide support for monitoring various metrics through Prometheus. The platform's Execution Server (also known as KIE-Server) provides a Prometheus extension which, if enabled, exposes metrics like the number of containers deployed, the response time of rule and decision evaluations, etc.
In this example, we will use the RHDM 7 Insurance Pricing Demo as our base project. This demo contains a simple Decision Model and Notation (DMN) model that calculates the insurance price based on the age of the customer and whether the customer had previous incidents. The GitHub repository for this demo can be found here and contains detailed instructions on how to set up and run the demo.
The KIE-Server Prometheus extension
By default, the KIE-Server Prometheus extension is disabled. This extension can be enabled by setting the Java System Property org.kie.prometheus.server.ext.disabled to false. This task can, for example, be done when starting the Red Hat JBoss Enterprise Application Platform (JBoss EAP) server:
$ ./standalone.sh -Dorg.kie.prometheus.server.ext.disabled=false
Or, the extension can be configured in the <system-properties> section of the JBoss EAP server configuration file (e.g. standalone.xml):
<property name="org.kie.prometheus.server.ext.disabled" value="false"/>
When the extension is enabled, it provides a number of out-of-the-box metrics for Drools (both rules and DMN decisions), OptaPlanner, and jBPM deployments. The metrics are available at the URL: http://<host>:<port>/kie-server/services/rest/metrics.
This image shows the metrics in a vanilla Red Hat Decision Manager 7.5 Execution Server, with a single DMN project (KJAR) deployed, after a single DMN evaluation:
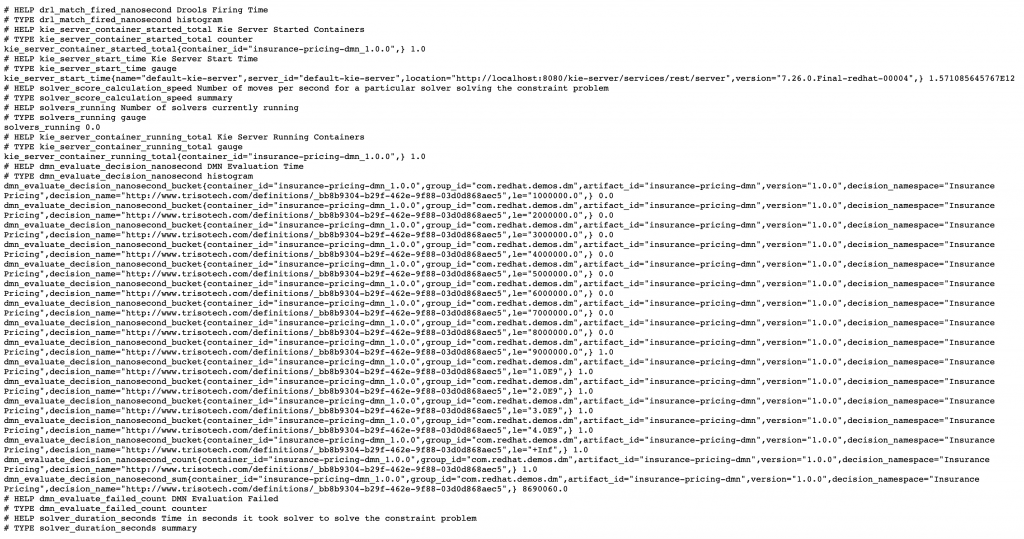
We can see that KIE-Server provides out-of-the-box metrics for, for example, the response time of the DMN evaluations. Depending on the type of deployment (e.g., DMN, Drools, jBPM), the Prometheus extension enables different metrics.
Custom metrics: The KIE-Server PrometheusMetricsProvider
The Prometheus extension of KIE-Server has a pluggable architecture, so users of the platform to write their own extensions. This allows us to write extensions that collect domain-specific metrics of our decision models, rules, and processes. For example, we can write an extension that provides metrics about the actual decisions that a DMN decision node takes, such as the price of insurance. Say that the price of insurance is between $1,000 and $3,000. We can define a Prometheus KIE-Server Extension that creates a Prometheus histogram that allows us to keep track of the distribution of insurance prices.
To implement custom Prometheus metrics, the extension provides the PrometheusMetricsProvider interface. This interface defines methods that allow you to return various Drools, DMN, OptaPlanner, and jBPM EventListeners. When the custom PrometheusMetricsProvider is registered, the extension registers the EventListeners dynamically with the various runtimes.
Your custom PrometheusMetricsProvider is registered via the Java ServiceLoader mechanism. For example, a file with the name org.kie.server.services.prometheus.PrometheusMetricsProvider must be placed in your project's /META-INF/services folder. The content of this file is the fully qualified class name of your PrometheusMetricsProvider implementation. When you place your PrometheusMetricsProvider's JAR file in the WEB-INF/lib folder of the KIE-Server, the provider is automatically discovered and registered.
Your first KIE-Server PrometheusMetricsProvider
Let's write our first provider, which offers simple metrics for our Red Hat Decision Manager Insurance Pricing DMN demo that monitors the distribution of insurance prices determined by the DMN model. First, we create a simple Java Maven project. We use the Maven archetype approach to scaffold a new project:
$ mvn archetype:generate -DgroupId=com.redhat.demos.dm -DartifactId=insurance-pricing-dmn-prometheus-provider -Dversion=1.0.0 -DarchetypeArtifactId=maven-archetype-quickstart -DinteractiveMode=false
To the pom.xml file, we add a single dependency (the version to be used depends on the version of your Red Hat Decision Manager or Red Hat Process Automation Manager installation):
<dependency>
  <groupId>org.kie.server</groupId>
  <artifactId>kie-server-services-prometheus</artifactId>
  <version>7.27.0.Final</version>
  <scope>provided</scope>
</dependency>
We also need to add a build section to our pom.xml file to set the Java source and target version:
<build>
  <plugins>
    <plugin>
      <artifactId>maven-compiler-plugin</artifactId>
      <version>3.1</version>
      <configuration>
        <source>1.8</source>
        <target>1.8</target>
      </configuration>
    </plugin>
  </plugins>
</build>
In your project's src/main/java directory, create a Java package with the name com.redhat.demos.dm.prometheus. In this package, create a class with the name InsurancePricingPrometheusMetricsProvider.java. This class must implement the PrometheusMetricsProvider interface.
Provide a default implementation for the methods:
public class InsurancePricingPrometheusMetricsProvider implements PrometheusMetricsProvider {

  public AgendaEventListener createAgendaEventListener(String arg0, KieContainerInstance arg1) {
    return null;
  }

  public AsynchronousJobListener createAsynchronousJobListener() {
    return null;
  }

  public DMNRuntimeEventListener createDMNRuntimeEventListener(KieContainerInstance arg0) {
    return null;
  }

  public DeploymentEventListener createDeploymentEventListener() {
    return null;
  }

  public PhaseLifecycleListener createPhaseLifecycleListener(String arg0) {
    return null;
  }
}
We now define our DMNListener, which will react to events in our DMN engine and collect the Prometheus metrics. In the same package, create a Java class with the name InsurancePricingDMNListener.java. We'll make this class implement the DMNRuntimeEventListener interface:
public class InsurancePricingDMNListener implements DMNRuntimeEventListener {
}
In our InsurancePricingPrometheusMetricsProvider, we can now implement the createDMNRuntimeEventListener method and have it return the DMNRuntimeEventListener implementation we've just created:
public DMNRuntimeEventListener createDMNRuntimeEventListener(KieContainerInstance kci) {
  return new InsurancePricingDMNListener();
}
In our InsurancePricingDMNListener, we define a Histogram in which we will collect our insurance pricings:
private static final Histogram insurancePricing = Histogram.build()
                                                           .name("insurance_pricing")
                                                           .help("Insurance Pricing")
                                                           .labelNames("decision_namespace", "decision_name")
                                                           .buckets(1000, 2000, 3000)
                                                           .register();
Note that in this example, we define our Histogram as a static class member. The reason for this is that the Prometheus Java client only allows you to register a single collector under a given name. Another option would have been to register the collector with a dynamic name. For example, one that depends on the Maven groupId, artifactId, and version of the KieContainerInstance for which we create the collector.
With our Histogram defined, we can now implement the afterEvaluateDecision of the DMNRuntimeEventListener, in which we can retrieve the outcome of the decision and add it to our Prometheus collector:
public void afterEvaluateDecision(AfterEvaluateDecisionEvent event) {
  DecisionNode decisionNode = event.getDecision();
  String decisionNodeName = decisionNode.getName();
  DMNDecisionResult result = event.getResult().getDecisionResultByName(decisionNodeName);

  switch (decisionNodeName) {
    case "Insurance Total Price":
      double resultAsDouble = 0.0;
      Object resultAsObject = result.getResult();
      //We only store if we find and Integer.
      if (resultAsObject instanceof Integer) {
        resultAsDouble = ((Integer) resultAsObject).doubleValue();
        insurancePricing.labels(decisionNode.getModelName(), decisionNode.getModelNamespace()).observe(resultAsDouble);
      }
      break;
    default:
      //Not the decision we want to monitor. Discarding.
      break;
  }
}
What we do in this code is determine the name of the decision that has been taken, and if the name is equal to "Insurance Price Total," add the result of the decision (the insurance price) to the Prometheus histogram.
The finished project can be found here.
Package and deploy the PrometheusMetricsProvider
To deploy our PrometheusMetricsProvider, we first need to package it in a JAR file. We use Maven to do this:
$ mvn clean install
This command will create the insurance-pricing-dmn-prometheus-provider-1.0.0.jar file in the project's target directory. We can now copy this JAR file into the WEB-INF/lib directory of the RHPAM/RHDM Execution Server/KIE-Server.
With our PrometheusMetricsProvider deployed, we can now start the platform with the Prometheus extension enabled:
$ ./target/jboss-eap-7.2/bin/standalone.sh -Dorg.kie.prometheus.server.ext.disabled=false
Run the demo
With your PrometheusMetricsProvider installed and Red Hat Decision Manager running, we can now test our metrics. Consult the demo guide in the Insurance Pricing DMN Demo README to deploy the DMN model to the execution server and execute a request.
When you now consult the Prometheus metrics page in KIE-Server, you can see the following metrics, which record the distribution of the insurance prices determined by the DMN model:

Conclusion
We've now seen how Red Hat Decision Manager and Red Hat Process Automation Manager provide support for Prometheus through the new KIE-Server extension. The extension uses a pluggable architecture, which allows us to plug in custom PrometheusMetricsProviders. These metric providers can augment the out-of-the-box Prometheus metrics with custom, domain-specific, metrics.
Last updated: January 22, 2024
