Redhat Developers  Logo
  • Products

    Featured

    • Red Hat Enterprise Linux
      Red Hat Enterprise Linux Icon
    • Red Hat Enterprise Linux AI
      Linux icon inside of a brain
    • Image mode for Red Hat Enterprise Linux
      RHEL image mode
    • Red Hat OpenShift
      Openshift icon
    • Red Hat Ansible Automation Platform
      Ansible icon
    • Podman Desktop
      Podman Desktop
    • Red Hat Developer Hub
      Developer Hub
    • View All Red Hat Products
    • Linux

      • Red Hat Enterprise Linux
      • Red Hat Universal Base Images (UBI)
      • Red Hat Enterprise Linux for SAP
      • Microsoft SQL Server on Red Hat Enterprise Linux
      • CentOS Linux
    • Java runtimes & frameworks

      • JBoss Enterprise Application Platform
      • Red Hat build of OpenJDK
      • View all
    • Kubernetes

      • Red Hat OpenShift
      • Microsoft Azure Red Hat OpenShift
      • Red Hat OpenShift Virtualization
      • Red Hat OpenShift AI
      • Red Hat OpenShift Lightspeed
    • Integration & App Connectivity

      • AMQ Broker
      • Red Hat Build of Apache Camel
      • Red Hat Service Interconnect
      • Red Hat Connectivity Link
      • View all
    • Automation

      • Red Hat Ansible Automation Platform
      • Red Hat Ansible Automation Platform via AWS Marketplace
      • Red Hat Ansible Lightspeed
      • Ansible automation for applications and services
      • View all
    • Developer tools

      • Red Hat Trusted Software Supply Chain
      • Podman Desktop
      • Red Hat extensions for Podman Desktop
      • Red Hat OpenShift Dev Spaces
      • View all
    • Developer Sandbox

      Developer Sandbox
      Try Red Hat products and technologies without setup or configuration fees for 30 days with this shared Openshift and Kubernetes cluster.
    • Try at no cost
  • Technologies

    Featured

    • AI/ML
      AI/ML Icon
    • Linux
      Linux Icon
    • Kubernetes
      Cloud icon
    • Automation
      Automation Icon showing arrows moving in a circle around a gear
    • Application Platform
      Application Platform icon showing coding brackets
    • View All Technologies
    • Programming Languages & Frameworks

      • Java
      • Python
      • JavaScript
    • System Design & Architecture

      • Red Hat architecture and design patterns
      • Microservices
      • Event-Driven Architecture
      • Databases
    • Developer Productivity

      • Developer productivity
      • Developer Tools
      • GitOps
    • Secure Development & Architectures

      • Security
      • Secure coding
    • Platform Engineering

      • DevOps
      • DevSecOps
      • Ansible automation for applications and services
    • Automated Data Processing

      • AI/ML
      • Data Science
      • Apache Kafka on Kubernetes
      • View All Technologies
    • Start exploring in the Developer Sandbox for free

      sandbox graphic
      Try Red Hat's products and technologies without setup or configuration.
    • Try at no cost
  • Learn

    Featured

    • Kubernetes & Cloud Native
      Openshift icon
    • Linux
      Rhel icon
    • Automation
      Ansible cloud icon
    • Java
      Java icon
    • AI/ML
      AI/ML Icon
    • View All Learning Resources

    Interactive Lessons and Learning Paths

    • Red Hat Enterprise Linux
    • Red Hat OpenShift
    • Red Hat Ansible Automation Platform
    • Red Hat OpenShift AI
    • Java

    Developer Sandbox Activities

    • Get Started
    • Try Hands-On Activities

    E-Books

    • GitOps Cookbook
    • Podman in Action
    • Kubernetes Operators
    • The Path to GitOps
    • View All E-books

    Tutorials

    • Kubernetes
    • Application Development

    Cheat Sheets

    • Linux Commands
    • Bash Commands
    • Git
    • systemd Commands
    • View All Cheat Sheets

    Documentation

    • API Catalog
    • Product Documentation
    • Legacy Documentation
    • Red Hat Learning

      Learning image
      Boost your technical skills to expert-level with the help of interactive lessons offered by various Red Hat Learning programs.
    • Explore Red Hat Learning
  • Events

    Developer Events

    • DevNation
      Join developers across the globe for live and virtual events led by Red Hat technology experts.
    • Explore All Events
    • Tech Talks

      • Getting Gitops
      • GitHub Makeover
      • OpenTelemetry on Kubernetes
      • View All Tech Talks
    • Deep Dives

      • Quinoa: A modern Quarkus UI with no hassles
      • Event-driven autoscaling through KEDA and Knative Integration
      • View All Deep Dives
    • Red Hat Summit 2024

      Red Hat Summit
      Explore select Red Hat Summit 2024 content, including keynote announcements about InstructLab, RHEL AI, and Podman AI Lab.
    • Explore more
  • Developer Sandbox

    Developer Sandbox (free)

    • Try hands-on activities in the Developer Sandbox
      Access Red Hat’s products and technologies without setup or configuration, and start developing quicker than ever before with our new, no-cost sandbox environments.
    • Explore Red Hat OpenShift Dev Spaces

    Featured Developer Sandbox activities

    • Get started with your Developer Sandbox
    • Install and configure Red Hat Developer Hub and explore templating basics

    Ready to start developing apps?

    • Explore the free Developer Sandbox
  • Blog
  • Videos

How to monitor an Eclipse MicroProfile 1.2 server with Prometheus

October 25, 2017
Heiko Rupp
Related topics:
JavaMicroservices

Share:

    Eclipse MicroProfile has added a Monitoring specification in its 1.2 release. This allows for a common way of monitoring servers that implement the specification. In this article, you will learn how to monitor MicroProfile 1.2 servers with the popular Prometheus monitoring system.

    Overview

    I have described the concepts of Eclipse MircoProfile (MP) Monitoring in a previous article: servers expose a basic set of system metrics that are common for each implementation of the MP-Metrics specification. Applications can in addition also make specific metrics available.
    The server then exposes the gathered metric data over http(s) endpoints. Monitoring agents can then connect to the server's /metrics endpoint and poll the data.

    Setting up the (server) runtimes to be monitored

    I am now going to show how to set up the runtimes to use MicroProfile metrics. For this, I am showcasing WildFly Swarm and OpenLiberty as two of the early adopters of the Metrics specification. I will start with WildFly Swarm.

    WildFly Swarm

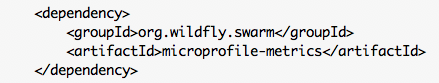
    WildFly Swarm or Swarm for short uses a so-called fat-jar approach: You build your application and then get a jar file that contains the application and all of the server logic, which you then just start via java -jar application-swarm.jar. To enable the MicroProfile Metrics to support, you need to pull in the MicroProfile fraction in your build.
    For Apache Maven users it looks like this:
    After this is done, you just build your project as usual with mvn install, which will create the usual uber-jar in a target.
    When you run it, you will see a line like the following in the server log:
    WFSWARM0013: Installed fraction:     Microprofile-Metrics - EXPERIMENTAL    org.wildfly.swarm:microprofile-metrics:2017.11.0-SNAPSHOT

    Once the server is ready, it is exposing metrics under http://localhost:8080/metrics by default.

    OpenLiberty

    You can download OpenLiberty from its homepage. After downloading and unpacking it, you need to create a server configuration. Pass the respective template in to obtain a MicroProfile configuration.
    $ bin/server create  mp --template=microProfile1
    The /metrics endpoint is secured by default on OpenLiberty.
    You need to add a small addition to the config file under usr/servers/mp1/server.xml inside the <server> element.

    When this is done, you can start the server via bin/server run mp. With the standard settings, the metrics can then be found under https://localhost:9443/metrics. Credentials are
    theUser/thePassword as seen in line 2 of the above snippet.

    Setting up Prometheus

    Now that we have our targets set up to be monitored, we can install Prometheus to monitor them. Prometheus is relatively easy to get going. Just download, unpack and start it. Before you can start it, you need to provide a configuration file. Create a file prom.yml with the following content:
    scrape_configs:
      # Configuration to poll from WildFly Swarm
      - job_name: 'swarm'
        scrape_interval: 15s
    
        # translates to http://localhost:8080/metrics
        static_configs:
          - targets: ['localhost:8080']
    
      # Configuration to poll from OpenLiberty
      - job_name: 'liberty'
        scrape_interval: 15s
        scheme: https
        basic_auth:
          username: 'theUser'
          password: 'thePassword'
    
        tls_config:
          insecure_skip_verify: true
    
        # translates to https://localhost:9443/metrics
        static_configs:
          - targets: ['localhost:9443']
    After editing the file, you can start Prometheus via;
    $prometheus -config.file=prom.yml
    Prometheus will show a few lines about starting and a few seconds later it is ready.
    Head over to your browser and go to http://localhost:9090/.
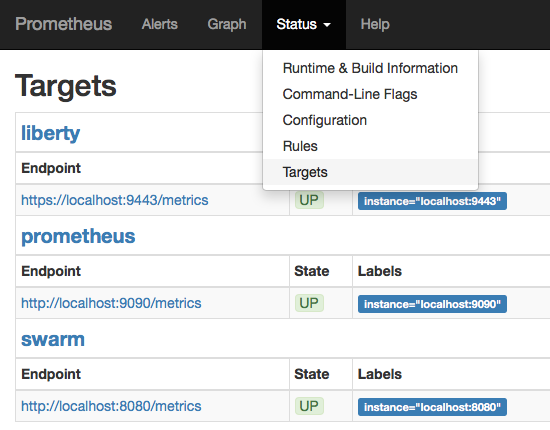
    As a first step select Status -> Targets from the menu and make check that both servers are marked as UP.
    List of Prometheus targets
    List of targets that Prometheus is scraping along with their status
    List of endpoints to be scraped from along with their status.">
    Chose Metrics for display.
    Prometheus metric selector with a list of base: metrics
    Prometheus metric selector with a list of base: metrics">
    When the servers are running, we are ready to display some metrics (that gets more interesting when you wait a while so that Prometheus has polled more data).
    Metrics shown in Prometheus UI
    Metrics as shown in Prometheus UI">

    In the last chart, you can see that we only asked for the metric,base:memory_used_heap_bytes but got two graphs, one per MP-server, as both expose the same metric under the same name. Prometheus is adding labels on the fly, which can then be used to distinguish the servers (green is OpenLiberty, brown is Swarm).

    Conclusion

    MicroProfile Metrics defines a common way to expose metrics from systems. Monitoring tools like Prometheus are thus easily able to monitor those servers in a vendor-independent way.

    At the time of this article, the MP-Metrics code may not yet be in a Swarm release but will be soon.


    To build your Java EE Microservice visit WildFly Swarm and download the cheat sheet.

    Last updated: October 26, 2017

    Recent Posts

    • Containerizing workloads on image mode for RHEL

    • Implement remediation strategies with Event-Driven Ansible

    • Dumping packets from anywhere in the networking stack

    • An overview of virtual routing and forwarding (VRF) in Linux

    • Kafka Monthly Digest: December 2024

    Red Hat Developers logo LinkedIn YouTube Twitter Facebook

    Products

    • Red Hat Enterprise Linux
    • Red Hat OpenShift
    • Red Hat Ansible Automation Platform
    • See all technologies

    Build

    • Developer Sandbox
    • Developer Tools
    • Interactive Tutorials
    • API Catalog
    • Operators Marketplace

    Quicklinks

    • Learning Resources
    • E-books
    • Cheat Sheets
    • Blog
    • Events
    • Newsletter

    Communicate

    • About us
    • Contact sales
    • Find a partner
    • Report a website issue
    • Site Status Dashboard
    • Report a security problem

    RED HAT DEVELOPER

    Build here. Go anywhere.

    We serve the builders. The problem solvers who create careers with code.

    Join us if you’re a developer, software engineer, web designer, front-end designer, UX designer, computer scientist, architect, tester, product manager, project manager or team lead.

    Sign me up

    Red Hat legal and privacy links

    • About Red Hat
    • Jobs
    • Events
    • Locations
    • Contact Red Hat
    • Red Hat Blog
    • Diversity, equity, and inclusion
    • Cool Stuff Store
    • Red Hat Summit

    Red Hat legal and privacy links

    • Privacy statement
    • Terms of use
    • All policies and guidelines
    • Digital accessibility

    Report a website issue