It’s October again, so let me tell you what happened with the clang bytecode interpreter this year. In case this is the first you've encountered this topic: This is a project for a bytecode interpreter in clang to evaluate constant expressions at compile time. This work is already available in all recent clang versions when -fexperimental-new-constant-interpreter is passed.
Previous articles in this series:
According to Git, there were roughly 500 commits since my last blog post. While there was no huge new feature or breakthrough that I can remember now, the implementation got a lot more solid. I’ve also done a good chunk of performance work this year.
While we still had approximately 155 failures in the clang test suite last year, we are now down to 90. You can track the progress here. We now have an actual working implementation of builtin_constant_p. And while it does disagree with the current interpreter in a few edge cases, it should be enough for all real-world use cases (see the section about libc++ testing).
In the remainder of this blog post, let's have a more detailed look at a few of the changes that happened in the last year.
Optimizing reads from known sources
When looking at constant expressions (and especially functions), one might have the urge to optimize things away. Let's say we profile the interpreter and figure out that integer additions are particularly inefficient. We might want to check that the right-hand side of a += compound assignment operator is not 0 and not emit any bytecode if it is.
constexpr int test() {
  int a;
  a += 0;
  a += 1;
  return a;
}
static_assert(test() == 1);
Not doing the first addition here would be faster of course, but if you look closely, you notice that a is left uninitialized, so the first addition already fails. Not emitting it causes the diagnostic to appear for the second addition, which is wrong. You can imagine similar cases for divisions or multiplications by 1, a unary +, or all discarded statements. If they can fail, we need to evaluate them and diagnose failure.
This is only one example, but in general we need to be cautious with optimizations on this level because we need to diagnose all undefined behavior, and quality of the diagnostic output is important.
Let’s instead look at something we can optimize.
constexpr int G = 12;
constexpr int test(int P) {
  int L = 8;
  return G + L + P;
}
static_assert(test(5) == 25);
This code is pretty straightforward and should work. It adds up the values of a global variable, a local variable, and a parameter. For all three values, the abstract syntax tree (AST) that clang generates consists of a node to get a pointer to the variable, and one to load from that variable. In detail, it looks something like this:
      `-ImplicitCastExpr 0x7d5284257a50 <col:18> 'int' <LValueToRValue>
        `-DeclRefExpr 0x7d5284257a28 <col:18> 'int' lvalue ParmVar 0x7d5284257660 'P' 'int'
Here we see the lvalue for the parameter P and the lvalue-to-rvalue cast that loads the value from the parameter. We used to emit bytecode just like this:
[..]
48     GetPtrGlobal      0
64     LoadPopSint32
72     GetPtrLocal       40
88     LoadPopSint32
96     AddSint32
104    GetPtrParam       0
120    LoadPopSint32
128    AddSint32
136    Destroy           0
152    RetSint32
[..]
For brevity, I've removed some less interesting opcodes at the beginning and at the end of the function. As you can see from the bytecode, we get a pointer (GetPtrLocal, GetPtrGlobal, GetPtrParam) for all three values, followed by a load of a 32-bit signed integer (LoadPopSint32). Those values are added up and returned from the function. This works just fine, but we can do better.
Even before this optimization, we had opcodes to get the value of a variable without the need to first get a pointer to it. Instead of a GetPtrGlobal + LoadPop pair, we can instead emit just a GetGlobal opcode, which immediately pushes the value of the global variable on the stack. This reduces traffic on our stack data structure and reduces the amount of pointers we create. The latter is particularly important because we’re always tracking what memory a pointer points to, just in case that memory goes out of scope.
Because the relevant opcodes already existed, we only needed to do some type checks when generating bytecode and the result looks like this:
[...]
48     GetGlobalSint32    0
64     GetLocalSint32     40
80     AddSint32
88     GetParamSint32     0
104    AddSint32
112    Destroy            0
128    RetSint32
[...]
This is nicer to read, and also more efficient. When evaluating LoadPop opcode, we don’t know whether the pointer we load from is a global variable, a local variable, a temporary, a parameter, and so on. We need to be conservative, and do all possible checks. If we know where we load from, then we can skip unnecessary work. For example, loading a value from an extern variable doesn’t generally work, so we need to check for this. But local variables cannot be extern and so we can skip this check for the GetLocal opcode.
libc++ testing
In January 2025, I started running the libc++ test suite in addition to the clang test suite. The libc++ tests provide more real-world use cases whereas the clang test suite usually stress-tests against edge cases in the C and C++ language specifications. As such, the initial run of the libc++ test suite resulted in a large number of failures (Figure 1).
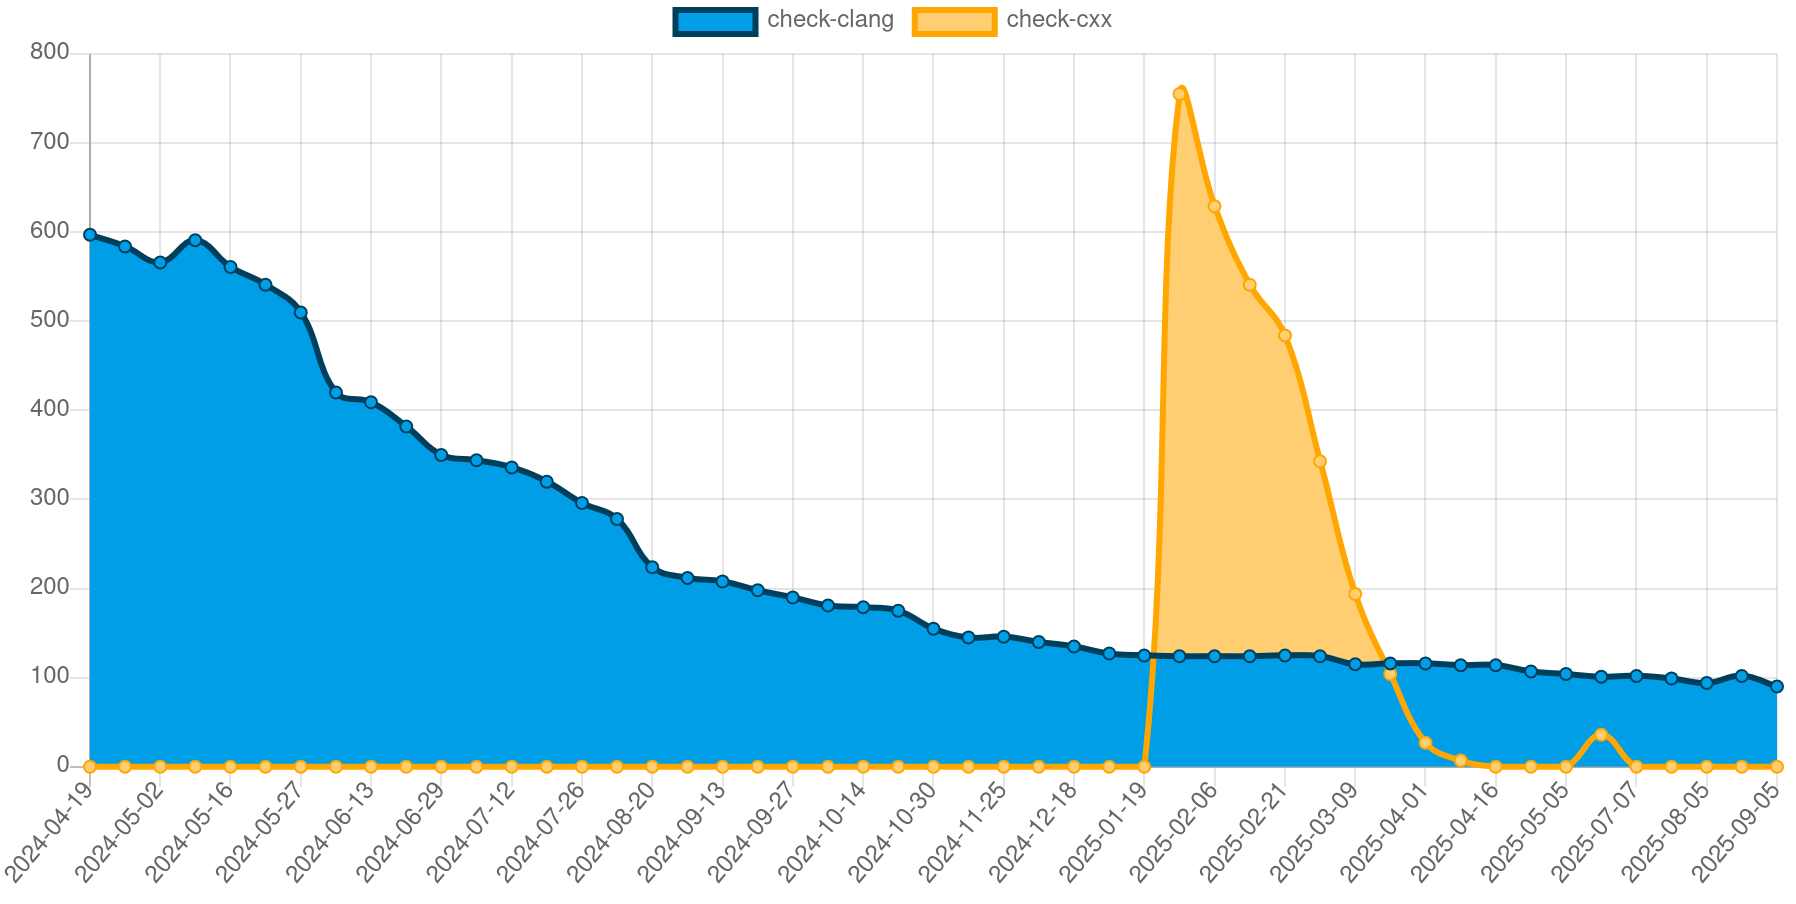
We initially had over 750 test failures. A large chunk of those was caused by missing support for some string builtins. The libc++ test suite extensively tests std::string, after all. Through that and other tests, such as those for std::vector, it also uses dynamic memory allocation at compile time a lot.
The libc++ test cases are usually unfortunately exceedingly complex. Fixing them requires a variation of:
- Letting clang preprocess the test so the result is independent of include files and most command-line options. This usually results in a file that is way too large. The longest one I saw was around 300KLOC.
- Use a mixture of manual editing and running cvise to reduce the test case. If you’ve never had to do something like this: Good! Otherwise, cvise is great and you should know how to use it.
- Debugging the reduced test case to figure out the root cause of the problem.
I often managed to reduce the failing test case to a self-contained test of just a few dozen lines. After three months, we reached the milestone of zero test failures.
Because libc++ is in active development, it changes constantly. This means we sometimes see regressions in the number of test failures, but that's okay.
The #embed benchmark
Let's look at an example benchmark using #embed:
constexpr char str[] = {
#embed "sqlite3.c" suffix(,0)
};
consteval unsigned checksum(const char *s) {
  unsigned result = 0;
  for (const char *p = s; *p != '\0'; ++p) {
    result += *p;
  }
  return result;
}
constexpr unsigned C = checksum(str);
This test case simply reads the sqlite3 amalgamation (which has almost 9MB) into a global char array, then sums up all the character values into a variable C.
Let's time this test with the current interpreter and then with the bytecode interpreter. All runs are using a regular release build of clang with assertions disabled but no other compiler flags set.
hyperfine -r 30 -w 3 'bin/clang -c embed.cpp -std=c++20 -Wno-c23-extensions -fconstexpr-steps=1000000000'
Benchmark 1: bin/clang -c embed.cpp -std=c++20 -Wno-c23-extensions -fconstexpr-steps=1000000000
  Time (mean ± σ):     36.490 s ±  0.361 s    [User: 36.161 s, System: 0.299 s]
  Range (min … max):   35.711 s … 37.611 s    30 runs
hyperfine -r 30 -w 3 'bin/clang -c embed.cpp -std=c++20 -Wno-c23-extensions -fconstexpr-steps=1000000000 -fexperimental-new-constant-interpreter'
Benchmark 1: bin/clang -c embed.cpp -std=c++20 -Wno-c23-extensions -fconstexpr-steps=1000000000 -fexperimental-new-constant-interpreter
  Time (mean ± σ):     14.799 s ±  0.274 s    [User: 14.484 s, System: 0.303 s]
  Range (min … max):   14.332 s … 15.345 s    30 runs
So the bytecode interpreter only needs roughly 50% of the time that the current interpreter takes. That's good, but let's look at some of the (Figure 2).
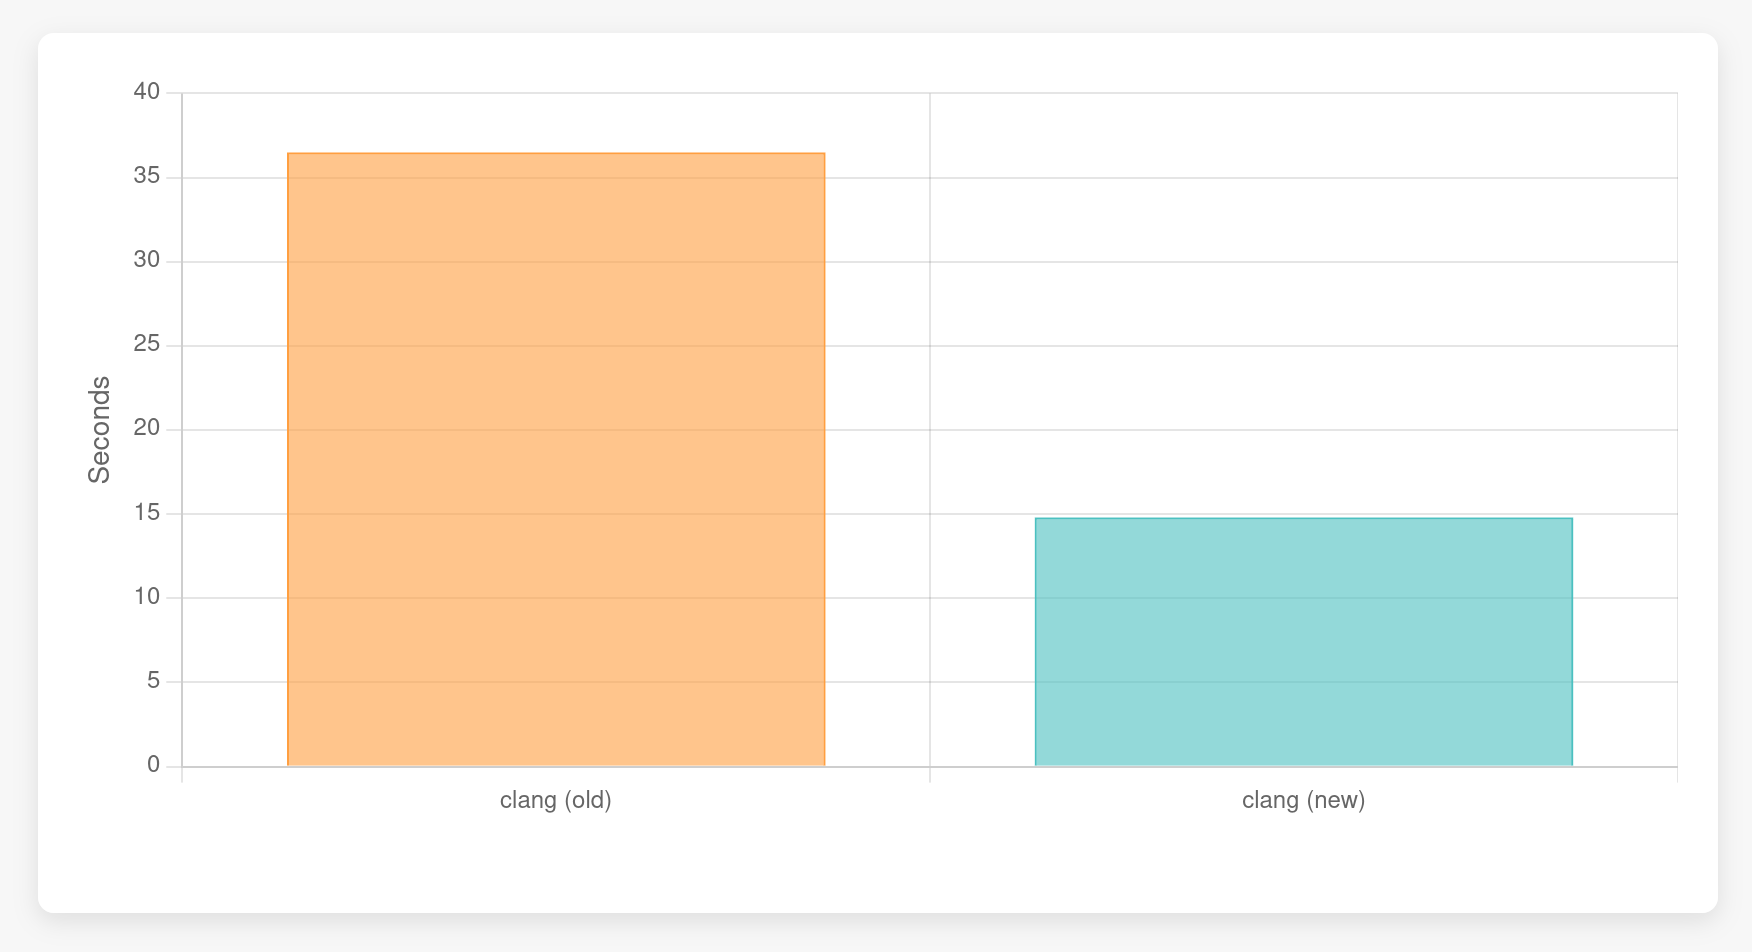
Our test case consists of the first declaration of str, which initializes a large char array. That’s not a function call so the bytecode interpreter doesn’t interpret bytecode here at all, it instead evaluates the expressions as they come. This is similar to what the current interpreter is doing, but the bytecode interpreter has some additional overhead. If we look at the runtime for only the initialization, the bytecode interpreter is slower.
The difference used to be much worse but I've optimized the bytecode interpreter to be more performant when checking large arrays for initialization.
Heap allocation benchmark
Here's another benchmark that I've been looking at in the past year:
constexpr int x = []() {
  for (unsigned I = 0; I != 10'000; ++I) {
    char *buffer = new char[1024];
    for (unsigned c = 0; c != 1024; ++c)
      buffer[c] = 97 + (c % 26);
    delete[] buffer;
  }
  return 1;
}();
This is a pretty simple but useless test benchmarking dynamic memory allocation. We allocate some memory, fill it with some characters, and then we free the memory again. This is all done in a lambda that gets called immediately. The final output is just a variable with the value 1.
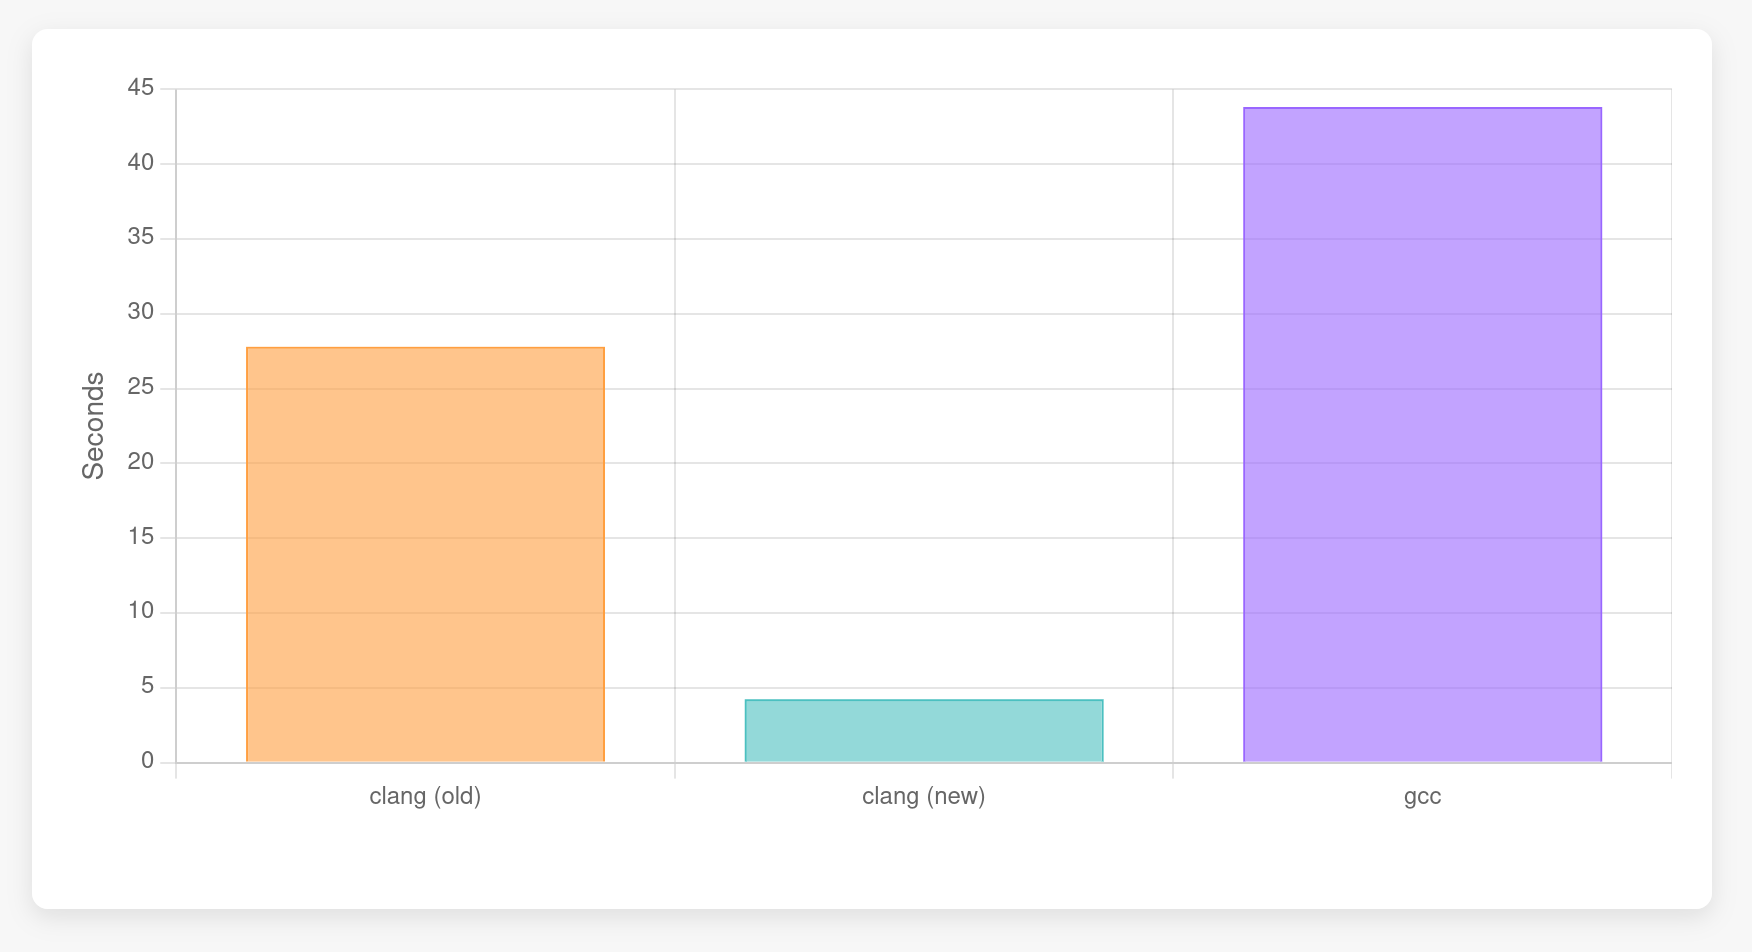
This is a benchmark we can even time against GCC (I was using 14.3.1), so let's do that:
$ hyperfine -r 30 -w 3 'bin/clang -c new-delete.cpp -std=c++23 -fconstexpr-steps=1000000000'
Benchmark 1: bin/clang -c new-delete.cpp -std=c++23 -fconstexpr-steps=1000000000
  Time (mean ± σ):     27.792 s ±  0.263 s    [User: 27.732 s, System: 0.036 s]
  Range (min … max):   27.329 s … 28.287 s    30 runs
$ hyperfine -r 30 -w 3 'bin/clang -c new-delete.cpp -std=c++23 -fconstexpr-steps=1000000000 -fexperimental-new-constant-interpreter'
Benchmark 1: bin/clang -c new-delete.cpp -std=c++23 -fconstexpr-steps=1000000000 -fexperimental-new-constant-interpreter
  Time (mean ± σ):      4.241 s ±  0.103 s    [User: 4.218 s, System: 0.019 s]
  Range (min … max):    4.070 s …  4.504 s    30 runs
$ hyperfine -r 30 -w 3 '/usr/bin/g++ -c new-delete.cpp -std=c++23 -fconstexpr-ops-limit=1000000000'
Benchmark 1: /usr/bin/g++ -c new-delete.cpp -std=c++23 -fconstexpr-ops-limit=1000000000
  Time (mean ± σ):     43.829 s ±  0.308 s    [User: 42.170 s, System: 1.619 s]
  Range (min … max):   43.201 s … 44.556 s    30 runs
Figure 4 illustrates the comparison.
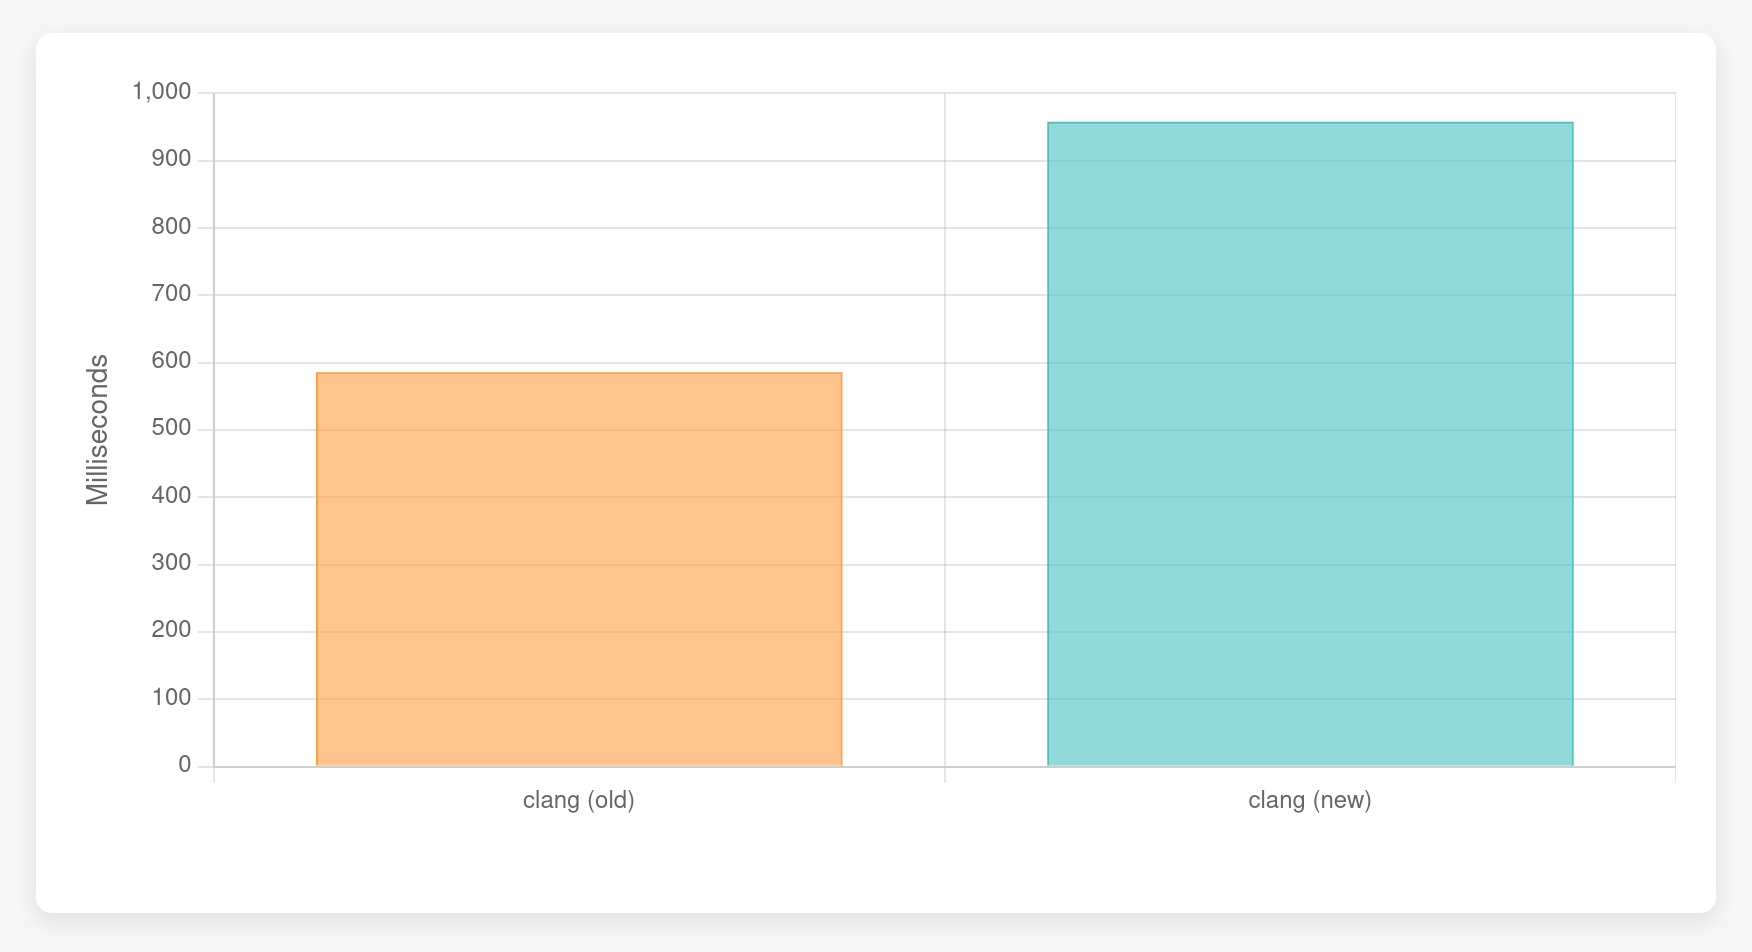
GCC has an interesting optimization that seems to eliminate the heap allocation altogether if it is unused. If we remove the loop initializing the allocated memory (and increase the size from 1024 to 1024 * 1024), GCC is better than both the new and old clang interpreters:
$ hyperfine -r 30 -w 3 'bin/clang -c new-delete.cpp -std=c++23 -fconstexpr-steps=1000000000'
Benchmark 1: bin/clang -c new-delete.cpp -std=c++23 -fconstexpr-steps=1000000000
  Time (mean ± σ):     1048.113 s ± 19.781 s    [User: 783.382 s, System: 263.909 s]
  Range (min … max):   1008.151 s … 1082.708 s    30 runs
$ hyperfine -r 30 -w 3 'bin/clang -c new-delete.cpp -std=c++23 -fconstexpr-steps=1000000000 -fexperimental-new-constant-interpreter'
Benchmark 1: bin/clang -c new-delete.cpp -std=c++23 -fconstexpr-steps=1000000000 -fexperimental-new-constant-interpreter
  Time (mean ± σ):     439.9 ms ±  19.2 ms    [User: 421.7 ms, System: 17.5 ms]
  Range (min … max):   406.7 ms … 475.7 ms    30 runs
$ hyperfine -r 30 -w 3 '/usr/bin/g++ -c new-delete.cpp -std=c++23 -fconstexpr-ops-limit=1000000000'
Benchmark 1: /usr/bin/g++ -c new-delete.cpp -std=c++23 -fconstexpr-ops-limit=1000000000
  Time (mean ± σ):     116.8 ms ±  23.8 ms    [User: 101.0 ms, System: 15.7 ms]
  Range (min … max):    91.4 ms … 152.4 ms    30 runs
In this case, clang with the current interpreter is much slower than both GCC and the bytecode interpreter. Note the logarithmic Y axis in Figure 5,
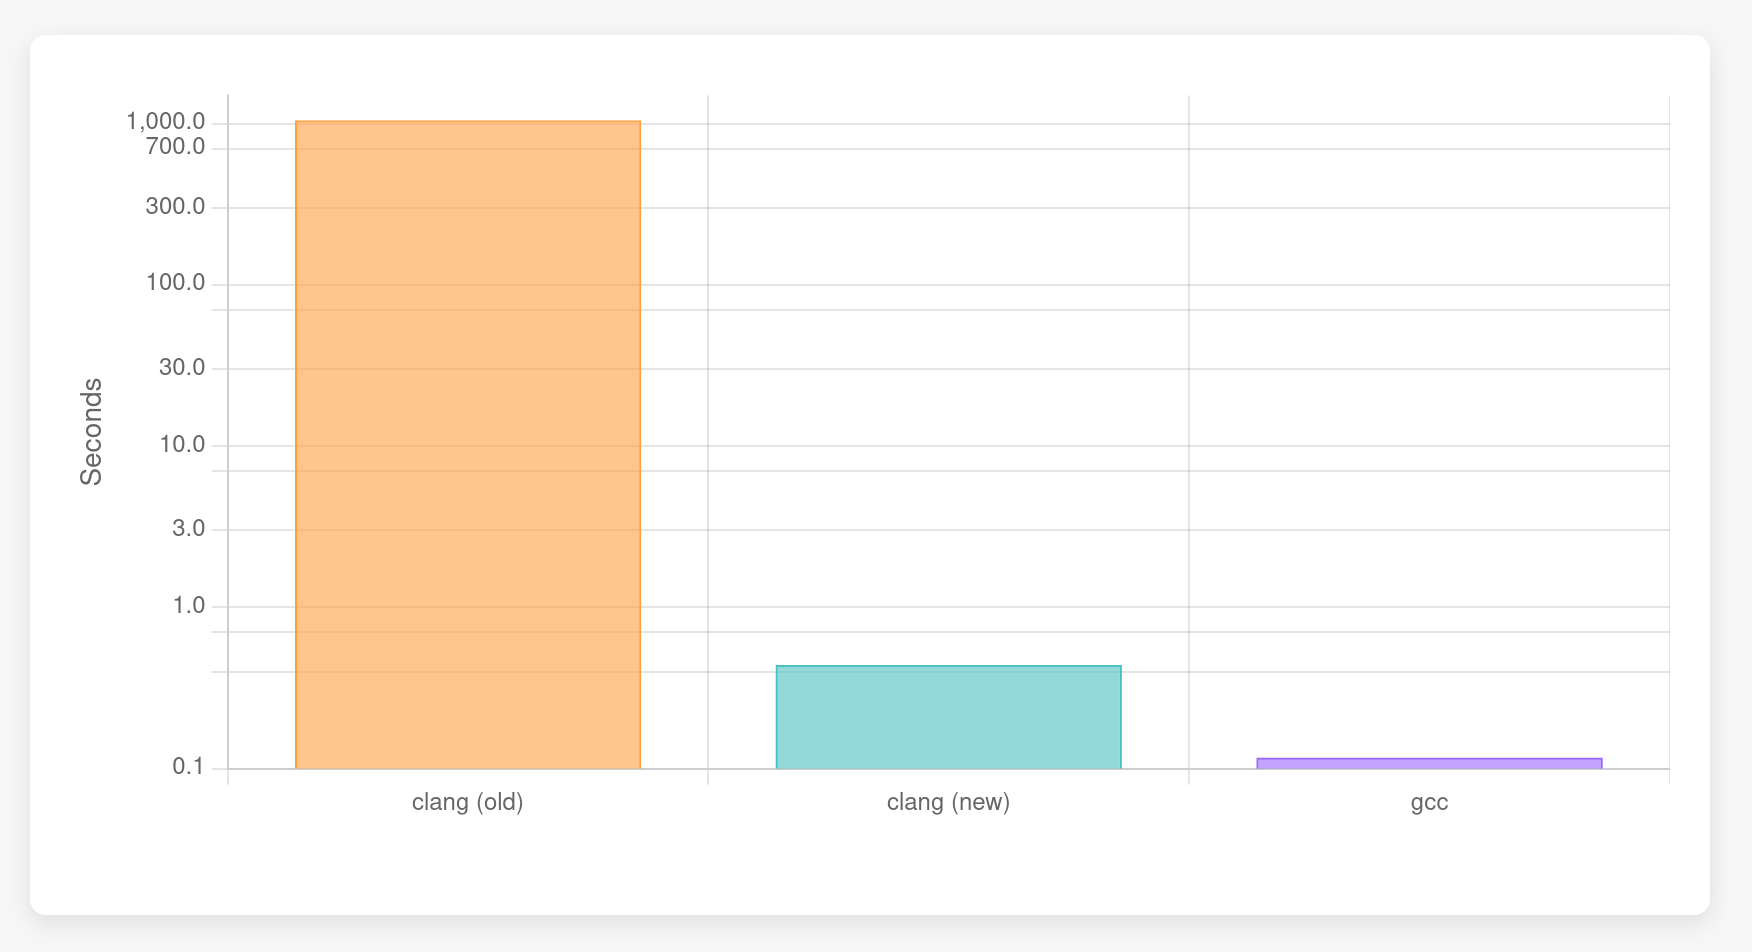
GCC is almost four times as fast as the bytecode interpreter. It either removes the heap allocation entirely or new + delete expressions are just very efficiently implemented. I have not profiled clang with the current interpreter thoroughly but I can imagine that zero-initializing the APValue (the data structure clang uses to represent compile-time evaluated values) of the array already takes that long.
Further work
There are still a few features that need to be implemented, and definitely a few underlying problems. I’ve added a clang:bytecode label in GitHub to track several of them in the upstream LLVM repository.
I'll continue working on this project, and I’ve also asked for help on the LLVM Discourse. Other people have also implemented a lot of the recent vector elementwise builtins. So if you’re interested, you can always try to compile your favorite C or C++ project with -fexperimental-new-constant-interpreter and report all problems (or successes!) you find. Any implementation help is also highly appreciated, of course.
Part of me hopes that this is the last blog post I write about this topic, but see you next year!