Cache configuration in Red Hat Data Grid
This cheat sheet is a quick reference with information and configuration examples for creating and configuring caches in Red Hat Data Grid.

This cheat sheet is a quick reference with information and configuration examples for creating and configuring caches in Red Hat Data Grid.

Explore how to set up effective application monitoring using Event-Driven Ansible automation and Alertmanager on Red Hat OpenShift.

Red Hat is considering building Red Hat Enterprise Linux 10 for the x86-64-v3 microarchitecture level.

This article demonstrates how lazy debuginfo loading improves GDB and Valgrind debugging performance.
Cryostat 2.4 is a monitoring tool for Java that offers a sophisticated and user-friendly approach to performance monitoring in containerized environments.

Check out the top 10 Linux articles we published for developers in 2023, covering new features in Red Hat Enterprise Linux, containers, GCC 13, and more.

Learn how developers can achieve higher performance using the GCC compiler system's vectorization features.

This article highlights the key features of the new Red Hat build of Keycloak.
Explore RHEL 9.3 updates that improve developer experience, including new language runtimes, toolsets, and compilers, system role updates, and more.
Learn how to configure the PMD thread load-based sleeping feature in Open vSwitch with DPDK and see how it can contribute to power saving.

Many apps require more computational resources than a single thread or process can handle. Learn how to meet this need in your Node.js applications.

This article describes the new statistics added for the user space datapath in Open vSwitch 2.17 and later.
This article demonstrates how to use the OpenShift monitoring stack to monitor performance, troubleshoot issues, optimize resource utilization, and more.
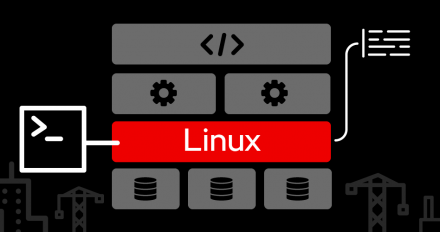
Explore how frame pointers can be used to unwind Linux kernel stack traces and examine different ways to obtain a backtrace, along with their pros and cons.

This article explains two ways I fixed issues in the per-CPU upcall dispatch mode in Open vSwitch, creating a more balanced workload for upcall handler threads.

Learn how Apache Kafka Cruise Control optimizes workload and improves performance.

Learn how to investigate common problems in production, including memory leaks, slow performance, etc.

Discover how to improve application and library security at the source with _FORTIFY_SOURCE macro defined to 3 and how it impacts performance.

Valgrind can be used to track file descriptors. Learn how to find file descriptors at various stages of your program and where they were originally opened.
Learn about 8 optimization techniques for a faster interpreter in Ruby which I developed using a dynamically specialized internal representation (IR).

Learn why graphics processing units (GPUs) have become the foundation of artificial intelligence and how they are being used.

Discover how flexible array members offer convenience and improve performance, and how compiler complexities are mitigated.

Discover the gains and costs of GCC’s enhanced runtime buffer overflow protection. Level 3 _FORTIFY_SOURCE preprocessor macro may detect more buffer overflows, but there’s a cost.

See site reliability engineering (SRE) principles in action and learn how to improve the operability of your code base with this developer coloring book.

Learn from our experts about how SystemTap allows you to add instrumentations to Linux systems to better understand kernel and application behavior.