Monitoring systems in use is one of the greatest challenges in cloud environments. Users always want to know how their applications work in production. For example, they want to know how Red Hat OpenShift utilizes its resources; or how to monitor systems in use like Red Hat AMQ Streams.
AMQ Streams, the enterprise version of Strimzi, exports many useful metrics from Apache Kafka clusters, Apache Zookeeper clusters, and other components. We can use Prometheus to scrape these metrics and display them in Grafana dashboards. Exporting AMQ Streams metrics to Grafana is quite easy, and using the existing monitoring stack on OpenShift 4 is easy, as well.
This article shows you how to quickly set up a new or pre-existing AMQ Streams deployment with a default OpenShift 4 monitoring stack.
Install AMQ Streams and Grafana
All users can use an existing monitoring stack in one of two ways: Create a new namespace and deploy AMQ Streams from scratch or use a pre-existing AMQ Streams instance and update the configuration namespaces where it operates.
Either way, the following example assumes you have cluster-wide AMQ Streams Operator in one namespace and Kafka clusters in different namespaces. We will not create a new namespace; instead, we'll use streams-cluster-operator for the AMQ Streams Operator and streams-Kafka-cluster for the Kafka cluster, and switch between them.
Note: See Hello World for AMQ Streams on OpenShift for a detailed guide to installing AMQ Streams from scratch. You can follow all the steps there or check the Red Hat AMQ Streams documentation, which describes the same steps.
Confirm your new AMQ Streams installation
Once you are done setting up your AMQ Streams installation, you should see the strimzi-cluster-operator pod up and running:
$ oc get pod -n streams-cluster-operator

strimzi-cluster-operator-7bff5b4d65-jmgqr    1/1     Running   0          12m
Deploy a Kafka cluster
Next, we'll deploy a Kafka cluster with the metrics configured. During the AMQ Streams installation, you downloaded examples with installed files for Operators, Kafka, and metrics. An example of a Kafka custom resource with metrics was stored under examples/metrics/Kafka-metrics.yaml. The Kafka metrics are now stored in a new config map, which is referenced in the Kafka custom resource. The metrics format hasn't changed. Anytime that you change the metrics configuration, you will also need to change the config map.
As an example, you can use the AMQ Streams default configuration and deploy everything by executing the following command:
$ oc apply -f examples/metrics/kafka-metrics.yaml -n streams-kafka-cluster
After a time, you should see the Kafka cluster up and running:
$ oc get pod -n streams-kafka-cluster

my-cluster-entity-operator-cf887b59-645zt    3/3     Running   0          6m
my-cluster-kafka-0                           1/1     Running   0          9m
my-cluster-kafka-1                           1/1     Running   0          9m
my-cluster-kafka-2                           1/1     Running   0          9m
my-cluster-kafka-exported-fsf343r            1/1     Running   0          5m
my-cluster-zookeeper-0                       1/1     Running   0          11m
my-cluster-zookeeper-1                       1/1     Running   0          11m
my-cluster-zookeeper-2                       1/1     Running   0          11m
You can change the name in the custom resource and deploy other clusters in different namespaces. As a result of the cluster-wide installation, the AMQ Streams Operator will serve all clusters deployed into an OpenShift cluster.
Install the Grafana Operator
In this section, we'll set up a Granfana instance. Grafana is by default installed in every OpenShift 4 instance. Unfortunately, the pre-installed Grafana instance is read-only, and you can only use predefined Grafana dashboards. As a result, we are forced to deploy our own Grafana instance into OpenShift.
Let’s start with a new namespace called streams-grafana. Then, we'll install Grafana from the OpenShift OperatorHub by creating proper operatorgroup and subscription. Here is the process to install the Grafana Operator:
- Make a new namespace:
$ oc create namespace streams-grafana
- Create an Operator group:
$ cat << EOF | oc apply -f -
apiVersion: operators.coreos.com/v1
kind: OperatorGroup
metadata:
  name: grafana-group
  namespace: streams-grafana
  labels:
    app: grafana
spec:
  targetNamespaces:
    - streams-grafana
EOF
- Create a subscription for the Grafana Operator:
$ cat << EOF | oc apply -f -
apiVersion: operators.coreos.com/v1alpha1
kind: Subscription
metadata:
  name: grafana-operator
  namespace:  streams-grafana
spec:
  channel: alpha
  installPlanApproval: Automatic
  name: grafana-operator
  source: community-operators
  sourceNamespace: openshift-marketplace
  startingCSV: grafana-operator.v3.9.0
EOF
- Confirm the Grafana Operator is installed successfully:
$ oc get pods -n streams-grafana

NAME                               READY   STATUS    RESTARTS   AGE
grafana-operator-957c6dcd9-wrljw   1/1     Running   0          65s
Connect the AMQ Streams Operator and Kafka clusters to your monitoring stack
During the OpenShift installation, the default OpenShift 4 monitoring stack is deployed in the openshift-monitoring namespace. With additional configuration, you can re-use it for monitoring your application.
First, you need to allow user-workloads in your OpenShift cluster. You could achieve this by creating a new config map to the openshift-monitoring namespace. Here is the config map for our example:
$ cat << EOF | oc apply -f -
apiVersion: v1
kind: ConfigMap
metadata:
  name: cluster-monitoring-config
  namespace: openshift-monitoring
data:
  config.yaml: |
    enableUserWorkload: true
EOF
After applying the config map, you should see new pods in the openshift-user-workload-monitoring namespace:
$ oc get po -n openshift-user-workload-monitoring

NAME                                   READY   STATUS    RESTARTS   AGE
prometheus-operator-868cd68496-jl44r   2/2     Running   0          118s
prometheus-user-workload-0             5/5     Running   1          112s
prometheus-user-workload-1             5/5     Running   1          112s
thanos-ruler-user-workload-0           3/3     Running   0          111s
thanos-ruler-user-workload-1           3/3     Running   0          111s
Second, you have to deploy pod monitors for all AMQ Streams components. You can find the pod monitors YAML in examples/metrics/prometheus-install/strimzi-pod-monitor.yaml. You need to create a pod monitor for each namespace and component you use. In general, you need to have a pod monitor for Kafka in the kafka namespace, one for for cluster-operator in the cluster-operator namespace, and so on:
$ cat examples/metrics/prometheus-install/strimzi-pod-monitor.yaml | sed "s#myproject#streams-kafka-cluster#g" | oc apply -n streams-kafka-cluster -f -
$ cat examples/metrics/prometheus-install/strimzi-pod-monitor.yaml | sed "s#myproject#streams-cluster-operator#g" | oc apply -n streams-cluster-operator -f -
Note that you can remove unused pod monitors, such as KafkaBridge.
Check Prometheus for Strimzi or Kafka queries
Finally, in the OpenShift administrator console, navigate to the Monitoring tab and open Metrics. Try a few Strimzi or Kafka-related queries. Figure 1 shows a query for strimzi_resources.

Connect a Granfana instance to OpenShift 4 Prometheus
Now, we are ready to create a Grafana instance. Because the Grafana Operator is up and running, we just need to deploy the Grafana instance using the following commands:
$ cat << EOF | oc apply -f -
apiVersion: integreatly.org/v1alpha1
kind: Grafana
metadata:
  name: grafana
  namespace: streams-grafana
spec:
  ingress:
    enabled: True
  config:
    log:
      mode: "console"
      level: "warn"
    security:
      admin_user: "admin"
      admin_password: "admin"
    auth:
      disable_login_form: False
      disable_signout_menu: True
    auth.anonymous:
      enabled: True
  dashboardLabelSelector:
    - matchExpressions:
        - { key: app, operator: In, values: [strimzi] }
  resources:
    limits:
      cpu: 2000m
      memory: 8000Mi
    requests:
      cpu: 100m
      memory: 200Mi
EOF
With the Grafana instance running, we need to create a data source from Prometheus. Before we can do that, we need to create a ServiceAccount and ClusterRoleBinding for Grafana. Here is the ServiceAccount:
$ cat << EOF | oc apply -f -
apiVersion: v1
kind: ServiceAccount
metadata:
  name: grafana-serviceaccount
  labels:
    app: strimzi
    namespace: streams-grafana
EOF
And here is the ClusterRoleBinding:
$ cat << EOF | oc apply -f -
apiVersion: rbac.authorization.k8s.io/v1
kind: ClusterRoleBinding
metadata:
  name: grafana-cluster-monitoring-binding
  labels:
    app: strimzi
subjects:
  - kind: ServiceAccount
    name: grafana-serviceaccount
    namespace: streams-grafana
roleRef:
  kind: ClusterRole
  name: cluster-monitoring-view
  apiGroup: rbac.authorization.k8s.io
EOF
Now, we can get a token to grant access for Grafana into Prometheus:
$ export TOKEN=$(oc serviceaccounts get-token grafana-serviceaccount -n streams-grafana)
When you have the token, run the following command to create a data source and pass the token to it:
$ cat << EOF | oc apply -f -
apiVersion: integreatly.org/v1alpha1
kind: GrafanaDataSource
metadata:
  name: grafanadatasource
  namespace: streams-grafana
spec:
  name: middleware.yaml
  datasources:
    - name: Prometheus
      type: prometheus
      access: proxy
      url: https://thanos-querier.openshift-monitoring.svc.cluster.local:9091
      basicAuth: false
      basicAuthUser: internal
      isDefault: true
      version: 1
      editable: true
      jsonData:
        tlsSkipVerify: true
        timeInterval: "5s"
        httpHeaderName1: "Authorization"
      secureJsonData:
        httpHeaderValue1: "Bearer $TOKEN"
EOF
Set up your AMQ Streams dashboard in the Grafana instance
Example dashboards for AMQ Streams are available in the examples/metrics/grafana-dashboards folder. There are two ways to include a dashboard in a Grafana instance. One option is to use the Grafana user interface (UI) and navigate to the Dashboards page. You can include available dashboards and select a proper data source. The second option is to create a GrafanaDashboard custom resource with the dashboard JSON inside it.
For this example, we'll take the second option. Below is a script that gets the JSON from the examples folder and makes a collection runner. Go to the Grafana dashboards that you want to use and replace the .spec.name of your JSON dashboard and the .metadata.name of your custom resource (CR) definition, as shown here:
$ cat << EOF > /tmp/dashboard.yaml
apiVersion: integreatly.org/v1alpha1
kind: GrafanaDashboard
metadata:
  labels:
    app: strimzi
    monitoring-key: middleware
  name: strimzi-operators
  namespace: streams-grafana
spec:
  name: strimzi-operators.json
  json: |
    PLACEHOLDER
EOF

$ DATA="$(jq 'del(.__inputs,.__requires)'  examples/metrics/grafana-dashboards/strimzi-operators.json)" yq eval ".spec.json = strenv(DATA)" /tmp/dashboard.yaml | sed -e '/DS_PROMETHEUS/d' | oc apply -f -
You can use the same commands for other dashboards, as well; just keep in mind that you have to change .spec.name and .metadata.name if you do that.
Finally, you can access the Grafana UI via the exported route:
$ oc get route grafana-route -n streams-grafana -o=jsonpath='{.spec.host}'
Once you are in the UI, you can see your imported dashboards. Figure 2 shows how the AMQ Streams example dashboards represent metrics from the installed Operators.
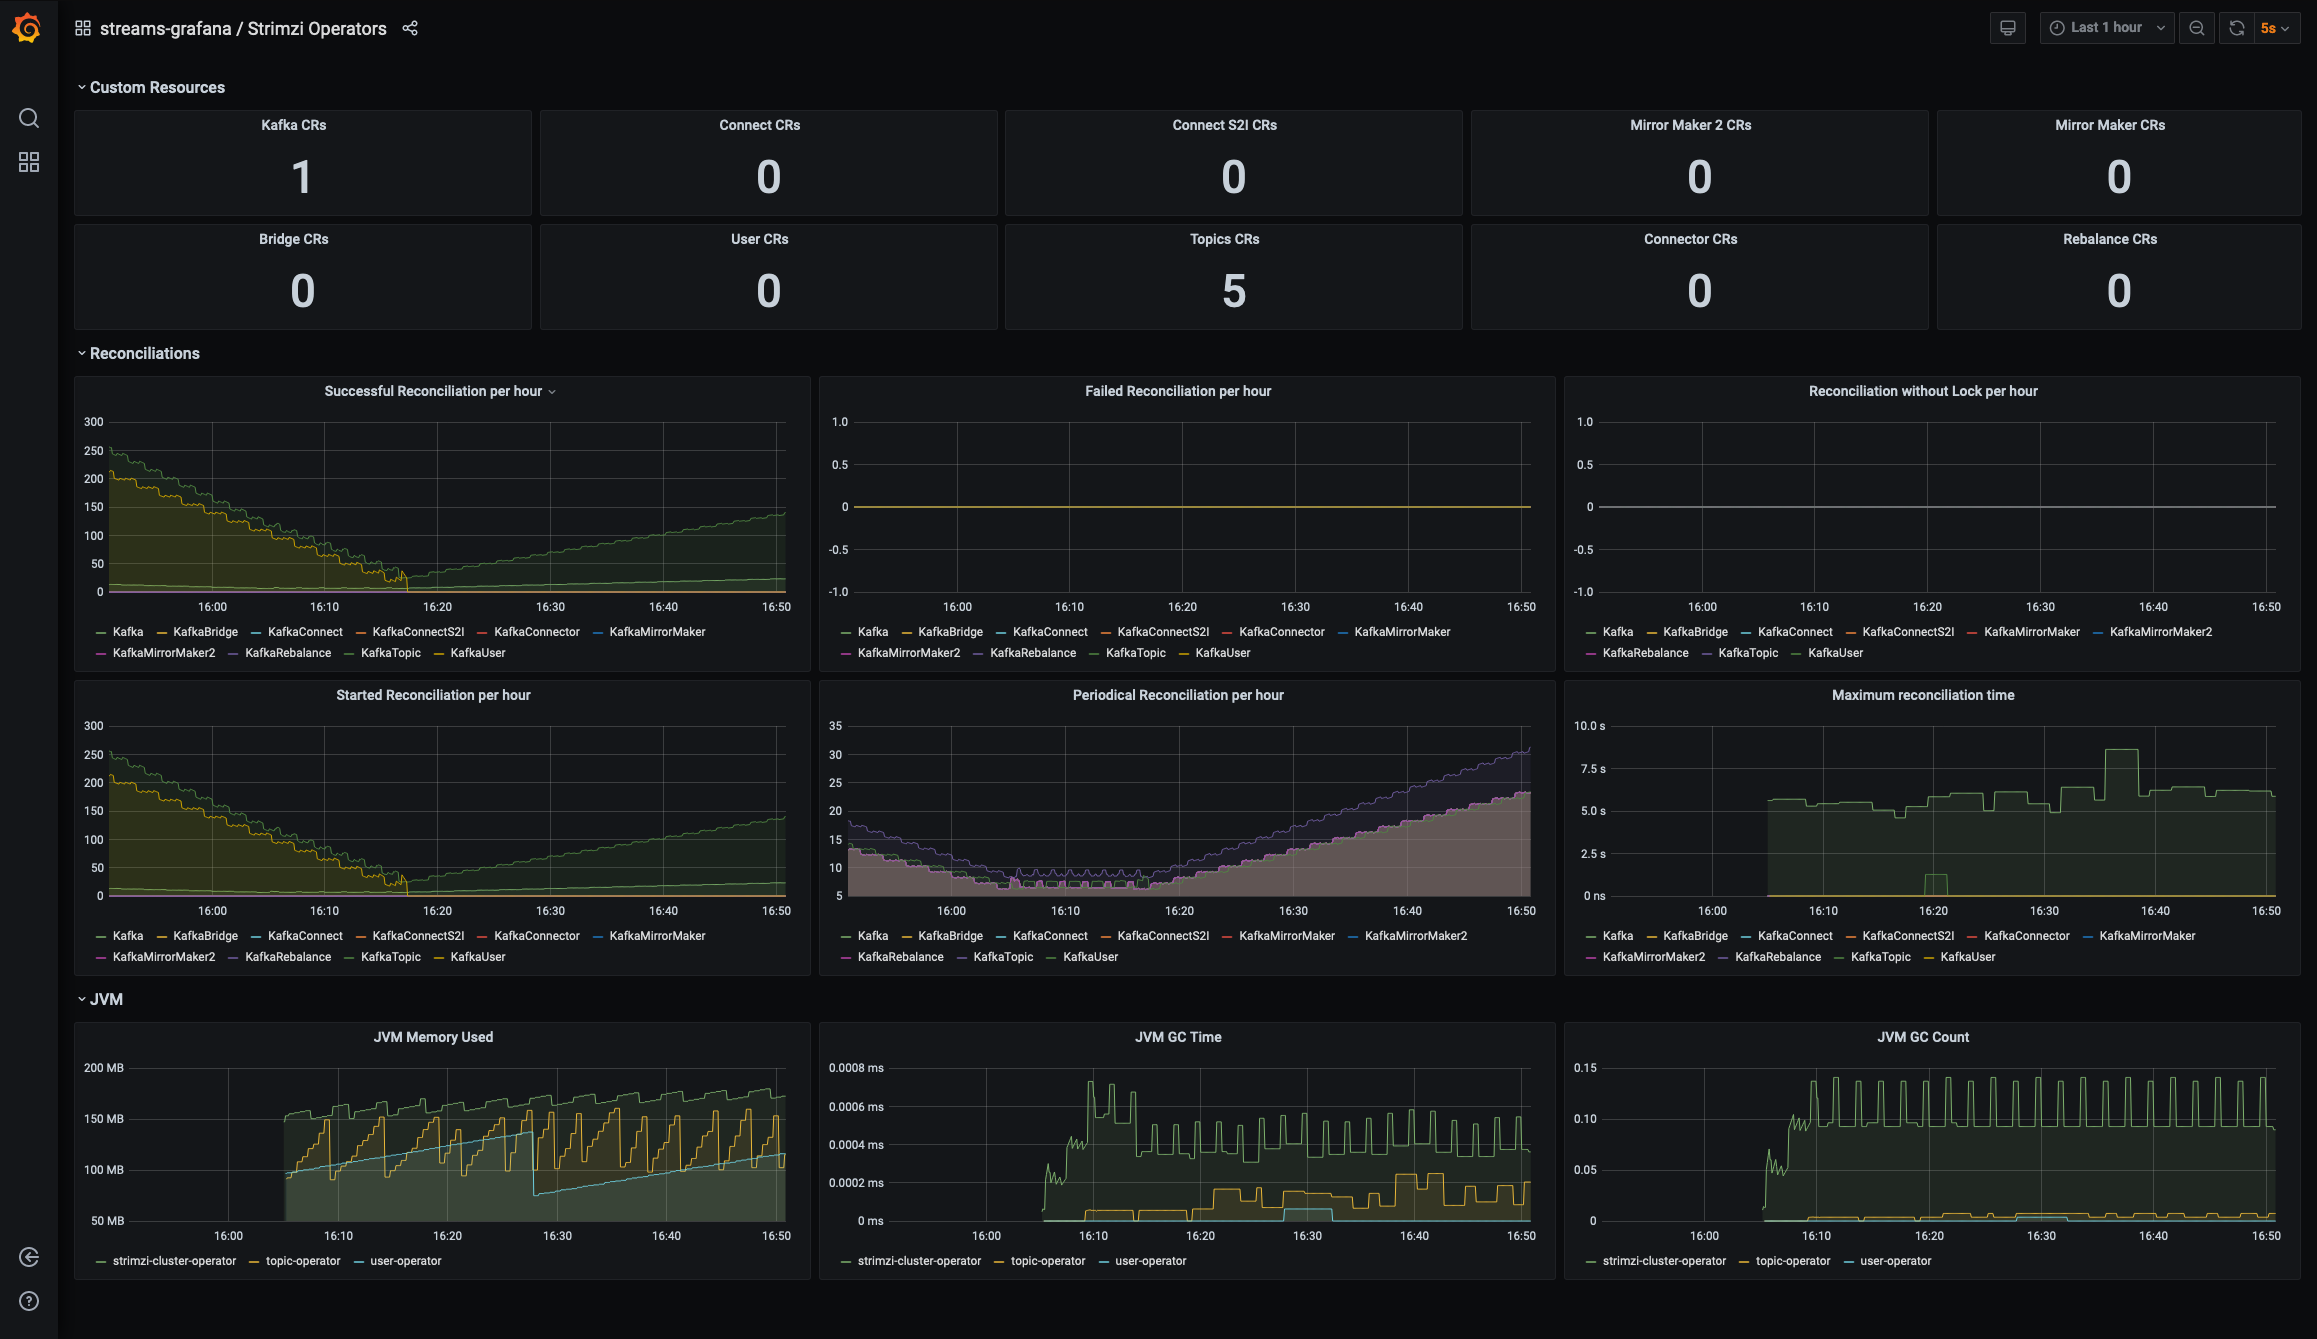
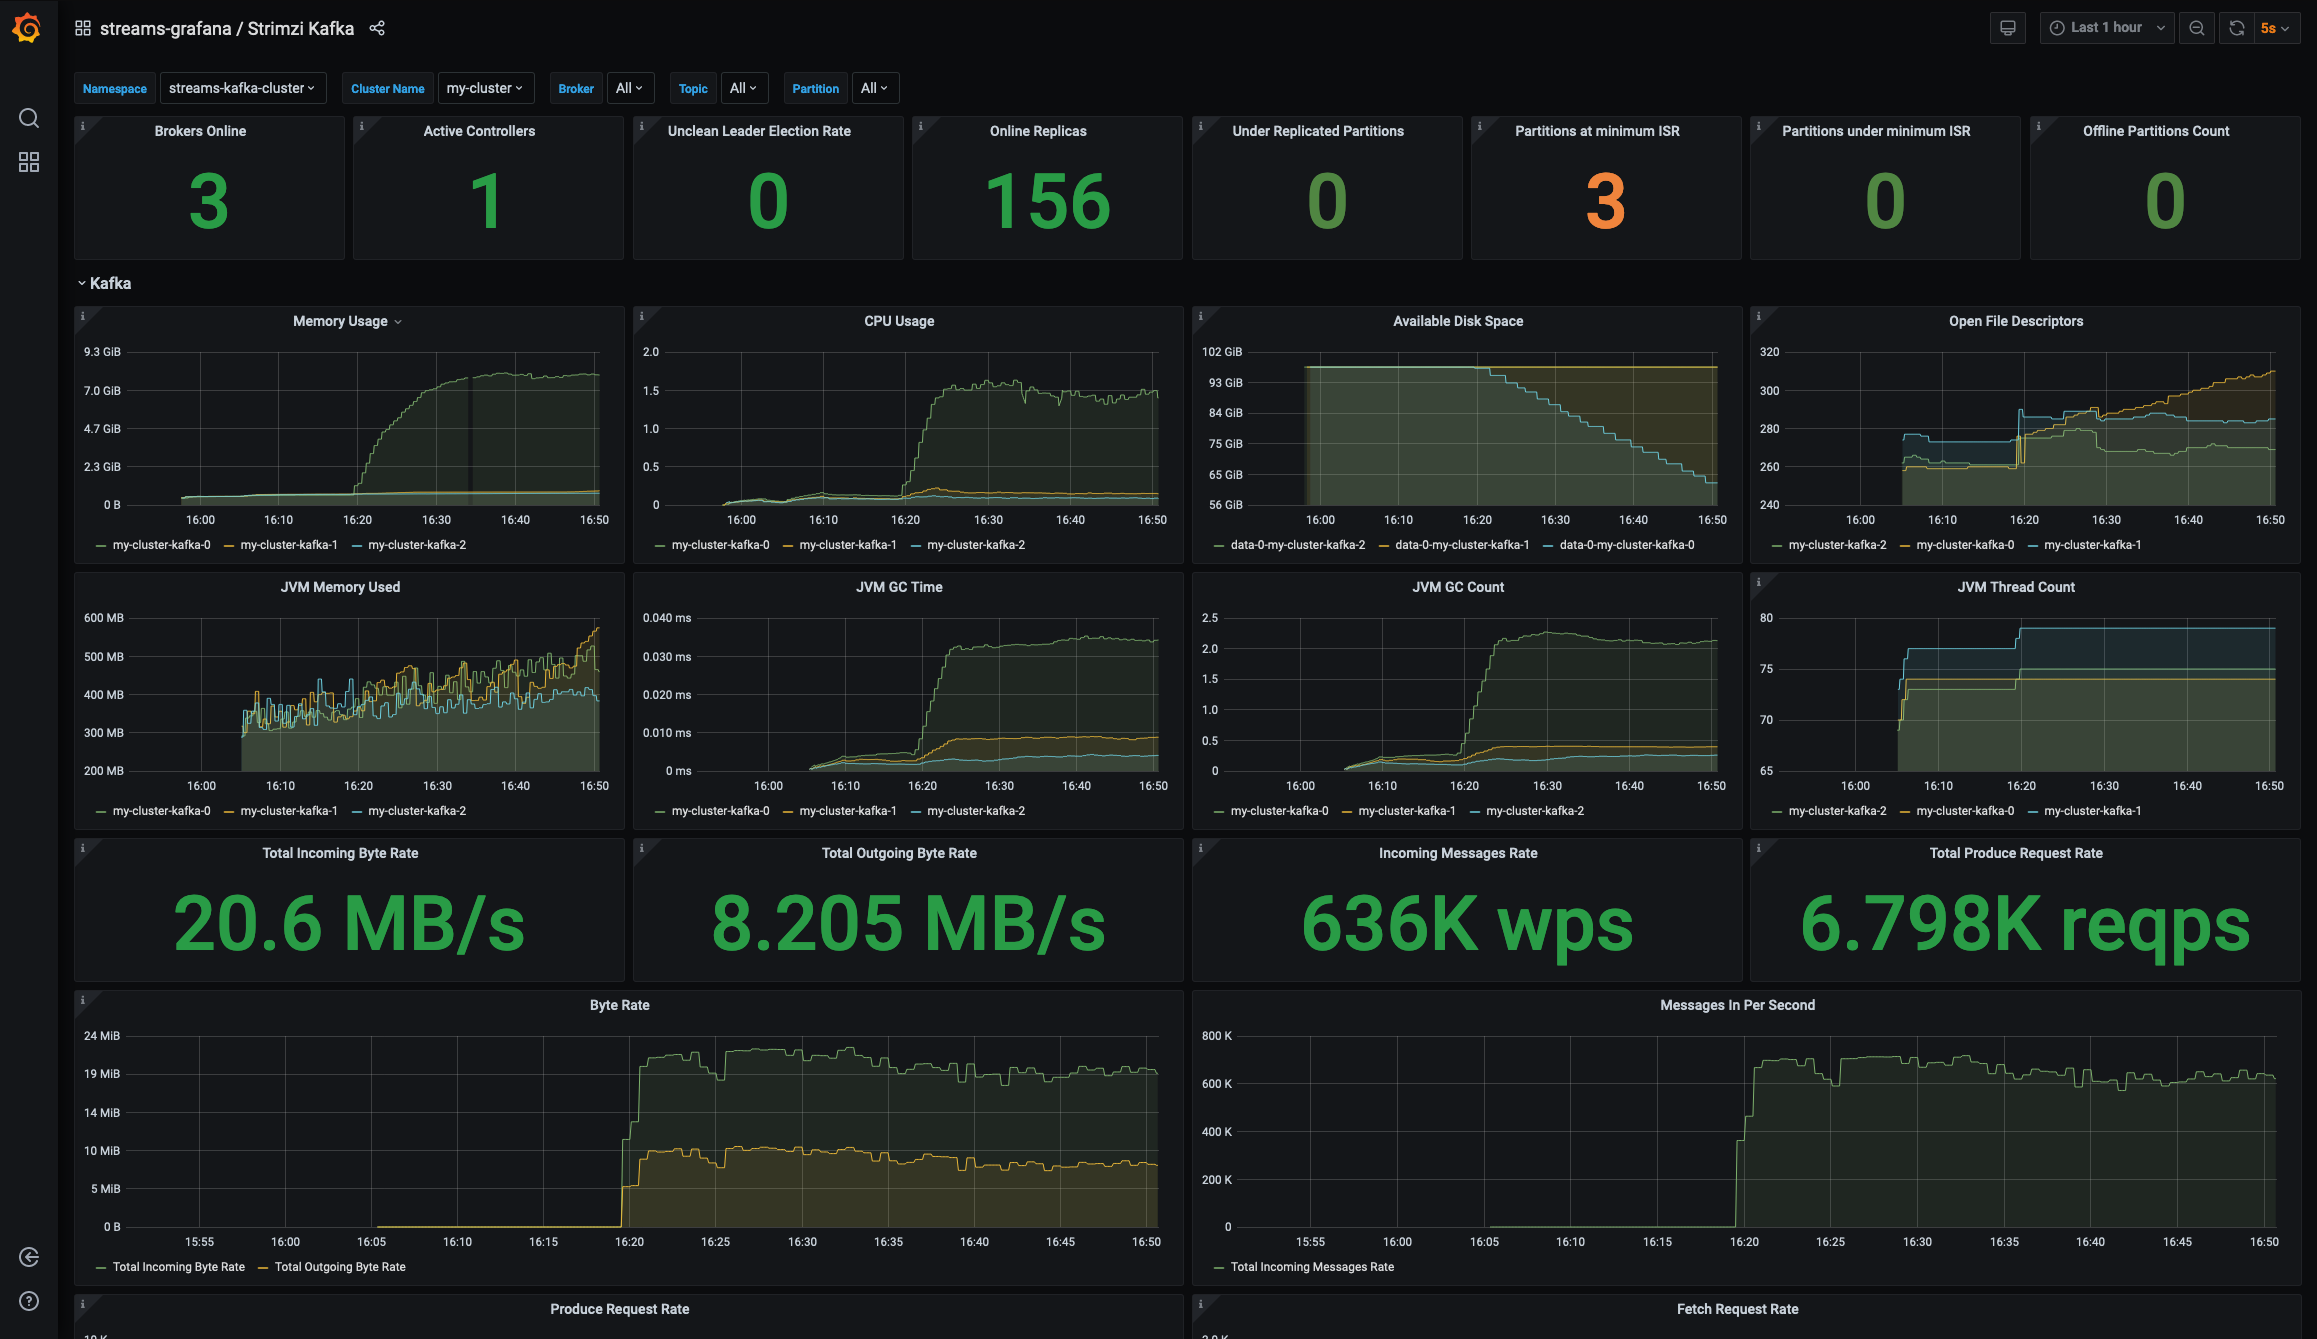
Figure 3 shows Kafka metrics inside the example dashboard.
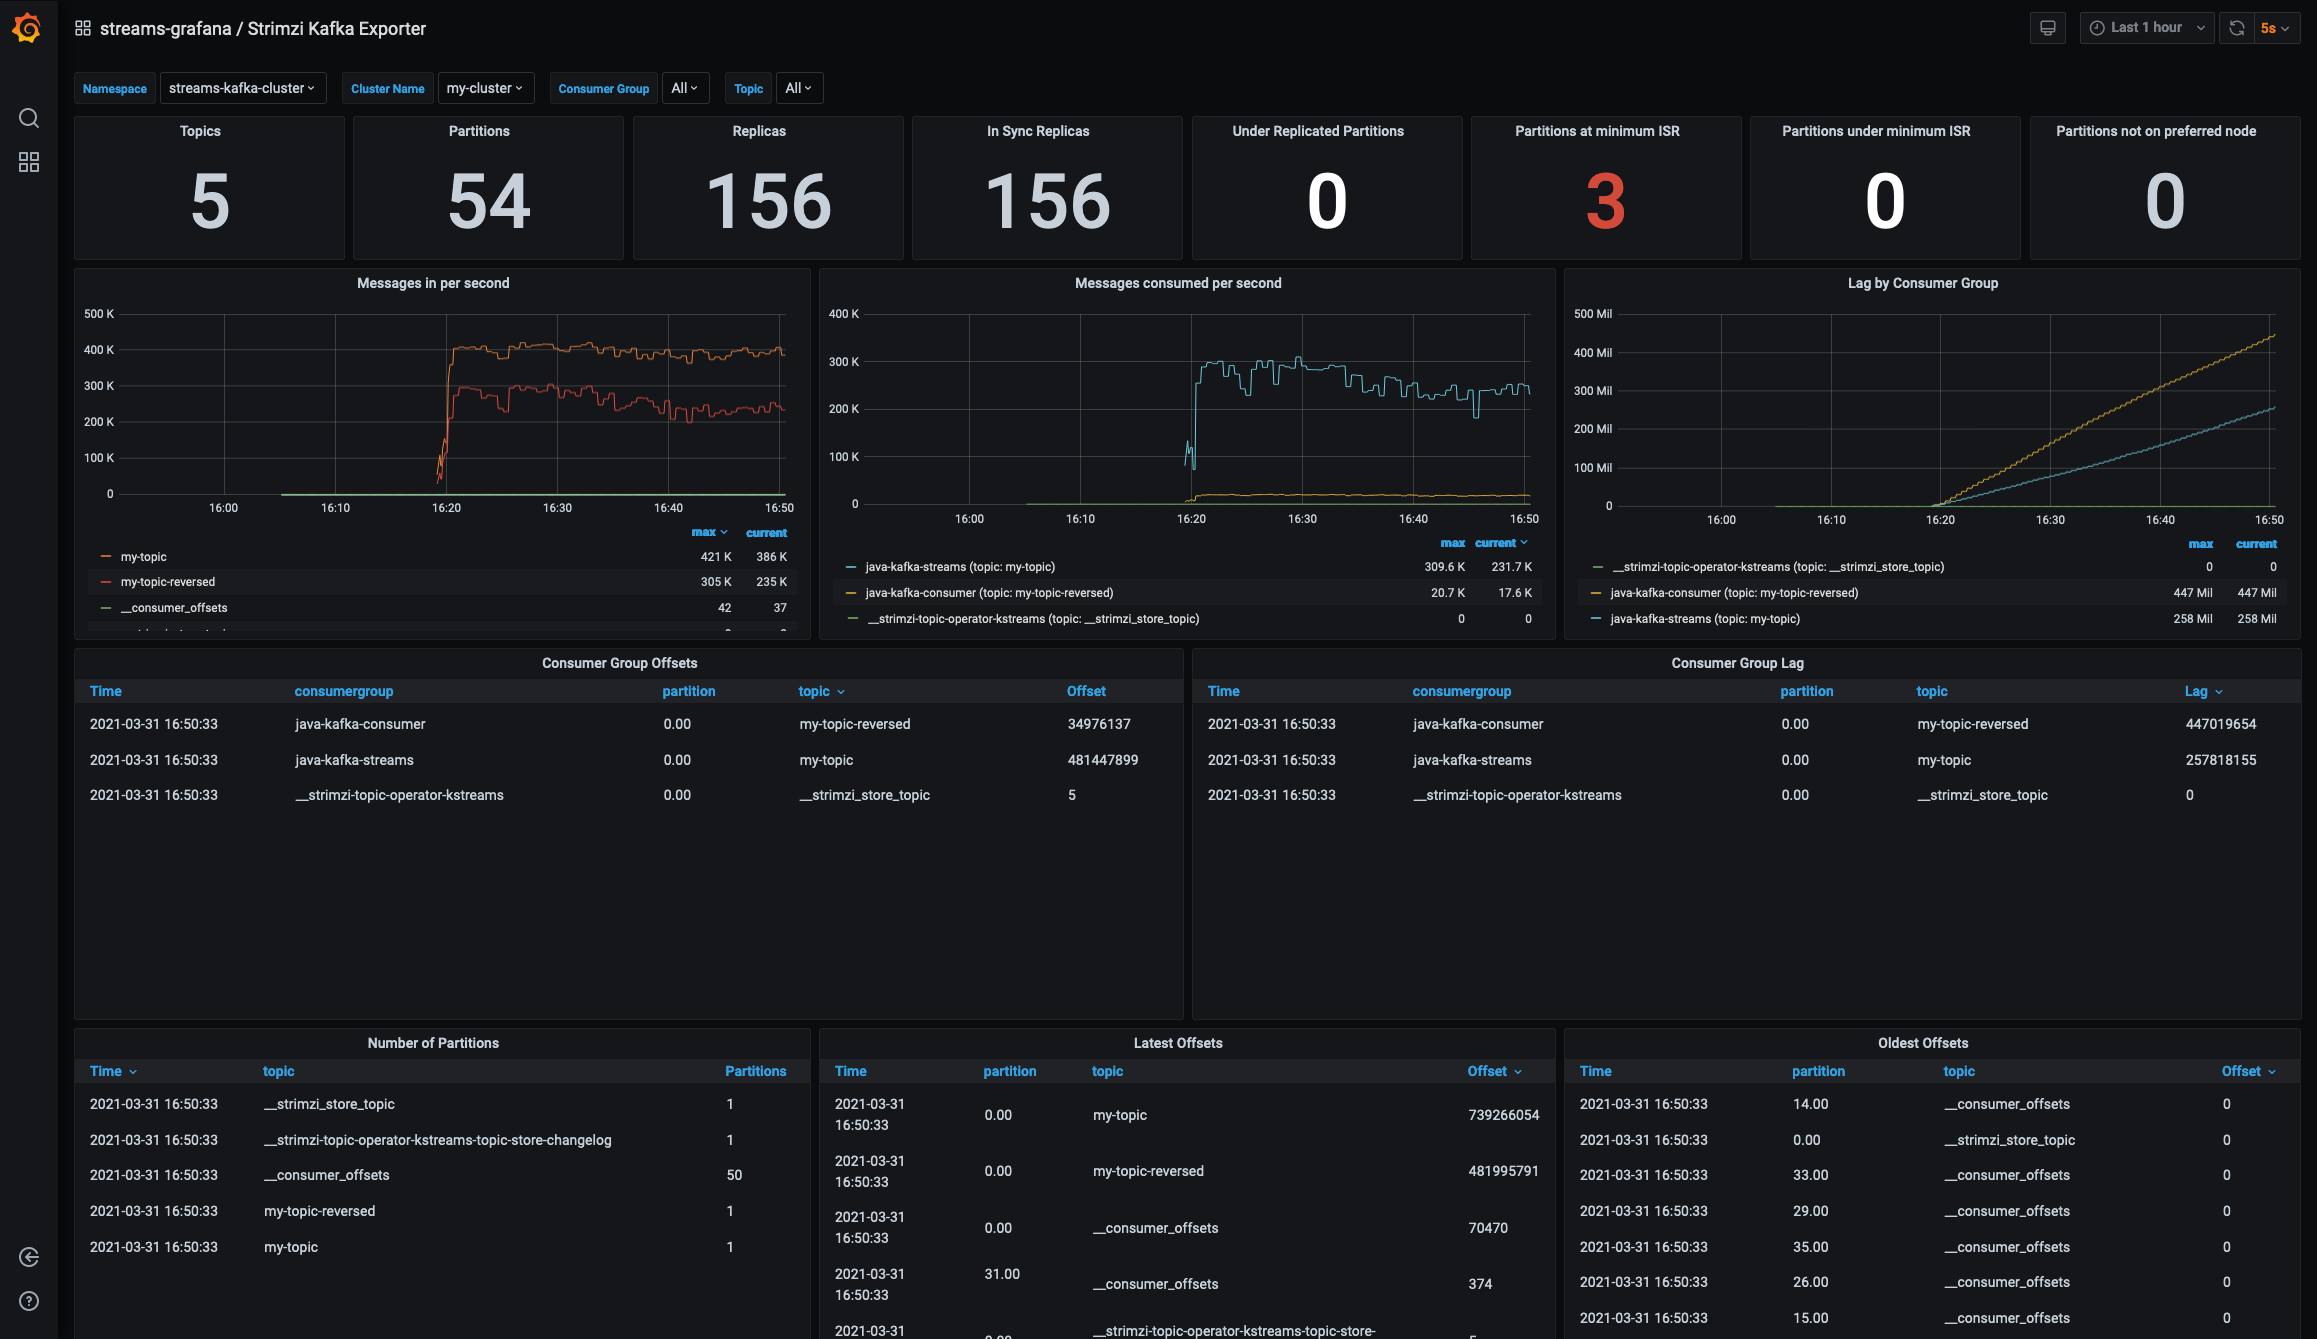
Finally, Figure 4 shows the Kafka Exporter dashboard. This dashboard shows various topics and the clients attached to them.
Set up your AMQ Streams dashboard in OpenShift 4
It is also possible to use OpenShift dashboards without installing Grafana. The OpenShift dashboards are limited compared to Grafana, but they're enough for a quick overview. You will find the OpenShift dashboards in the admin console under Monitoring. As an example, you could use the following commands to import a Strimzi dashboard:
$ cat << EOF > /tmp/file.yaml
kind: ConfigMap
apiVersion: v1
metadata:
  name: strimzi-operators-dashboard
  namespace: openshift-config-managed
labels:
  console.openshift.io/dashboard: 'true'
data:
  strimzi-operators: |-
    PLACEHOLDER
EOF

$ DATA="$(jq 'del(.__inputs,.__requires)'  strimzi-examples/examples/metrics/grafana-dashboards/strimzi-operators.json)" yq eval ".data.strimzi-operators = env(DATA)" /tmp/file.yaml | sed -e 's/DS_PROMETHEUS/d' | oc apply -f -
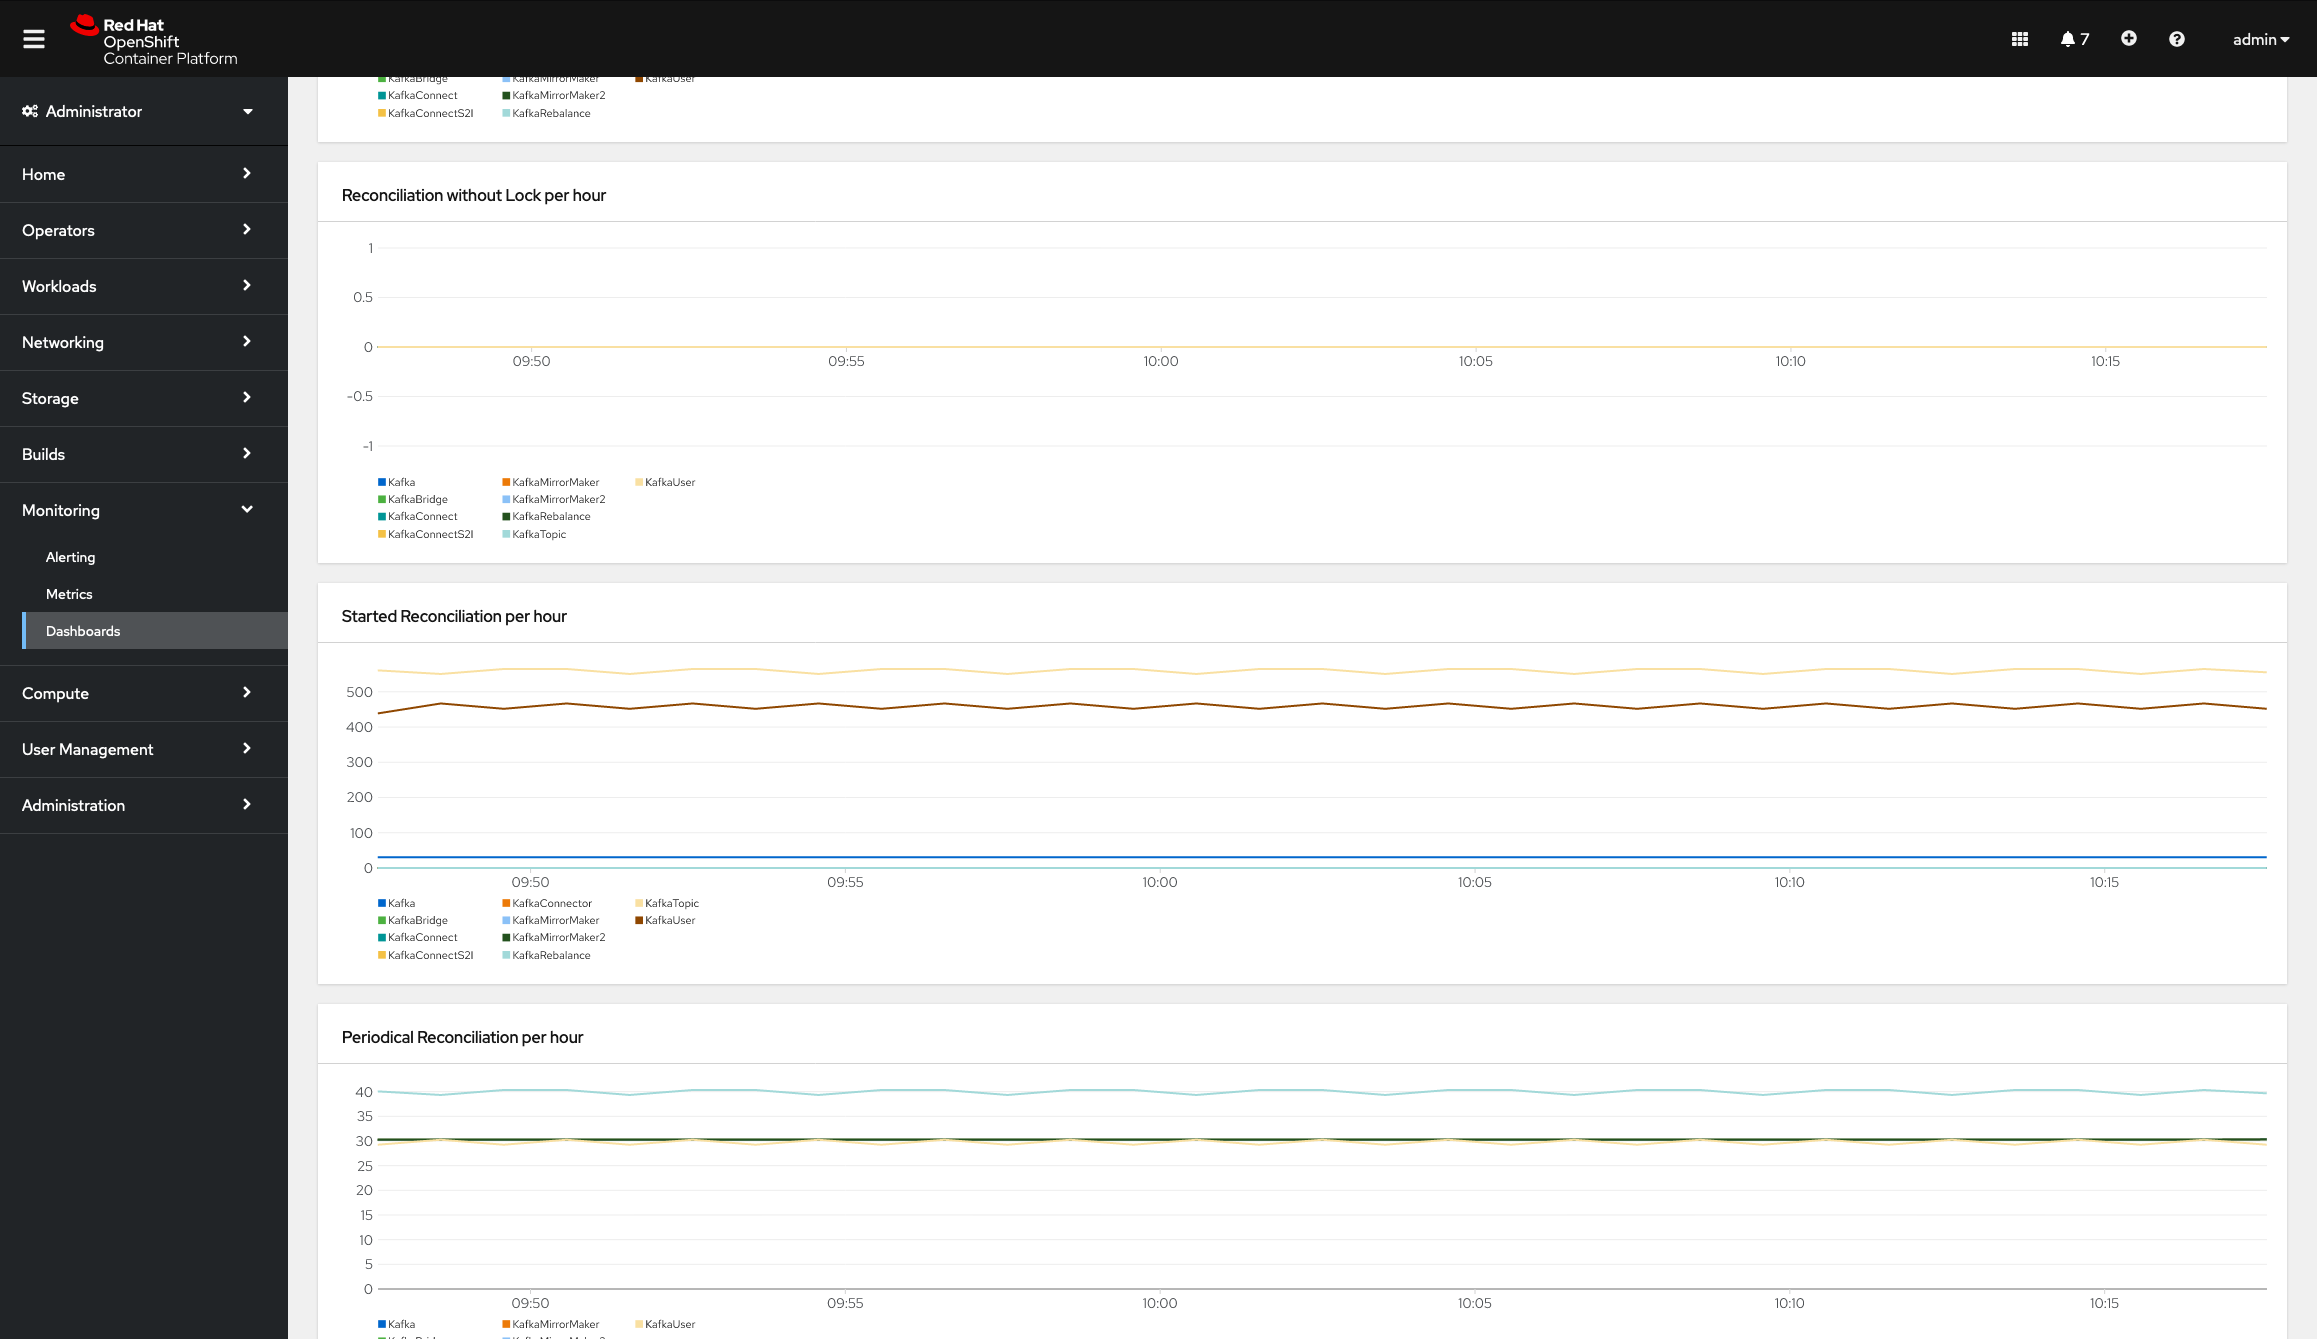
Now, you should be able to list the strimzi-operators dashboard in the OpenShift UI and see something similar to what's shown in Figure 5.
Conclusion
In this article, you've seen how to set up and use the OpenShift 4 monitoring stack to monitor AMQ Streams. You can monitor existing AMQ Streams clusters without needing to redeploy AMQ Streams, and you can also set up your own Grafana dashboard for more detailed metrics. Everything you need to apply proper custom resources is available from the oc client. If you want to avoid manual copying and pasting, you can use the yq command.