Metrics, traces, and logs might be the Three Pillars of Observability, as you've certainly already heard. This mantra helps us focus our mindset around observability, but it is not a religion. "There is so much more data that can help us have insight into our running systems," said Frederic Branczyk at KubeCon last year.
These three kind of signals do have their specificities, but they also have common denominators that we can generalize. They could all appear on a virtual timeline and they all originate from a workload, so they are timed and sourced, which is a good start for enabling correlation. If there's anything as important as knowing the signals that a system can emit, it's knowing the relationships between those signals and being able to correlate one with another, even when they're not strictly of the same nature. Ultimately, we can postulate that any sort of signal that is timed and sourced is a good candidate for correlation as well, even if we don’t have hard links between them.
This fact is, of course, not something new. Correlation has always been possible, but the true stake is to make it easier, and hence cheaper. What makes correlation easier today? I can see at least one pattern that helps, and that we see more and more in monitoring systems: An automatic and consistent sourcing of incoming signals.
When you use Prometheus in Kubernetes, the Kubernetes service discovery might be enabled and configured for label mapping. As the name suggests, this mechanism maps pods' existing labels to Prometheus labels, or in other words, it forwards source context into metrics (hence, allowing filters and aggregations based on that information). This setup participates in automatic and consistent sourcing. Loki, for instance, has the same for logs. If you can define a context for metrics search and reuse that same context for logs search, then guess what you have? Easier correlation.
But that's just a step, not the end of the journey.
New correlation feature in Kiali
In Kiali, our observability console for Istio, we recently started work regarding correlation. We still have a long way to go, but we're definitely involved. In a previous post, I described how Kiali can help with troubleshooting by navigating between screens (graph, logs, metrics, and traces) while always keeping an active context. We wanted to do more, such as visually correlating traces and metrics, so that when we're seeing an oddly behaving metric we can try to relate it with traces—or the other way around, analyze metrics behavior near high-latency traces.
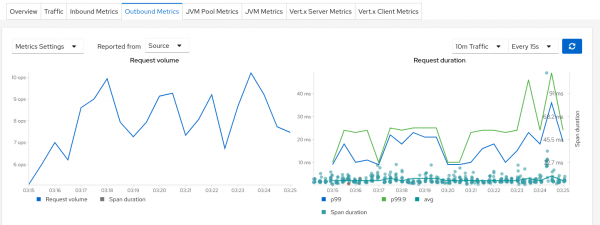
In order to do that, each metric chart in Kiali has now a Span duration legend item that, when clicked, shows the spans on that chart as you can see in Figure 1.

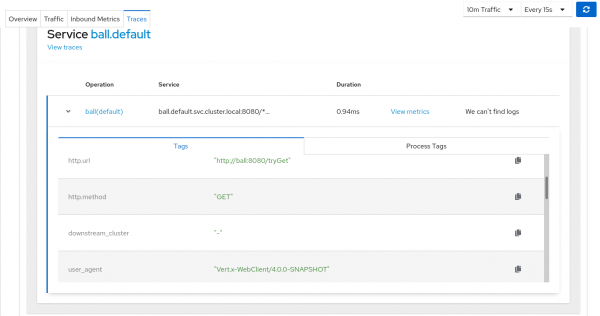
Why spans and not traces? This chart is a service-centric view. We only want to show what is strictly related to the service to better correlate with the displayed metrics, while a trace would encompass calls from other services as well. But be reassured, we can jump from a span to its trace as shown in Figure 2. Kiali now integrates its own traces view along with external links to the Jaeger UI.

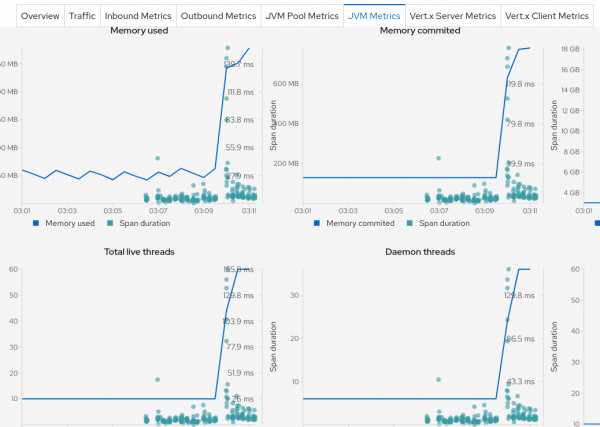
This setup is nice because we can now correlate, for instance, the Istio response time metric with actual traces and view all the metadata associated with a trace, which I’m sure will be a typical scenario in troubleshooting high latencies in Kiali. But it's not only about response time: Kiali can monitor non-Istio metrics as well, such as JVM memory. So, we could also correlate a memory increase with actual traces as shown in Figure 3 (or any other metric).

Potential pitfall
There’s a pitfall, though: The spans displayed are limited in number. When the volumetry is high, this limit is quickly reached. Sampling strategies can be configured with Jaeger to limit the amount of ingested traces, but the problem remains: We might miss relevant data. Troubleshooting high latencies often means looking at p99 latencies, or p99.9, or even max. The more we want to have a sharp look, the more we need to work from a complete dataset basis.
Today, Kiali tries to show the most relevant spans first, such as the ones with errors or high latency. This tactic is similar to what we can do with tail-based sampling, except Kiali does it at query time. This setup is also perfectible because it makes assumptions regarding what is relevant, and anyway, it will still reach a limit at some point.
There are several ideas around aggregation that we can consider tackling. Some tools apparently do this already, like shown here by Pinterest, and there are several possible approaches (keeping in mind that Kiali is an API-consuming tool that at the moment doesn’t come with persistent storage). Handling traces is still an open field in Kiali and people are welcome to contribute!
Correlation with exemplars
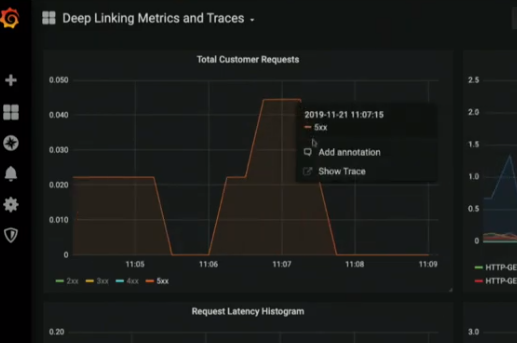
When it comes to correlating traces and metrics, there is another option that may come to mind: deep linking metrics and traces through exemplars (see the screenshot in Figure 4).

The details are being formalized in the OpenMetrics specifications. The idea is to enrich the metrics scraping endpoints with trace IDs associated with one or more metrics. That trace is an exemplar (just a single one, among potentially many others).
This ID will not be a Prometheus label to avoid impacting metric cardinality. The implementation in Prometheus is not finished yet. In Jaeger, we can imagine that the presence of exemplars would influence sampling decisions, but this issue is not relevant today. This is definitely a hot topic among Prometheus/Grafana/tracing communities. We are following it with interest for Kiali.
However, again, questions might be raised about the representativeness of a single exemplar among many traces. Correlation is not done just for the sake of correlation, but because it helps solve a real problem. Exemplar linking will help to spot some of them or figure out some business/technical processes involved while looking at metrics. But, there's more that we can do in the field of trace/span aggregation in order to better figure out the health of a system and to troubleshoot. (Not as opposed to exemplars, but as a complement in the debugger's toolset.)
So, what's next?
We will continue to work on correlations and traces, such as considering more signals and easing the troubleshooting path. And why not analytics as well? If you have any suggestions or comments, do not hesitate to get in touch. Remember that Kiali is an open source project and you're welcome to contribute with code, or ideas, or both.
Thanks to Simon Pasquier, Gary Brown, Alissa Bonas and Juca Paixão Kröhling for reviewing and sharing ideas.
Last updated: February 13, 2024