Redhat Developers  Logo
  • Products

    Featured

    • Red Hat Enterprise Linux
      Red Hat Enterprise Linux Icon
    • Red Hat OpenShift AI
      Red Hat OpenShift AI
    • Red Hat Enterprise Linux AI
      Linux icon inside of a brain
    • Image mode for Red Hat Enterprise Linux
      RHEL image mode
    • Red Hat OpenShift
      Openshift icon
    • Red Hat Ansible Automation Platform
      Ansible icon
    • Red Hat Developer Hub
      Developer Hub
    • View All Red Hat Products
    • Linux

      • Red Hat Enterprise Linux
      • Image mode for Red Hat Enterprise Linux
      • Red Hat Universal Base Images (UBI)
    • Java runtimes & frameworks

      • JBoss Enterprise Application Platform
      • Red Hat build of OpenJDK
    • Kubernetes

      • Red Hat OpenShift
      • Microsoft Azure Red Hat OpenShift
      • Red Hat OpenShift Virtualization
      • Red Hat OpenShift Lightspeed
    • Integration & App Connectivity

      • Red Hat Build of Apache Camel
      • Red Hat Service Interconnect
      • Red Hat Connectivity Link
    • AI/ML

      • Red Hat OpenShift AI
      • Red Hat Enterprise Linux AI
    • Automation

      • Red Hat Ansible Automation Platform
      • Red Hat Ansible Lightspeed
    • Developer tools

      • Red Hat Trusted Software Supply Chain
      • Podman Desktop
      • Red Hat OpenShift Dev Spaces
    • Developer Sandbox

      Developer Sandbox
      Try Red Hat products and technologies without setup or configuration fees for 30 days with this shared Openshift and Kubernetes cluster.
    • Try at no cost
  • Technologies

    Featured

    • AI/ML
      AI/ML Icon
    • Linux
      Linux Icon
    • Kubernetes
      Cloud icon
    • Automation
      Automation Icon showing arrows moving in a circle around a gear
    • View All Technologies
    • Programming Languages & Frameworks

      • Java
      • Python
      • JavaScript
    • System Design & Architecture

      • Red Hat architecture and design patterns
      • Microservices
      • Event-Driven Architecture
      • Databases
    • Developer Productivity

      • Developer productivity
      • Developer Tools
      • GitOps
    • Secure Development & Architectures

      • Security
      • Secure coding
    • Platform Engineering

      • DevOps
      • DevSecOps
      • Ansible automation for applications and services
    • Automated Data Processing

      • AI/ML
      • Data Science
      • Apache Kafka on Kubernetes
      • View All Technologies
    • Start exploring in the Developer Sandbox for free

      sandbox graphic
      Try Red Hat's products and technologies without setup or configuration.
    • Try at no cost
  • Learn

    Featured

    • Kubernetes & Cloud Native
      Openshift icon
    • Linux
      Rhel icon
    • Automation
      Ansible cloud icon
    • Java
      Java icon
    • AI/ML
      AI/ML Icon
    • View All Learning Resources

    E-Books

    • GitOps Cookbook
    • Podman in Action
    • Kubernetes Operators
    • The Path to GitOps
    • View All E-books

    Cheat Sheets

    • Linux Commands
    • Bash Commands
    • Git
    • systemd Commands
    • View All Cheat Sheets

    Documentation

    • API Catalog
    • Product Documentation
    • Legacy Documentation
    • Red Hat Learning

      Learning image
      Boost your technical skills to expert-level with the help of interactive lessons offered by various Red Hat Learning programs.
    • Explore Red Hat Learning
  • Developer Sandbox

    Developer Sandbox

    • Access Red Hat’s products and technologies without setup or configuration, and start developing quicker than ever before with our new, no-cost sandbox environments.
    • Explore Developer Sandbox

    Featured Developer Sandbox activities

    • Get started with your Developer Sandbox
    • OpenShift virtualization and application modernization using the Developer Sandbox
    • Explore all Developer Sandbox activities

    Ready to start developing apps?

    • Try at no cost
  • Blog
  • Events
  • Videos

Understanding Red Hat AMQ Streams components for OpenShift and Kubernetes: Part 3


December 6, 2019
Pramod Padmanabhan Faisal Masood
Related topics:
Kubernetes
Related products:
Streams for Apache KafkaRed Hat OpenShift Container Platform

Share:

    In the previous articles in this series, we first covered the basics of Red Hat AMQ Streams on OpenShift and then showed how to set up Kafka Connect, a Kafka Bridge, and Kafka Mirror Maker. Here are a few key points to keep in mind before we proceed:

    • AMQ Streams is based on Apache Kafka.
    • AMQ Streams for the Red Hat OpenShift Container Platform is based on the Strimzi project.
    • AMQ Streams on containers has multiple components, such as the Cluster Operator, Entity Operator, Mirror Maker, Kafka connect, and Kafka Bridge.

    Now that we have everything set up (or so we think), let's look at monitoring and alerting for our new environment.

    Kafka Exporter

    A Kafka cluster, by default, does not export all of its metrics. Hence, we need to use Kafka Exporter to collect the cluster's broker state, usage, and performance. It is important to have more insight so you can understand if the consumer's message consumption is at the same rate as the producer's message pushes. If not, this slow consumption behavior could cost the system. Catching these issues as early as possible is recommended.

    To set up Kafka Exporter, begin by editing the existing Kafka cluster config, or creating a new one to include the Kafka Exporter. For example:

    apiVersion: kafka.strimzi.io/v1beta1
    kind: Kafka
    metadata:
      name: simple-cluster
    spec:
      kafka:
        version: 2.3.0
        replicas: 5
        listeners:
          plain: {}
          tls: {}
        config:
          offsets.topic.replication.factor: 5
          transaction.state.log.replication.factor: 5
          transaction.state.log.min.isr: 2
          log.message.format.version: "2.3"
        storage:
          type: jbod
          volumes:
          - id: 0
            type: persistent-claim
            size: 5Gi
            deleteClaim: false
      zookeeper:
        replicas: 3
        storage:
          type: persistent-claim
          size: 5Gi
          deleteClaim: false 
      entityOperator:
        topicOperator: {}
        userOperator: {}
      kafkaExporter: {}
    

    Next, apply the new changes to the existing cluster:

    $ oc apply -f amq-kafka-cluster-kafka-exporter.yml

    You can see the result in Figure 1:

    Kafka Exporter is deployed.
    Figure 1: Your new Kafka Exporter instance.

    Prometheus and Grafana

    Prometheus is a system monitoring and alerting toolkit that scrapes metrics from the Kafka cluster. The downside of this tool is that it does not have a good GUI. Hence, we create operational dashboards using Grafana for the interface and Prometheus for the data feeds.

    Let's get started with the metrics and creating the dashboard:

    1. Add Kafka metrics to the Kafka resource. This snippet was referenced from the examples/metrics/kafka-metrics.yaml file provided as part of the Red Hat AMQ Streams product:
    $ oc project amq-streams
    $ oc edit kafka simple-cluster
    
    # Add the below in the spec->kafka
    
        metrics:
          # Inspired by config from Kafka 2.0.0 example rules:
          # https://github.com/prometheus/jmx_exporter/blob/master/example_configs/kafka-2_0_0.yml
          lowercaseOutputName: true
          rules:
          # Special cases and very specific rules
          - pattern : kafka.server<type=(.+), name=(.+), clientId=(.+), topic=(.+), partition=(.*)><>Value
            name: kafka_server_$1_$2
            type: GAUGE
            labels:
              clientId: "$3"
              topic: "$4"
              partition: "$5"
          - pattern : kafka.server<type=(.+), name=(.+), clientId=(.+), brokerHost=(.+), brokerPort=(.+)><>Value
            name: kafka_server_$1_$2
            type: GAUGE
            labels:
              clientId: "$3"
              broker: "$4:$5"
          # Some percent metrics use MeanRate attribute
          # Ex) kafka.server<type=(KafkaRequestHandlerPool), name=(RequestHandlerAvgIdlePercent)><>MeanRate
          - pattern: kafka.(\w+)<type=(.+), name=(.+)Percent\w*><>MeanRate
            name: kafka_$1_$2_$3_percent
            type: GAUGE
          # Generic gauges for percents
          - pattern: kafka.(\w+)<type=(.+), name=(.+)Percent\w*><>Value
            name: kafka_$1_$2_$3_percent
            type: GAUGE
          - pattern: kafka.(\w+)<type=(.+), name=(.+)Percent\w*, (.+)=(.+)><>Value
            name: kafka_$1_$2_$3_percent
            type: GAUGE
            labels:
              "$4": "$5"
          # Generic per-second counters with 0-2 key/value pairs
          - pattern: kafka.(\w+)<type=(.+), name=(.+)PerSec\w*, (.+)=(.+), (.+)=(.+)><>Count
            name: kafka_$1_$2_$3_total
            type: COUNTER
            labels:
              "$4": "$5"
              "$6": "$7"
          - pattern: kafka.(\w+)<type=(.+), name=(.+)PerSec\w*, (.+)=(.+)><>Count
            name: kafka_$1_$2_$3_total
            type: COUNTER
            labels:
              "$4": "$5"
          - pattern: kafka.(\w+)<type=(.+), name=(.+)PerSec\w*><>Count
            name: kafka_$1_$2_$3_total
            type: COUNTER
          # Generic gauges with 0-2 key/value pairs
          - pattern: kafka.(\w+)<type=(.+), name=(.+), (.+)=(.+), (.+)=(.+)><>Value
            name: kafka_$1_$2_$3
            type: GAUGE
            labels:
              "$4": "$5"
              "$6": "$7"
          - pattern: kafka.(\w+)<type=(.+), name=(.+), (.+)=(.+)><>Value
            name: kafka_$1_$2_$3
            type: GAUGE
            labels:
              "$4": "$5"
          - pattern: kafka.(\w+)<type=(.+), name=(.+)><>Value
            name: kafka_$1_$2_$3
            type: GAUGE
          # Emulate Prometheus 'Summary' metrics for the exported 'Histogram's.
          # Note that these are missing the '_sum' metric!
          - pattern: kafka.(\w+)<type=(.+), name=(.+), (.+)=(.+), (.+)=(.+)><>Count
            name: kafka_$1_$2_$3_count
            type: COUNTER
            labels:
              "$4": "$5"
              "$6": "$7"
          - pattern: kafka.(\w+)<type=(.+), name=(.+), (.+)=(.*), (.+)=(.+)><>(\d+)thPercentile
            name: kafka_$1_$2_$3
            type: GAUGE
            labels:
              "$4": "$5"
              "$6": "$7"
              quantile: "0.$8"
          - pattern: kafka.(\w+)<type=(.+), name=(.+), (.+)=(.+)><>Count
            name: kafka_$1_$2_$3_count
            type: COUNTER
            labels:
              "$4": "$5"
          - pattern: kafka.(\w+)<type=(.+), name=(.+), (.+)=(.*)><>(\d+)thPercentile
            name: kafka_$1_$2_$3
            type: GAUGE
            labels:
              "$4": "$5"
              quantile: "0.$6"
          - pattern: kafka.(\w+)<type=(.+), name=(.+)><>Count
            name: kafka_$1_$2_$3_count
            type: COUNTER
          - pattern: kafka.(\w+)<type=(.+), name=(.+)><>(\d+)thPercentile
            name: kafka_$1_$2_$3
            type: GAUGE
            labels:
              quantile: "0.$4"
    

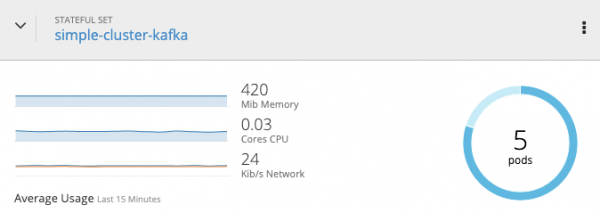
    This process will restart the simple-cluster-kafka pods one by one, as shown in Figure 2:
    Restarting the pods.
    Figure 2: Restarting the pods.
    1. Confirm you have Prometheus running in the cluster:
    $ oc get pod -n openshift-monitoring | grep prometheus
    prometheus-k8s-0                               4/4       Running   140        3d
    prometheus-k8s-1                               4/4       Running   140        3d
    prometheus-operator-687784bd4b-56vsk           1/1       Running   127        3d

    In case the above does not return any Prometheus pods, check with your infrastructure team to know where they are installed. If they are not installed, then check the Prometheus installation steps from the docs.

    1. Install Grafana:
    $ oc create -f https://raw.githubusercontent.com/strimzi/strimzi-kafka-operator/master/metrics/examples/grafana/grafana.yaml

    You can see the results in Figure 3:

    Graphana is deployed.
    Figure 3: Grafana is now deployed.
    1. Create a route for the Grafana service:
    $ oc expose svc grafana --name=grafana-route
    1. Log into the admin console (shown in Figure 4):
    $ oc get route | grep grafana
    grafana-route grafana-route-amq-streams.apps.redhat.demo.com grafana

    The Grafana admin window.
    Figure 4: The Grafana admin window.

    Note: The default credentials are admin and admin.

    When you log in for the first time, Grafana will ask you to change the password.

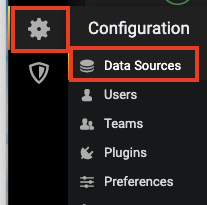
    1. Add Prometheus as a data source. Go to the settings icon and select Data Sources, and then Prometheus, as shown in Figure 5:
    Graphana settings.
    Figure 5: The Graphana settings menu.
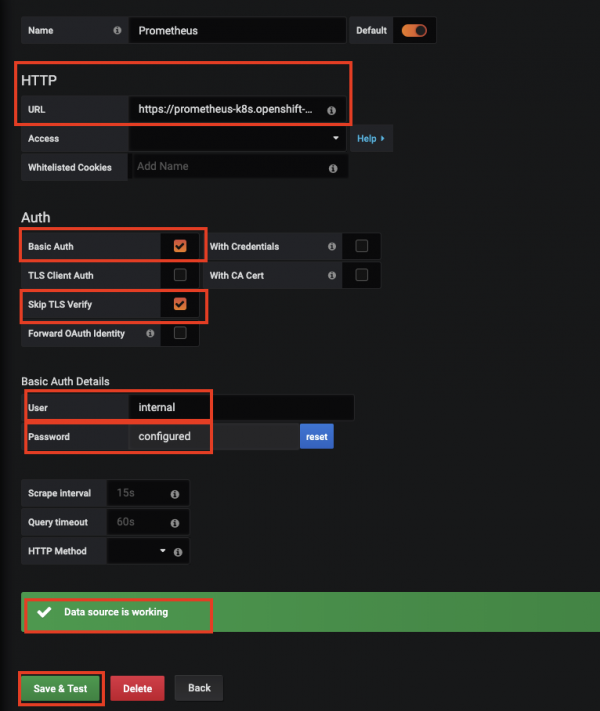
    1. Enter the Prometheus details and save them:
    • URL: https://prometheus-k8s.openshift-monitoring.svc:9091
    • Basic Auth: Enabled
    • Skip TLS Verify: Enabled
    • User: Internal
    • Pass: Get these details from the cluster admin.

    The message "Data source is working" should appear at the bottom before you continue, as shown in Figure 6:
    Configuring Graphana.
    Figure 6: Ready to proceed with the new configuration.
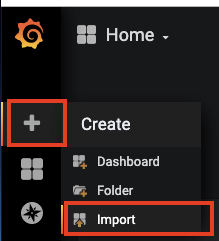
    1. Open the Import options by selecting + and then Import, as shown in Figure 7:
    Open the import menu to import a sample dashboard.
    Figure 7: Select + and then Import to access the Import options dialog box.
    1. Click Upload .json file to add the strimzi-kafka.jsonfile from examples/metrics/grafana-dashboards/strimzi-kafka.json.
    2. Select Prometheus as a data source and then click Import:
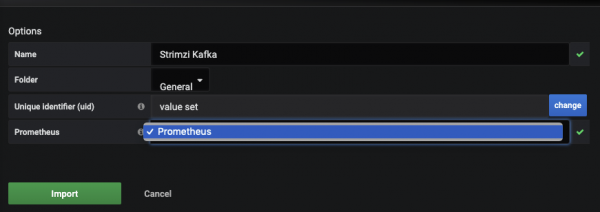
    Importing the sample dashboard.
    Figure 8: Importing the sample dashboard.

    Doing this should result in the sample Grafana dashboard.

    Conclusion

    In this article, we explored tools that can help us monitor Red Hat AMQ Streams. This piece fully rounds out our series, where we covered:

    1. Zookeeper, Kafka, and Entity Operator creation.
    2. Kafka Connect, Kafka Bridge, and Mirror Maker.
    3. Monitoring and admin (this article).

    Hopefully, you now have a better understanding of how to run AMQ Streams in a container ecosystem. Work through our examples and see the results for yourself.

    References

    • Kafka Connect documentation
    • Using AMQ Streams on OpenShift
    • Improving Prometheus metrics
    Last updated: March 29, 2023

    Recent Posts

    • GuideLLM: Evaluate LLM deployments for real-world inference

    • Unleashing multimodal magic with RamaLama

    • Integrate Red Hat AI Inference Server & LangChain in agentic workflows

    • Streamline multi-cloud operations with Ansible and ServiceNow

    • Automate dynamic application security testing with RapiDAST

    What’s up next?


    Red Hat Developers logo LinkedIn YouTube Twitter Facebook

    Products

    • Red Hat Enterprise Linux
    • Red Hat OpenShift
    • Red Hat Ansible Automation Platform

    Build

    • Developer Sandbox
    • Developer Tools
    • Interactive Tutorials
    • API Catalog

    Quicklinks

    • Learning Resources
    • E-books
    • Cheat Sheets
    • Blog
    • Events
    • Newsletter

    Communicate

    • About us
    • Contact sales
    • Find a partner
    • Report a website issue
    • Site Status Dashboard
    • Report a security problem

    RED HAT DEVELOPER

    Build here. Go anywhere.

    We serve the builders. The problem solvers who create careers with code.

    Join us if you’re a developer, software engineer, web designer, front-end designer, UX designer, computer scientist, architect, tester, product manager, project manager or team lead.

    Sign me up

    Red Hat legal and privacy links

    • About Red Hat
    • Jobs
    • Events
    • Locations
    • Contact Red Hat
    • Red Hat Blog
    • Inclusion at Red Hat
    • Cool Stuff Store
    • Red Hat Summit

    Red Hat legal and privacy links

    • Privacy statement
    • Terms of use
    • All policies and guidelines
    • Digital accessibility

    Report a website issue