Redhat Developers  Logo
  • AI

    Get started with AI

    • Red Hat AI
      Accelerate the development and deployment of enterprise AI solutions.
    • AI learning hub
      Explore learning materials and tools, organized by task.
    • AI interactive demos
      Click through scenarios with Red Hat AI, including training LLMs and more.
    • AI/ML learning paths
      Expand your OpenShift AI knowledge using these learning resources.
    • AI quickstarts
      Focused AI use cases designed for fast deployment on Red Hat AI platforms.
    • No-cost AI training
      Foundational Red Hat AI training.

    Featured resources

    • OpenShift AI learning
    • Open source AI for developers
    • AI product application development
    • Open source-powered AI/ML for hybrid cloud
    • AI and Node.js cheat sheet

    Red Hat AI Factory with NVIDIA

    • Red Hat AI Factory with NVIDIA is a co-engineered, enterprise-grade AI solution for building, deploying, and managing AI at scale across hybrid cloud environments.
    • Explore the solution
  • Learn

    Self-guided

    • Documentation
      Find answers, get step-by-step guidance, and learn how to use Red Hat products.
    • Learning paths
      Explore curated walkthroughs for common development tasks.
    • See all learning

    Hands-on

    • Developer Sandbox
      Spin up Red Hat's products and technologies without setup or configuration.
    • Interactive labs
      Learn by doing in these hands-on, browser-based experiences.
    • Interactive demos
      Click through product features in these guided tours.

    Browse by topic

    • AI/ML
    • Automation
    • Java
    • Kubernetes
    • Linux
    • See all topics

    Training & certifications

    • Courses and exams
    • Certifications
    • Skills assessments
    • Red Hat Academy
    • Learning subscription
    • Explore training
  • Build

    Get started

    • Red Hat build of Podman Desktop
      A downloadable, local development hub to experiment with our products and builds.
    • Developer Sandbox
      Spin up Red Hat's products and technologies without setup or configuration.

    Download products

    • Access product downloads to start building and testing right away.
    • Red Hat Enterprise Linux
    • Red Hat AI
    • Red Hat OpenShift
    • Red Hat Ansible Automation Platform
    • See all products

    Featured

    • Red Hat build of OpenJDK
    • Red Hat JBoss Enterprise Application Platform
    • Red Hat OpenShift Dev Spaces
    • Red Hat Developer Toolset

    References

    • E-books
    • Documentation
    • Cheat sheets
    • Architecture center
  • Community

    Get involved

    • Events
    • Live AI events
    • Red Hat Summit
    • Red Hat Accelerators
    • Community discussions

    Follow along

    • Articles & blogs
    • Developer newsletter
    • Videos
    • Github

    Get help

    • Customer service
    • Customer support
    • Regional contacts
    • Find a partner

    Join the Red Hat Developer program

    • Download Red Hat products and project builds, access support documentation, learning content, and more.
    • Explore the benefits

Reducing the startup overhead of SystemTap monitoring scripts with syscall_any tapset

November 8, 2018
William Cohen
Related topics:
Linux
Related products:
Red Hat Enterprise Linux

    A number of the SystemTap script examples in the newly released SystemTap 4.0 available in Fedora 28 and 29 have reduced the amount of time required to convert the scripts into running instrumentation by using the syscall_any tapset.

    This article discusses the particular changes made in the scripts and how you might also use this new tapset to make the instrumentation that monitors system calls smaller and more efficient. (This article is a follow-on to my previous article: Analyzing and reducing SystemTap’s startup cost for scripts.)

    The key observation that triggered the creation of the syscall_any tapset was a number of scripts that did not use the syscall arguments. The scripts often used syscall.* and syscall.*.return, but they were only concerned with the particular syscall name and the return value. This type of information for all the system calls is available from the sys_entry and sys_exit kernel tracepoints. Thus, rather than creating hundreds of kprobes for each of the individual functions implementing the various system calls, there are just a couple of tracepoints being used in their place.

    Let's take a concrete look at the impact of using syscall_any.*.return in place of syscall.*.return with the errno.stp example on a Fedora 28 machine. This errno.stp script provides system-wide information about the system calls that return error codes. It prints a separate line for each combination of PID, system call, and error. At the end of each line is a count of the times that particular combination was seen. Below is a version of the script using syscall.*.return.

    #!/usr/bin/stap
    #
    # Copyright (C) 2010, 2018 Red Hat, Inc.
    # By Dominic Duval, Red Hat Inc.
    # dduval@redhat.com
    #
    # Monitors errors returned by system calls.
    #
    # USAGE: stap errno.stp
    #
    
    global execname, errors
    
    probe syscall.*.return {
      errno = retval
      if ( errno < 0 ) {
        p = pid()
        execname[p]=execname();
        errors[p, errno, name] <<< 1
      }
    }
    
    probe end {
      printf("\n")
      printf("%8s %-32s %-16s %-12s %8s\n",
        "PID", "Syscall", "Process", "Error", "Count")
      foreach ([pid, error, thissyscall] in errors- limit 20) {
        printf("%8d %-32s %-16s %-12s %8d\n",
          pid,
          thissyscall, 
          execname[pid],
          error ? errno_str(error) : "",
          @count(errors[pid, error, thissyscall])
        )
      }
    }
    
    global prom_arr
    
    probe prometheus {
      foreach ([p, errno, name] in errors- limit 20) {
        prom_arr[p, errno, name] = @count(errors[p, errno, name])
      }
    
      @prometheus_dump_array3(prom_arr, "count", "pid", "errno", "name")
      delete prom_arr
    }
    

    We can use the stap_time.stp script discussed in my previous SystemTap article to record the time required by the various SystemTap phases. The stap_time.stp script will be running in another window.

    Below is a run of the old_errorno.stp script that instruments the system calls with the syscall.*.return probe points. The command line has -m old_error to keep the resulting kernel module old_errno.ko around, the keep temporary files (-k) option so we can look at the size of the files used to create the instrumentation, and -T 0.25 to run the instrumentation for a quarter second.

    $ stap -m old_errno -k old_errno.stp -T 0.25
    
         PID Syscall                          Process          Error           Count
        8489 read                             pulseaudio       EAGAIN             50
        9016 recvmsg                          Timer            EAGAIN             16
        9223 recvmsg                          firefox          EAGAIN             11
        9016 futex                            Timer            ETIMEDOUT           7
        8386 recvmsg                          gnome-shell      EAGAIN              7
       25430 recvmsg                          Web Content      EAGAIN              6
        2196 futex                            pmdaperfevent    ETIMEDOUT           2
       16278 read                             stapio           EAGAIN              1
       25430 futex                            Web Content      ETIMEDOUT           1
        9792 recvmsg                          hexchat          EAGAIN              1
    Keeping temporary directory "/tmp/stapUfJ9KC"
    

    Now we'll replace the syscall.*.return in the script with syscall_any.return. The new, improved version has similar output:

    $ stap -m new_errno -k new_errno.stp -T 0.25
    
         PID Syscall                          Process          Error           Count
        8489 read                             pulseaudio       EAGAIN             50
        9016 recvmsg                          Web Content      EAGAIN             40
        9016 futex                            Web Content      ETIMEDOUT          10
        8386 recvmsg                          gnome-shell      EAGAIN              9
       11884 recvmsg                          Web Content      EAGAIN              8
        9792 recvmsg                          hexchat          EAGAIN              4
        2196 futex                            pmdaperfevent    ETIMEDOUT           3
       10336 read                             gnome-terminal-  EAGAIN              2
       16840 read                             stapio           EAGAIN              1
        5262 read                             qemu-system-x86  EAGAIN              1
        1863 recvmsg                          gsd-color        EAGAIN              1
         811 openat                           systemd-journal  ENOENT              1
       11884 futex                            Web Content      ETIMEDOUT           1
    Keeping temporary directory "/tmp/staprI6U1R"
    

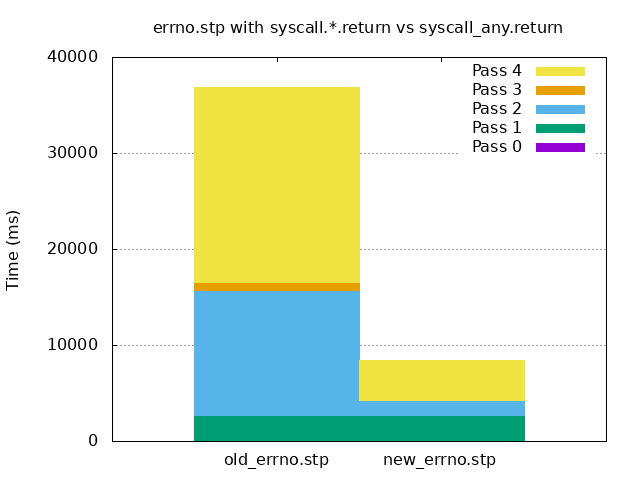
    The stap_time script provided the following output for the various passes of generating the instrumentation:

    $ stap stap_time.stp 
    old_errno.stp 80 2592 13033 807 20384
    new_errno.stp 96 2594 1593 22 4125
    

    With some minor work, Gnuplot can generate a graph of the data, as seen below. Pass 2 (elaboration) and pass 4 (compilation) are the ones that take a majority of the time in old_errno.stp using the syscall.*.return probe points. We see those are greatly reduced in new_errno.stp using the syscall_any.return probe point: from 13,033 ms to 1,593 ms for pass 2 and from 20,384 ms to 4,125 ms for pass 4. We also see pass 3 code generation is virtually nonexistent on the graph (reduced from 807 ms to 22 ms).

    Graph showing reduced times for generating the instrumentation

    The new_errno.ko script is less than 1/3 the size of the old_errno.ko script:

    $ ls -ls *.ko
     472 -rw-rw-r--. 1 wcohen wcohen  481016 Nov  1 11:07 new_errno.ko
    1528 -rw-rw-r--. 1 wcohen wcohen 1564360 Nov  1 11:06 old_errno.ko
    

    Looking at the *src.c files in the temporary directories /tmp/stapUfJ9KC/ and /tmp/staprI6U1R/, we can see that old_errno_src.c is about four times larger than new_errno_src.c. This explains the additional overhead for the pass 3 code generation and pass 4 compilation and the larger old_errno.ko.

    $ ls -l /tmp/stapUfJ9KC/*src.c /tmp/staprI6U1R/*src.c
    -rw-rw-r--. 1 wcohen wcohen  967746 Nov  1 11:07 /tmp/staprI6U1R/new_errno_src.c
    -rw-rw-r--. 1 wcohen wcohen 4119779 Nov  1 11:06 /tmp/stapUfJ9KC/old_errno_src.c
    

    Conclusion

    If your SystemTap script just requires information about the system call name and return value for all the system calls, you should consider using the syscall_any tapset in place of the syscall.* to make the instrumentation compile faster and result in small instrumentation.

    Additional resources

    See my other  articles on Red Hat Developers:

    • Making the Operation of Code More Transparent and Obvious with SystemTap
    • "Use the dynamic tracing tools, Luke"
    • Find what capabilities an application requires to successfully run in a container
    • How to avoid wasting megabytes of memory a few bytes at a time
    • Instruction-level Multithreading to improve processor utilization
    • “Don’t cross the streams”: Thread safety and memory accesses at the speed of light

    Red Hat Developer has many other articles on SystemTap and performance.

    Recent Posts

    • Federated identity across the hybrid cloud using zero trust workload identity manager

    • Confidential virtual machine storage attack scenarios

    • Introducing virtualization platform autopilot

    • Integrate zero trust workload identity manager with Red Hat OpenShift GitOps

    • Best Practice Configuration and Tuning for Linux and Windows VMs

    Red Hat Developers logo LinkedIn YouTube Twitter Facebook

    Platforms

    • Red Hat AI
    • Red Hat Enterprise Linux
    • Red Hat OpenShift
    • Red Hat Ansible Automation Platform
    • See all products

    Build

    • Developer Sandbox
    • Developer tools
    • Interactive tutorials
    • API catalog

    Quicklinks

    • Learning resources
    • E-books
    • Cheat sheets
    • Blog
    • Events
    • Newsletter

    Communicate

    • About us
    • Contact sales
    • Find a partner
    • Report a website issue
    • Site status dashboard
    • Report a security problem

    RED HAT DEVELOPER

    Build here. Go anywhere.

    We serve the builders. The problem solvers who create careers with code.

    Join us if you’re a developer, software engineer, web designer, front-end designer, UX designer, computer scientist, architect, tester, product manager, project manager or team lead.

    Sign me up

    Red Hat legal and privacy links

    • About Red Hat
    • Jobs
    • Events
    • Locations
    • Contact Red Hat
    • Red Hat Blog
    • Inclusion at Red Hat
    • Cool Stuff Store
    • Red Hat Summit
    © 2026 Red Hat

    Red Hat legal and privacy links

    • Privacy statement
    • Terms of use
    • All policies and guidelines
    • Digital accessibility

    Chat Support

    Please log in with your Red Hat account to access chat support.