Introduction
New Relic is an application-monitoring platform that provides in-depth analytics and analysis for applications regardless of the type of environment where they are deployed, or as New Relic put it themselves:
“Gain end-to-end visibility across your customer experience, application performance, and dynamic infrastructure with the New Relic Digital Intelligence Platform.” - New Relic
You might ask why there’s a use for New Relic’s monitoring capabilities when Red Hat Mobile Application Platform (RHMAP) and OpenShift Container Platform both offer insights into the CPU, Disk, Memory, and general resource utilization of your server-side applications. While these generic resource reports are valuable, they might not offer the detail required to debug a specific issue. Since New Relic is built as an analytics platform from the ground up it is capable of providing unique insights into the specific runtime of your applications. For example, the JavaScript code deployed in Node.js applications is run using the V8 JavaScript engine which has a life-cycle that can have a significant impact on the performance of your application depending on how you’ve written it. Utilizing New Relic’s Node.js module provides a real-time view of V8 engine performance and how they might be affecting the performance of your production application. By using this data, you can refine your application code to reduce memory usage, which in turn can free CPU resources due to less frequent garbage collections. Neat!
Now that we have an understanding of what New Relic can provide we’ll walk you through the steps required to add New Relic monitoring to a Node.js application deployed on Red Hat Mobile Application Platform. By the end of this blog post, you'll have a reusable configuration file that is dynamically generated based on the Node.js application you're deploying and the ability to have New Relic automatically detect deployments as you promote your application to upper environments.
Prerequisites
We assume that you have a Red Hat Mobile Application Platform instance available for this guide. You'll also need to sign up for a New Relic account by heading over to newrelic.com/signup and entering some details. You don’t need to enter any payment information at this time, but a paid subscription is required to unlock all features they offer such as the Node.js VM statistics we use in parts of this blog post.
Create a Project on RHMAP
NOTE: If you have an existing Project that has a Node.js Cloud Application you can feel free to skip this section and use your existing Project.
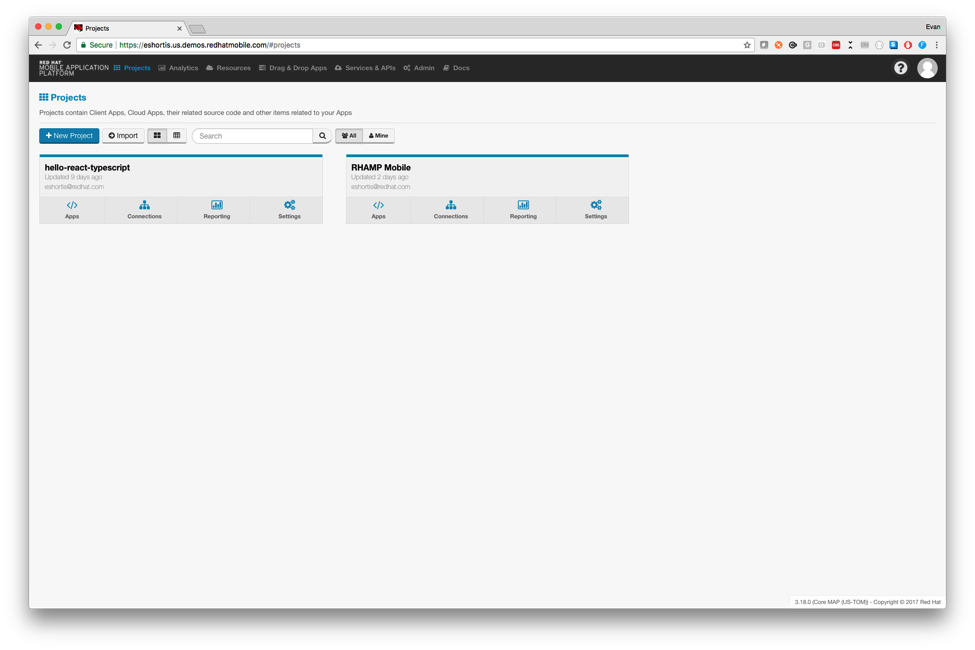
Navigate to your Red Hat Mobile Application Platform instance and load the Projects screen. It should look similar to the screen below where you can see I already have some existing Projects.
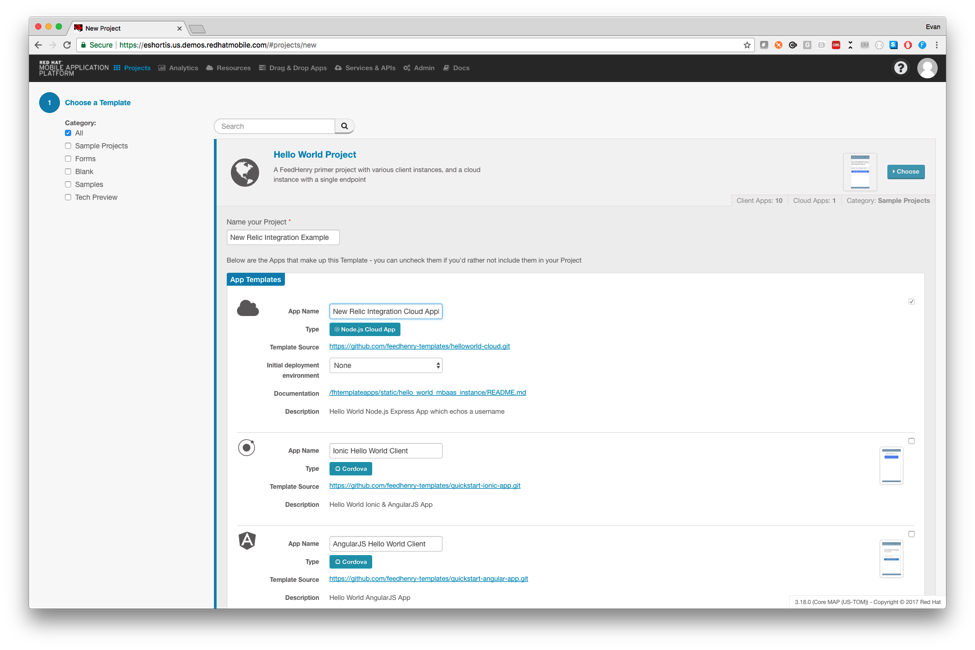
In the top left of this screen click New Project, then on the next screen choose the Hello World Project template and enter a Project name and a unique name for the Cloud Application as shown. It’s important to enter a unique name for the Cloud Application since we’ll use this name to link it to the New Relic dashboard. Once you’ve entered the names scroll down and click Create.
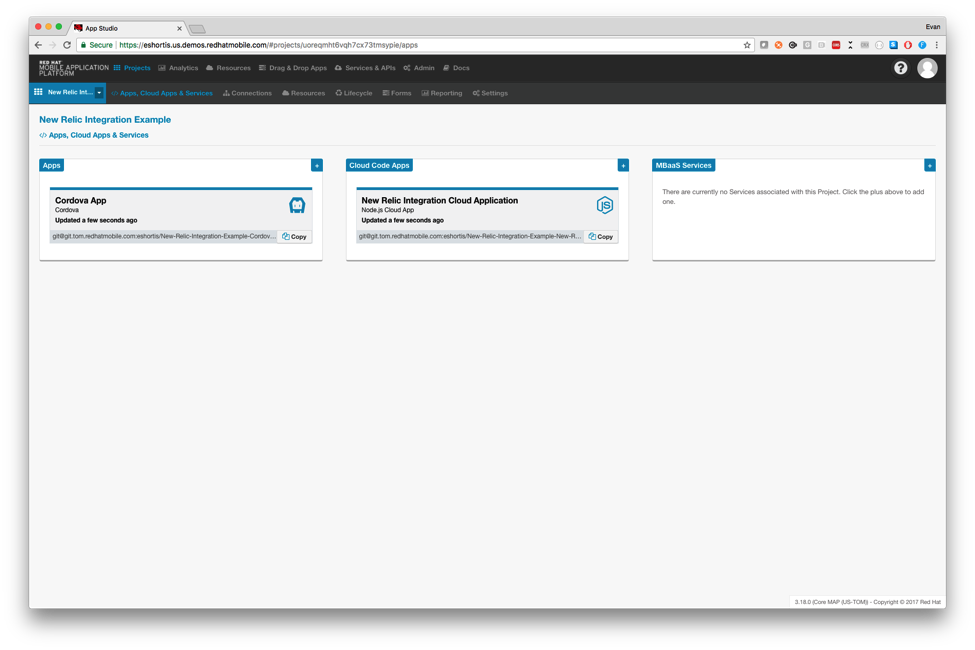
Once the Project creation process is complete you should be presented with output detailing what actions were taken, and below it is a Finish button. Click Finish and you’ll be taken to your Project screen that looks like the one shown below.
Congratulations, you’ve created a Project. Let’s start by updating the Node.js based Cloud Application with the New Relic module.
Adding New Relic to a Node.js Application
You’ll be pleasantly surprised with how easy it is to add New Relic monitoring to your Node.js Cloud Application. Let’s start by configuring our Node.js Cloud Application using the Red Hat Mobile Application Platform UI.
Navigate to your Project and click your Cloud Application to view it. In the next screen, choose the Editor option on the left to load our web-based editor. Typically, we recommend working using Git and a local text editor to interact with your Project source code, but for simplicity, in this guide, we’re going to use this Editor screen.
Adding Dependencies
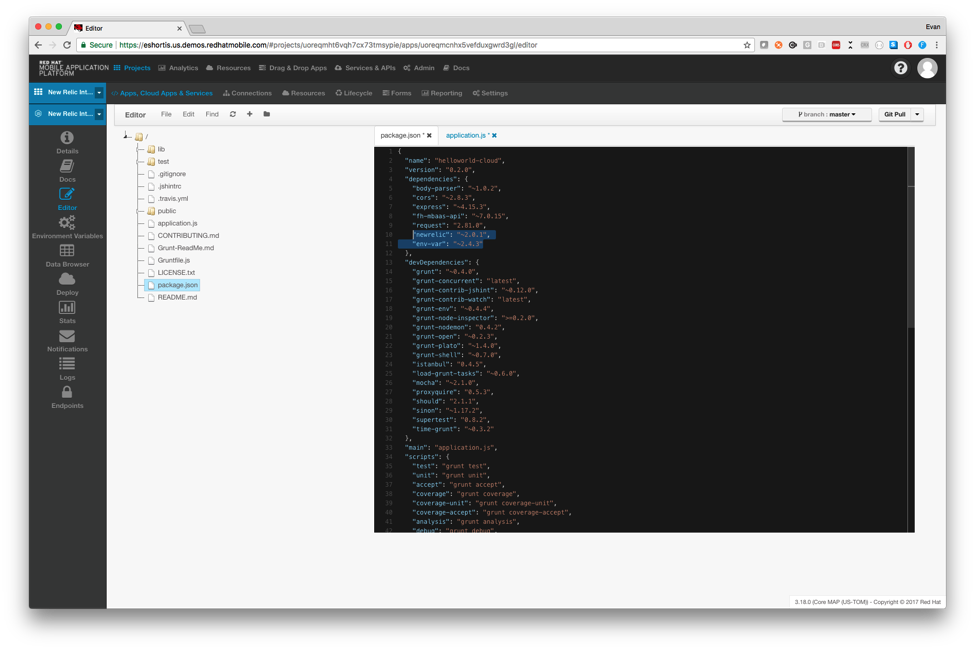
In the Editor choose the package.json file and in the dependencies block add the following lines:
  "newrelic": "~2.0.1",
  "env-var": "~2.4.3"
We are prefixing the version number with a tilde (~) character to specify that the application should install the most recent PATCH version of the module while respecting the MAJOR and MINOR version numbers. This means a later deployment might install version 2.0.2 of the New Relic module, but a version greater than 2.0 will never be used. For more information on the package.json, dependencies section view the npmjs.com semver guide.
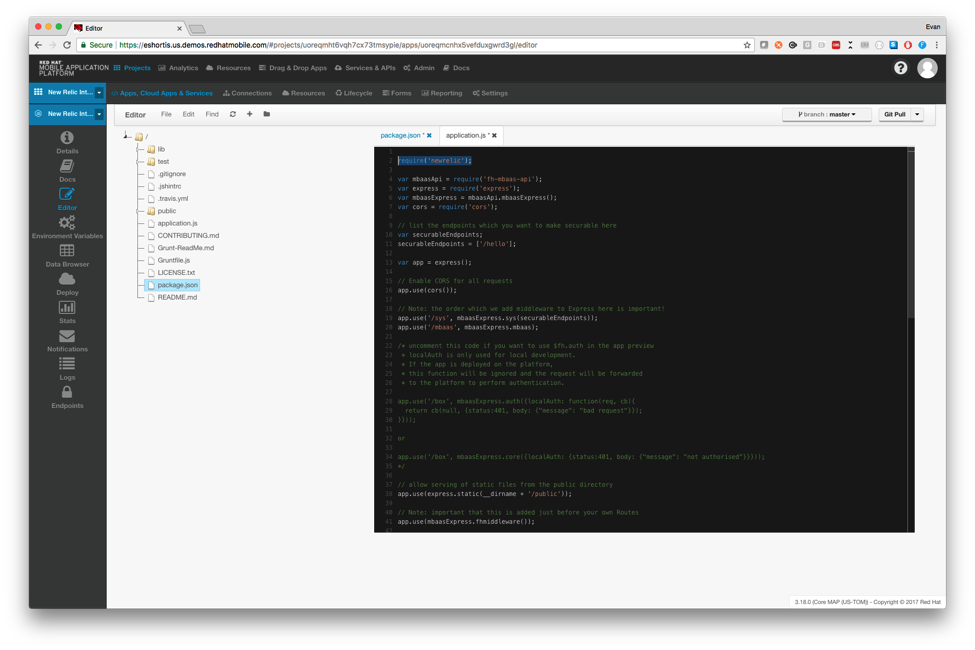
After making the specified changes your package.json will resemble the one from the image below:
Using the File menu choose Save and you’re ready for the next step.
Load the New Relic Module
Next, we’re going to update the application.js file to use this new dependency we’ve added. Add the following line to the top of the application.js file before all other require statements to load the New Relic module into your Node.js Cloud Application.
require('newrelic');
Here’s what the application.js looks like once updated:
Configure the New Relic Module
The New Relic module configures itself by searching for a newrelic.js file in the root directory of the project so we need to create this file.
Choose New File from the File menu, then enter the name newrelic.js in the dialog that appears. In the new file that has been created paste the following configuration and save it:
'use strict'

const get = require('env-var');
let name = get('FH_TITLE').asString();
let env = get('FH_ENV').asString();

if (!env) {
  // environment is not defined - we’re running on developer machine
  name = 'Local Development Cloud'
} else {
  // produces 'YourNodeAppName-dev' or similar
  name = `${name}-(${env})`

}

exports.config = {
  app_name: [name],

  // This will be loaded from an environment variable since we
  // don’t want to check it into our code in plaintext
  licence_key: get('NR_LICENCE_KEY').required().asString(),

  logging: {
    // output to stdout instead of a logfile - rhamp monitors stdout
    filepath: 'stdout',
    // changing this is easier when it’s an environment variable
    // defaults to the info level if not defined in the environment
    level: get('NR_LOG_LEVEL', 'info').asString()
  }
}
This file is reading environment variables that Red Hat Mobile Application Platform defines to customize the runtime of your application. Environment variables typically change as you promote your application towards production, e.g. NR_LOG_LEVEL might be “trace” in development, but “info” in production.
Here’s a quick explanation of the variables we’ll be using:
- FH_TITLE - Your application’s name. The Red Hat Mobile Application Platform injects this when the application is deployed.
- FH_ENV - Environment where the application is running. Typically contains values such as dev, test, or prod. Red Hat Mobile Application Platform also injects this.
- NR_LICENCE_KEY - We’ll add this in the next steps. It will be your New Relic licence key.
- NR_LOG_LEVEL - The logging level that the New Relic module will use.
Defining Environment Variables
The NR_LICENCE_KEY and NR_LOG_LEVEL variables from above are custom values that we will need to add to our application. Directly below the Editor link in the Studio you can click the Environment Variables link and should be presented with the list of variables your application has defined. Right now, the list should be empty since we’ve not deployed our application yet.
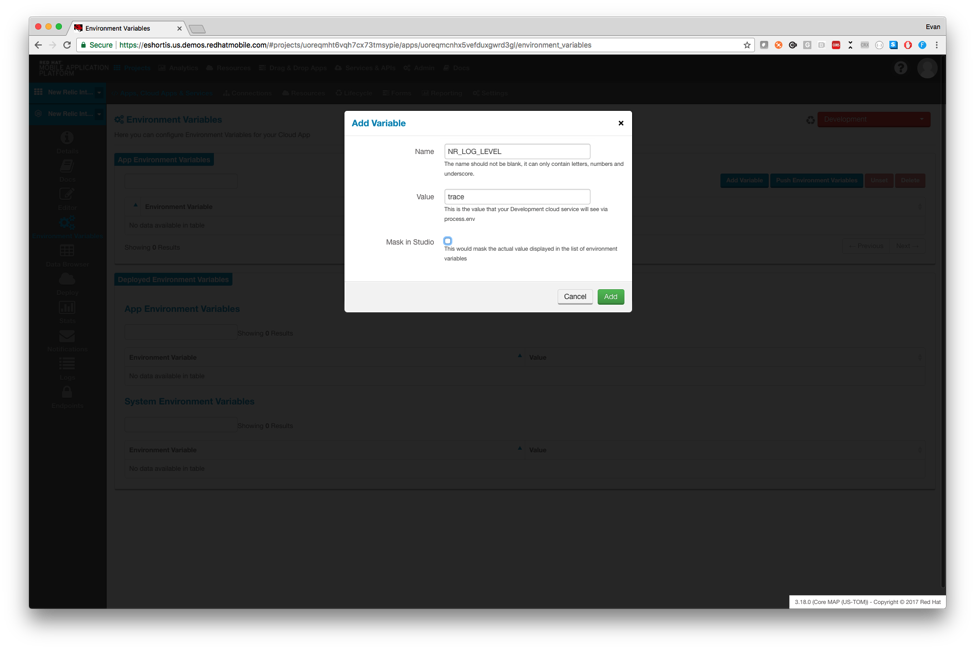
Click the Add variable button and in that pop up that appears to enter NR_LOG_LEVEL for the variable name, and enter info as the value, then click the Add button.
Next, we need to define the NR_LICENCE_KEY variable, but to do so we need to get our key. Start by heading over to your New Relic dashboard at rpm.newrelic.com and choose the APM tab at the top of the window. This will present a screen where you can choose the technology stack you’re planning to integrate with. Choose Node.js and then click the Reveal License Key button on the screen that follows. It should look something like the one here.

Copy the key and then paste it into the Value field for the NR_LICENCE_KEY variable in the Environment Variables screen similar to the NR_LOG_LEVEL you just defined. We also recommend checking the Mask in Studio box to prevent it from being visible in plaintext.
Deploying the Node.js Application on Red Hat Mobile Application Platform
Finally, we’re going to deploy the Node.js Cloud Application - this is the easy part!
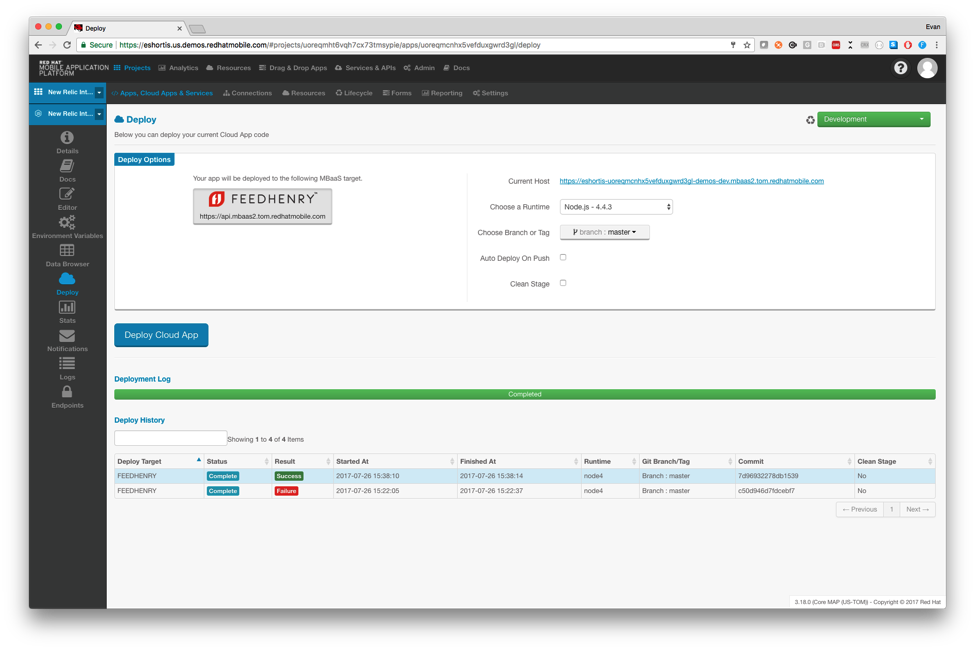
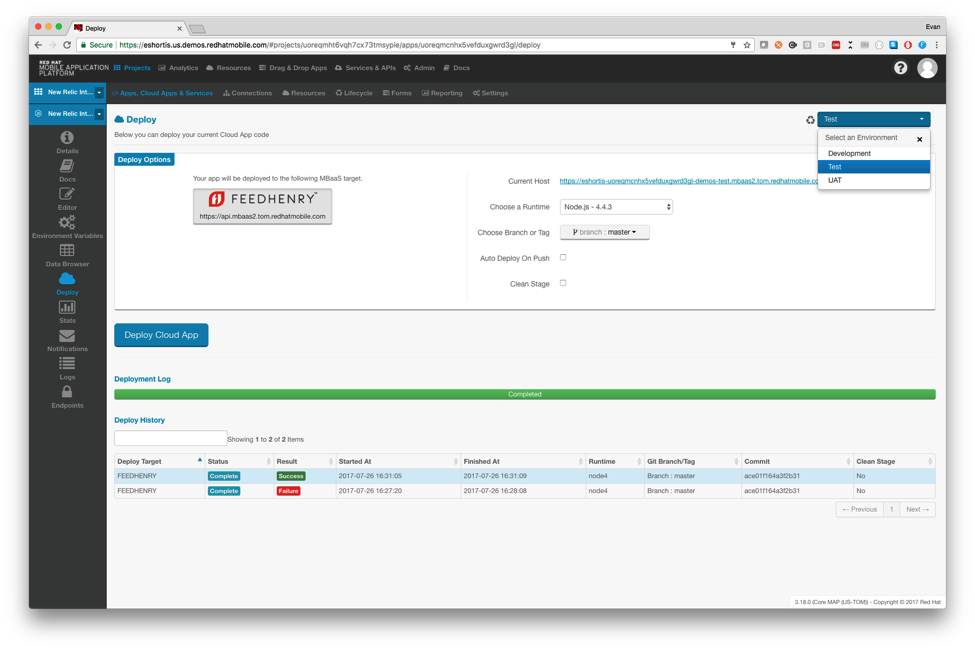
Below the Environment Variables link is a Deploy link that you can click to access the deploy screen. Navigate to the Deploy screen, ensure Node.js 4.4.3 or newer is selected in the Choose a Runtime drop-down, and then hit the Deploy Cloud App button. A progress bar will give you updates about the deploy process.
The initial deploy typically takes less than 2 minutes, but in rare cases where applications have a large number of dependencies, it can take a little longer. Subsequent deployments will be much faster. Once the deployment is complete you should see a “Success” entry in the deployment logs below the progress bar like so:
Generating Data for New Relic
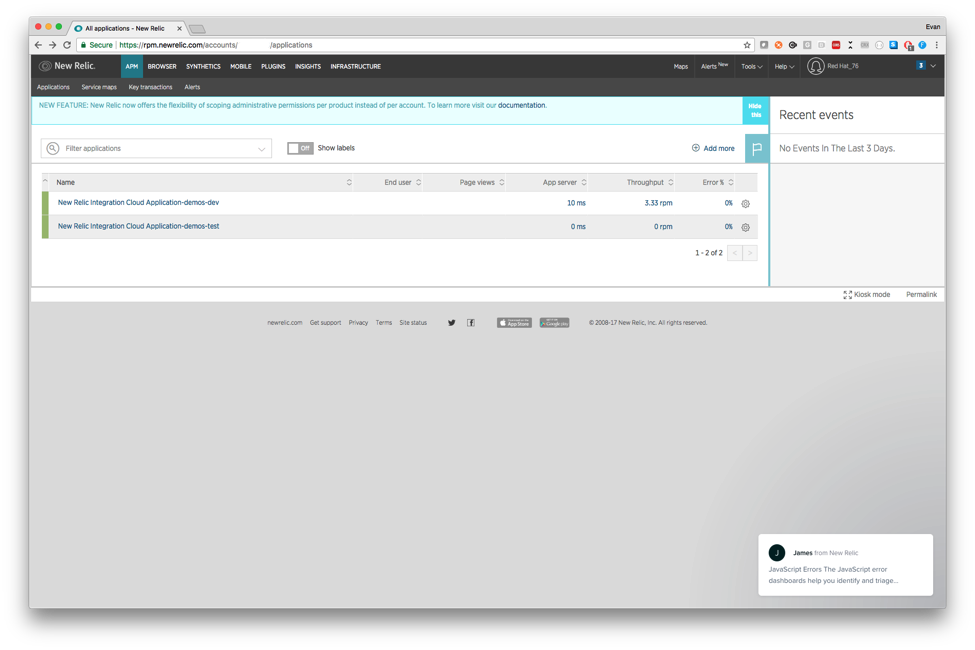
Now that our application is running we should verify it is sending data to New Relic. Visit rpm.newrelic.com, select the APM tab, and you should see your application listed like so.
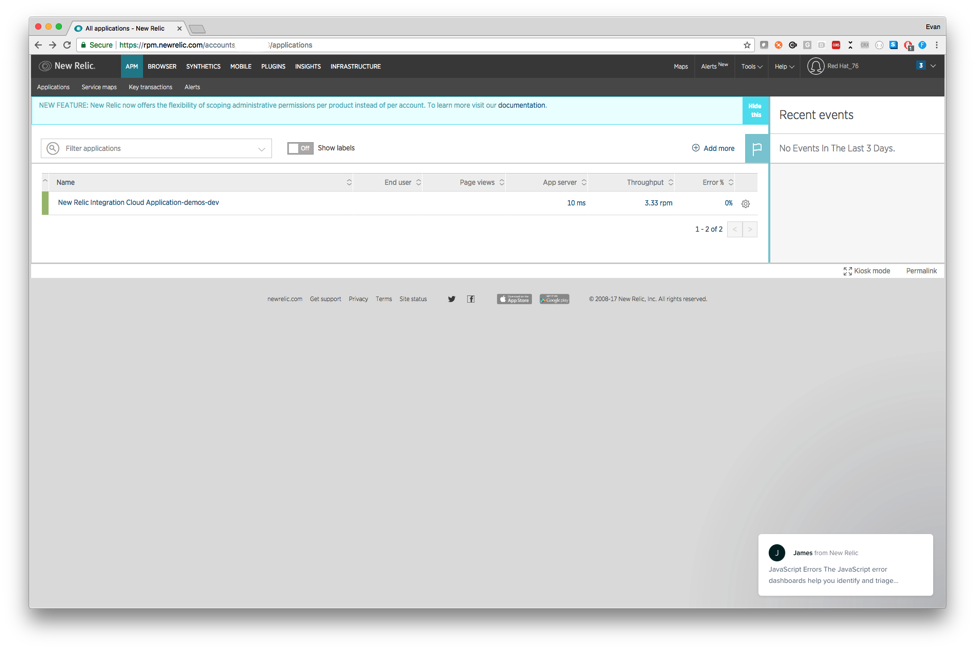
If your application is not listed then you might need to verify the NR_LICENCE_KEY is set. You might also need to wait a few minutes for New Relic to generate the dashboard using captured data.
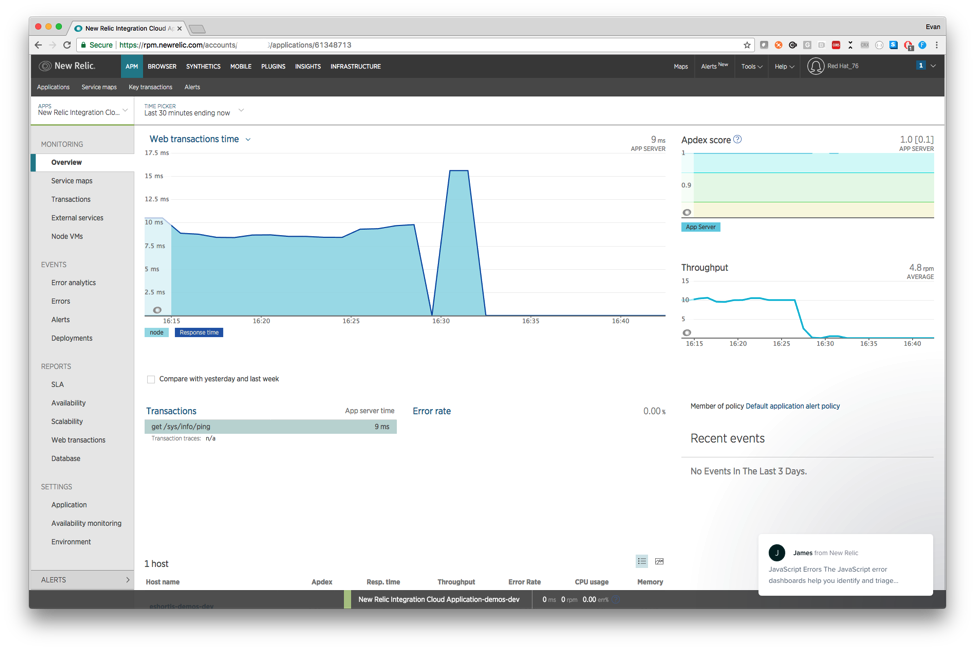
Click the application to view it and you should see some activity already, namely the sys/info/ping transaction. This is an endpoint defined by Red Hat’s fh-mbaas-api express middleware. The Red Hat Mobile Application Platform UI will occasionally perform a HTTPS request to this endpoint while you’re viewing your application. It does this so it can indicate the status of your application on the Details page and in the top-right corner of the web UI. Let's create a real transaction of our own though.
Navigate back to the Details or Deploy screen of your Cloud Application and click the URL listed. It should open to a page that states:
Your Node.js code is deployed and running. This file is served statically from public/index.html.
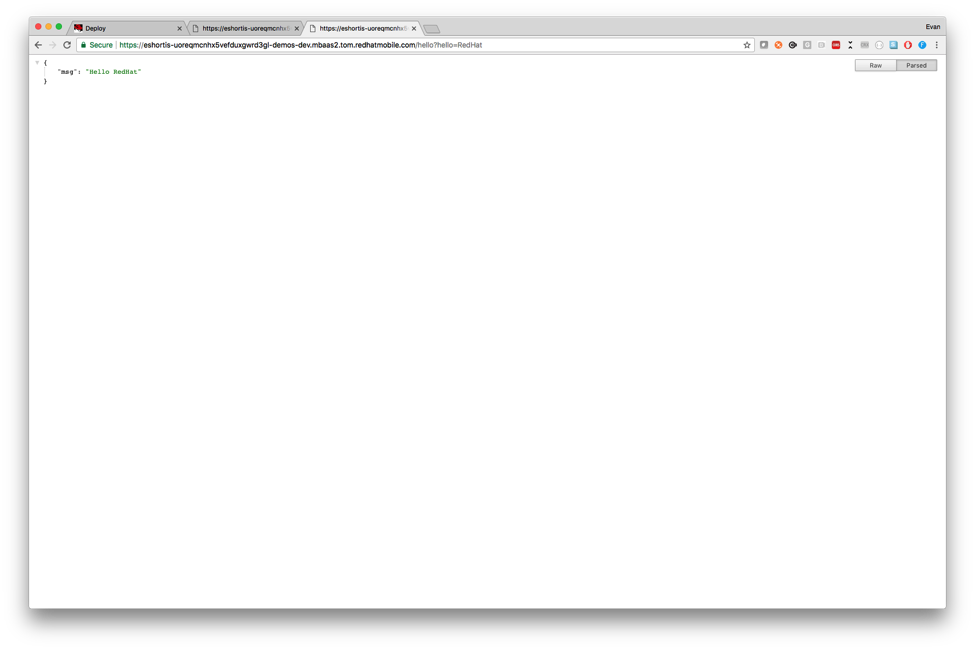
Now, add the following to the end of the URL /hello?hello=RedHat and press enter. This should respond with a JSON payload contain “Hello Red Hat” as shown.
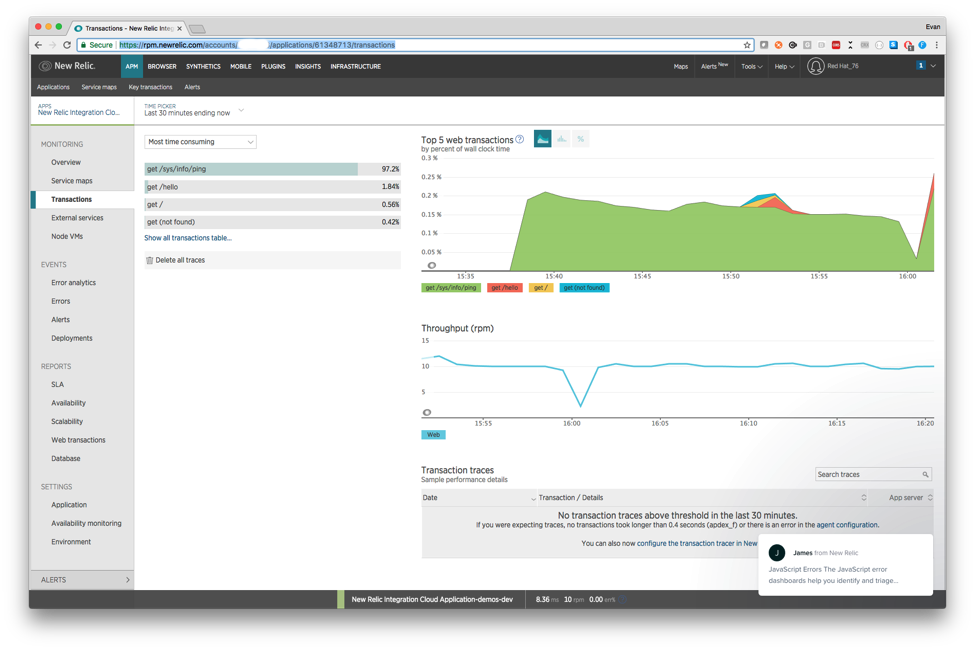
After performing these requests load the Transactions screen in New Relic and you should present with a breakdown of the various requests being performed by your application.
Adding Extra Environments
Typically, our customers deploy multiple environments for development, testing, uat, and production. Thankfully New Relic is able to handle this, and since we’ve generated our New Relic configuration file using environment variables all we need to do is returned to the Red Hat Mobile Application Platform UI, select our new environment as shown below, update environment variables if necessary, then deploy our application in the new environment.
Once the application has deployed into your new environment you can navigate back to the New Relic dashboard and it should appear below your existing deployment, but with a different environment at the end of the name. Simple!
Debugging Using New Relic
NOTE: The following example is deliberately contrived and is being run on a virtual machine with limited resources to demonstrate how we can debug a performance issue. It is being executed on a small VM with limited resources. Production Node.js applications that integrate with databases and external APIs won't show these issues unless they are under significantly more load than that being used below.
Let's look at how we might debug an issue using New Relic. For this example, we'll deliberately add a CPU intensive operation to our Cloud Application - computing Fibonacci numbers. We'll start by adding this code into the application.js file after the /hello endpoint.
const fibonacci = require('fibonacci');
app.get('/fibonacci/:iterations', (req, res) => {
  // performs the given number of iterations in a fibonacci sequence
  res.json(fibonacci.iterate(req.params.iterations));
});
Remember, you'll also need to add the Fibonacci module into the dependencies section of the package.json similar to how we added new relic.
Deploy this code using the same approach demonstrated previously and name your new endpoint like so https://$YOUR_HOST.redhatmobile.com/Fibonacci/1500. The response will contain the 1500th number in the Fibonacci sequence and how long it took the computation to complete. Hitting this endpoint a few times, using Apache Bench reports that my server can only serve approximately 38 requests per second! Assuming you have Apache Bench installed you can try it yourself using this command to perform 200 concurrent requests to compute the 1500th number in the Fibonacci sequence:
$ ab -n 200 -c 200 https://$HOST/fibonacci/1500
Let's look at the New Relic graphs to gain some insight into why our server is struggling to process multiple concurrent requests.
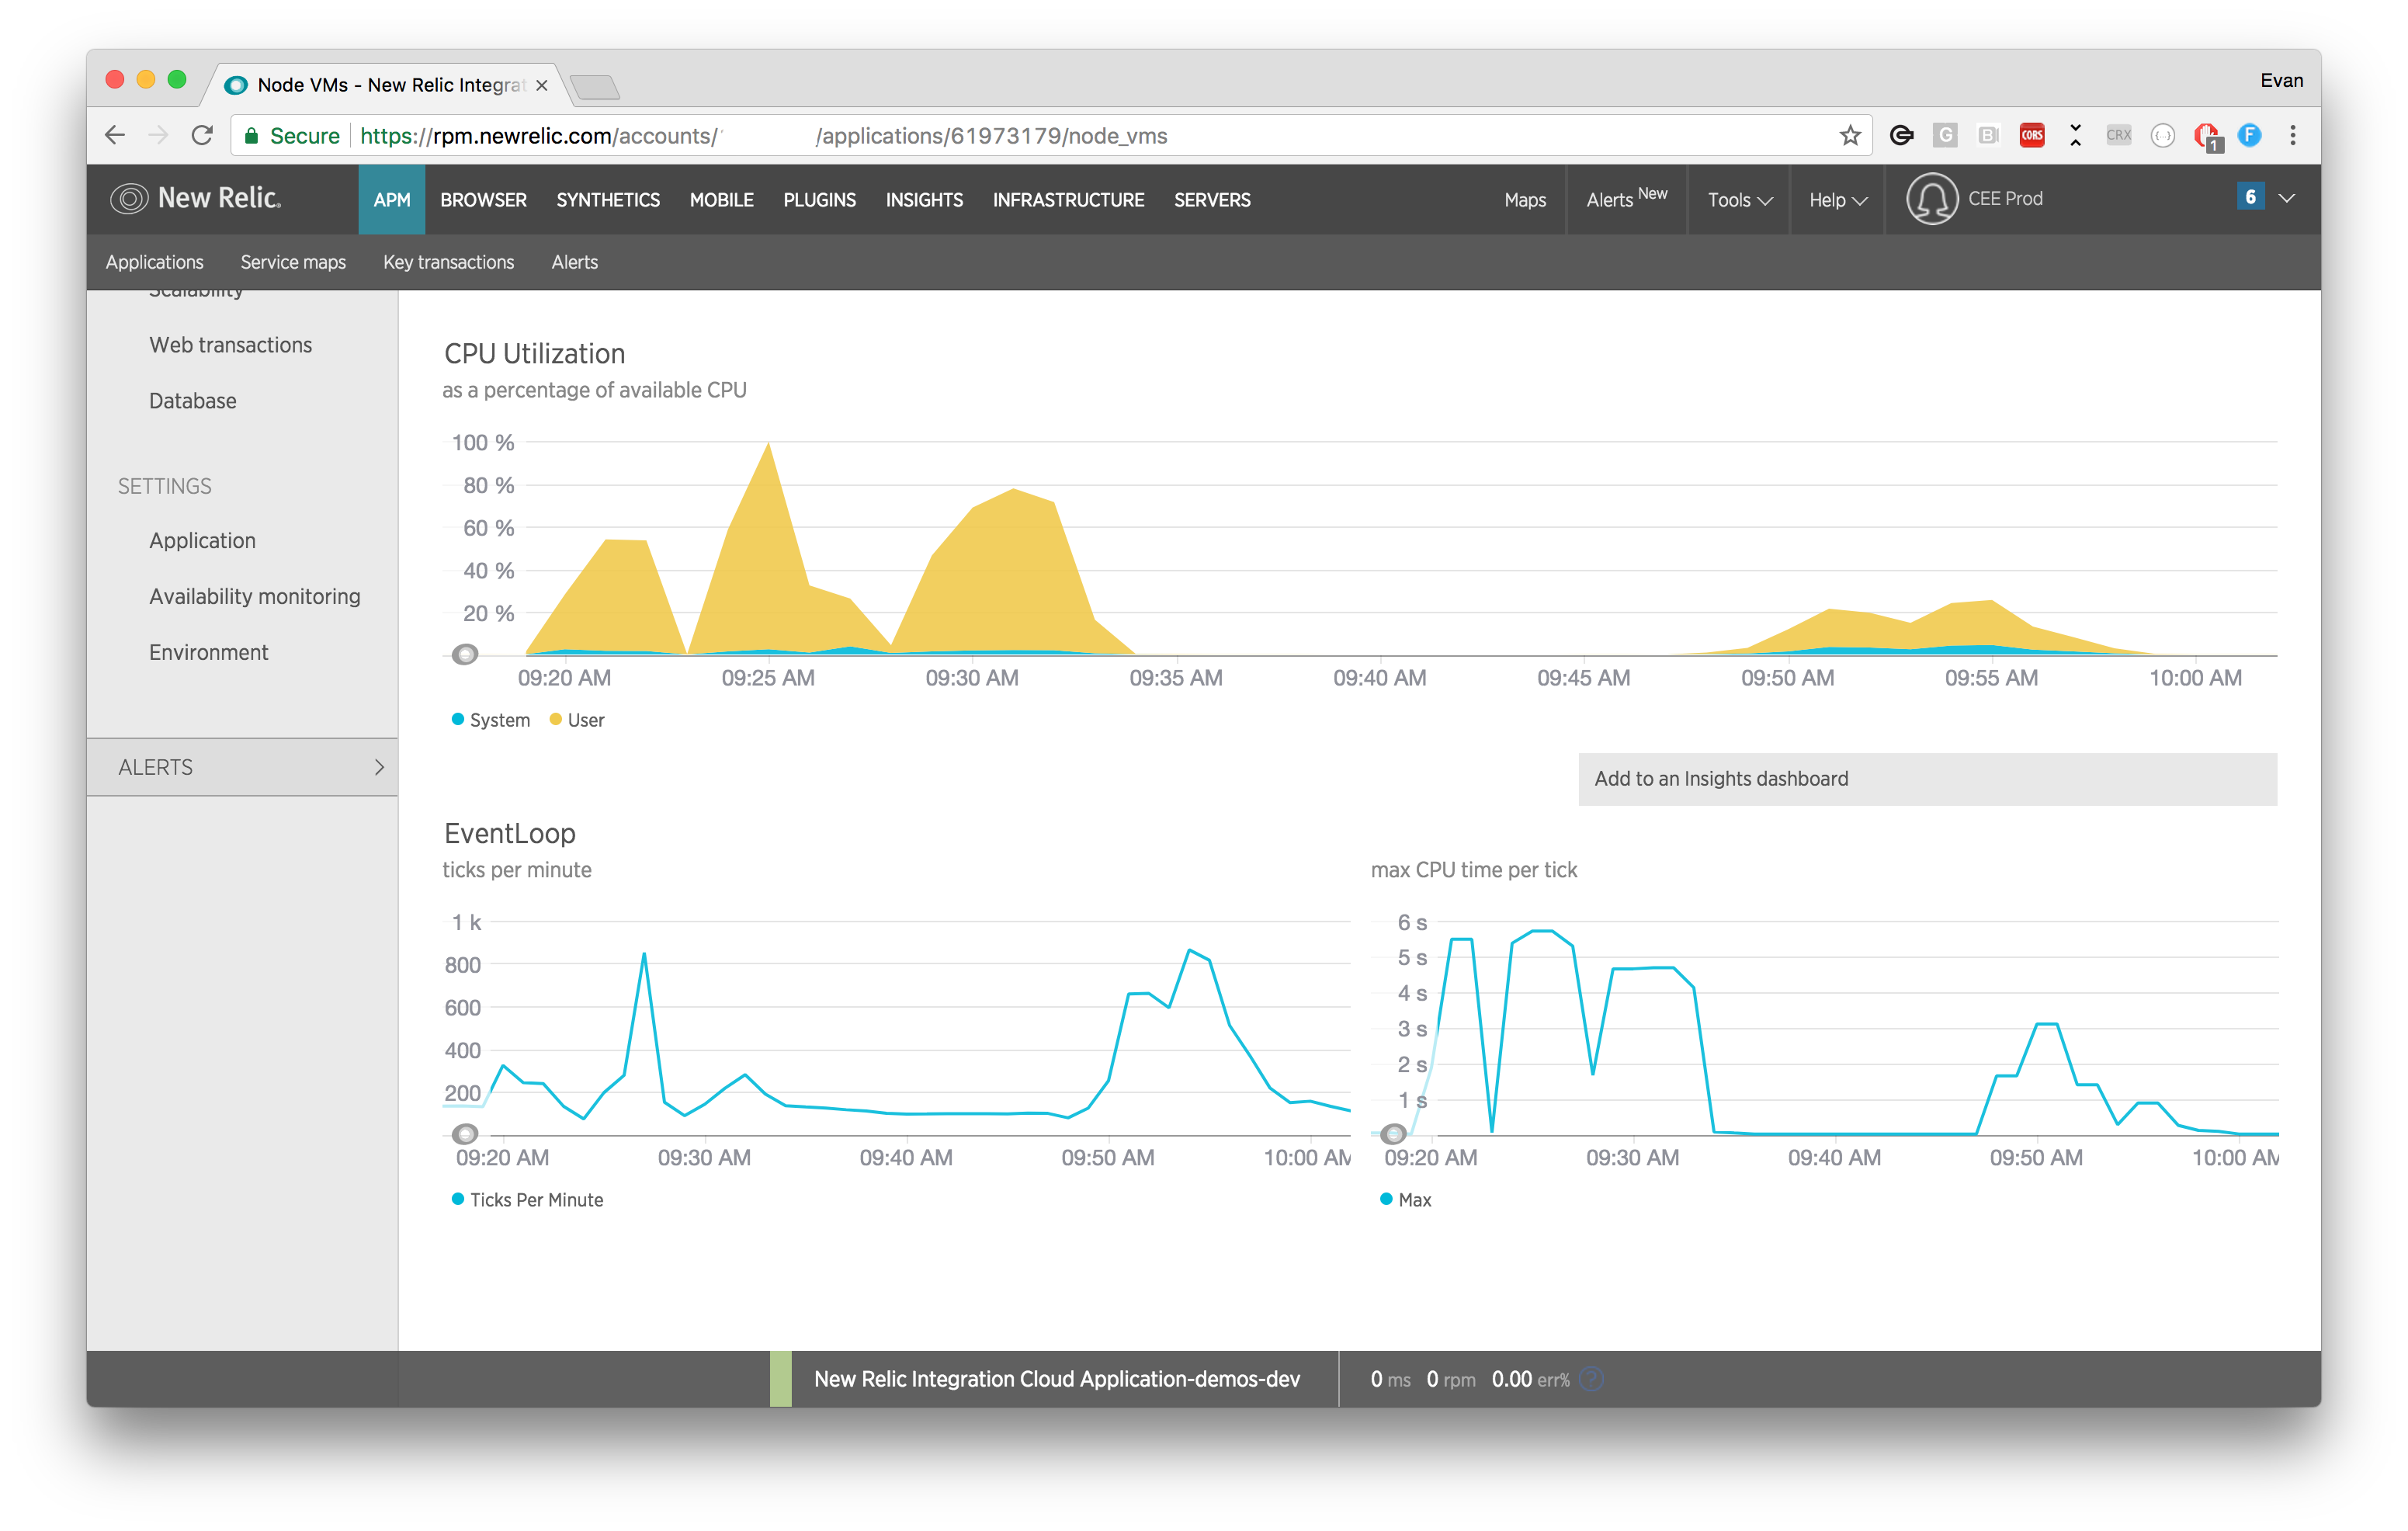
Initially, we see high CPU (yellow peaks) utilization on the left. After our modifications, it is significantly lower (right).
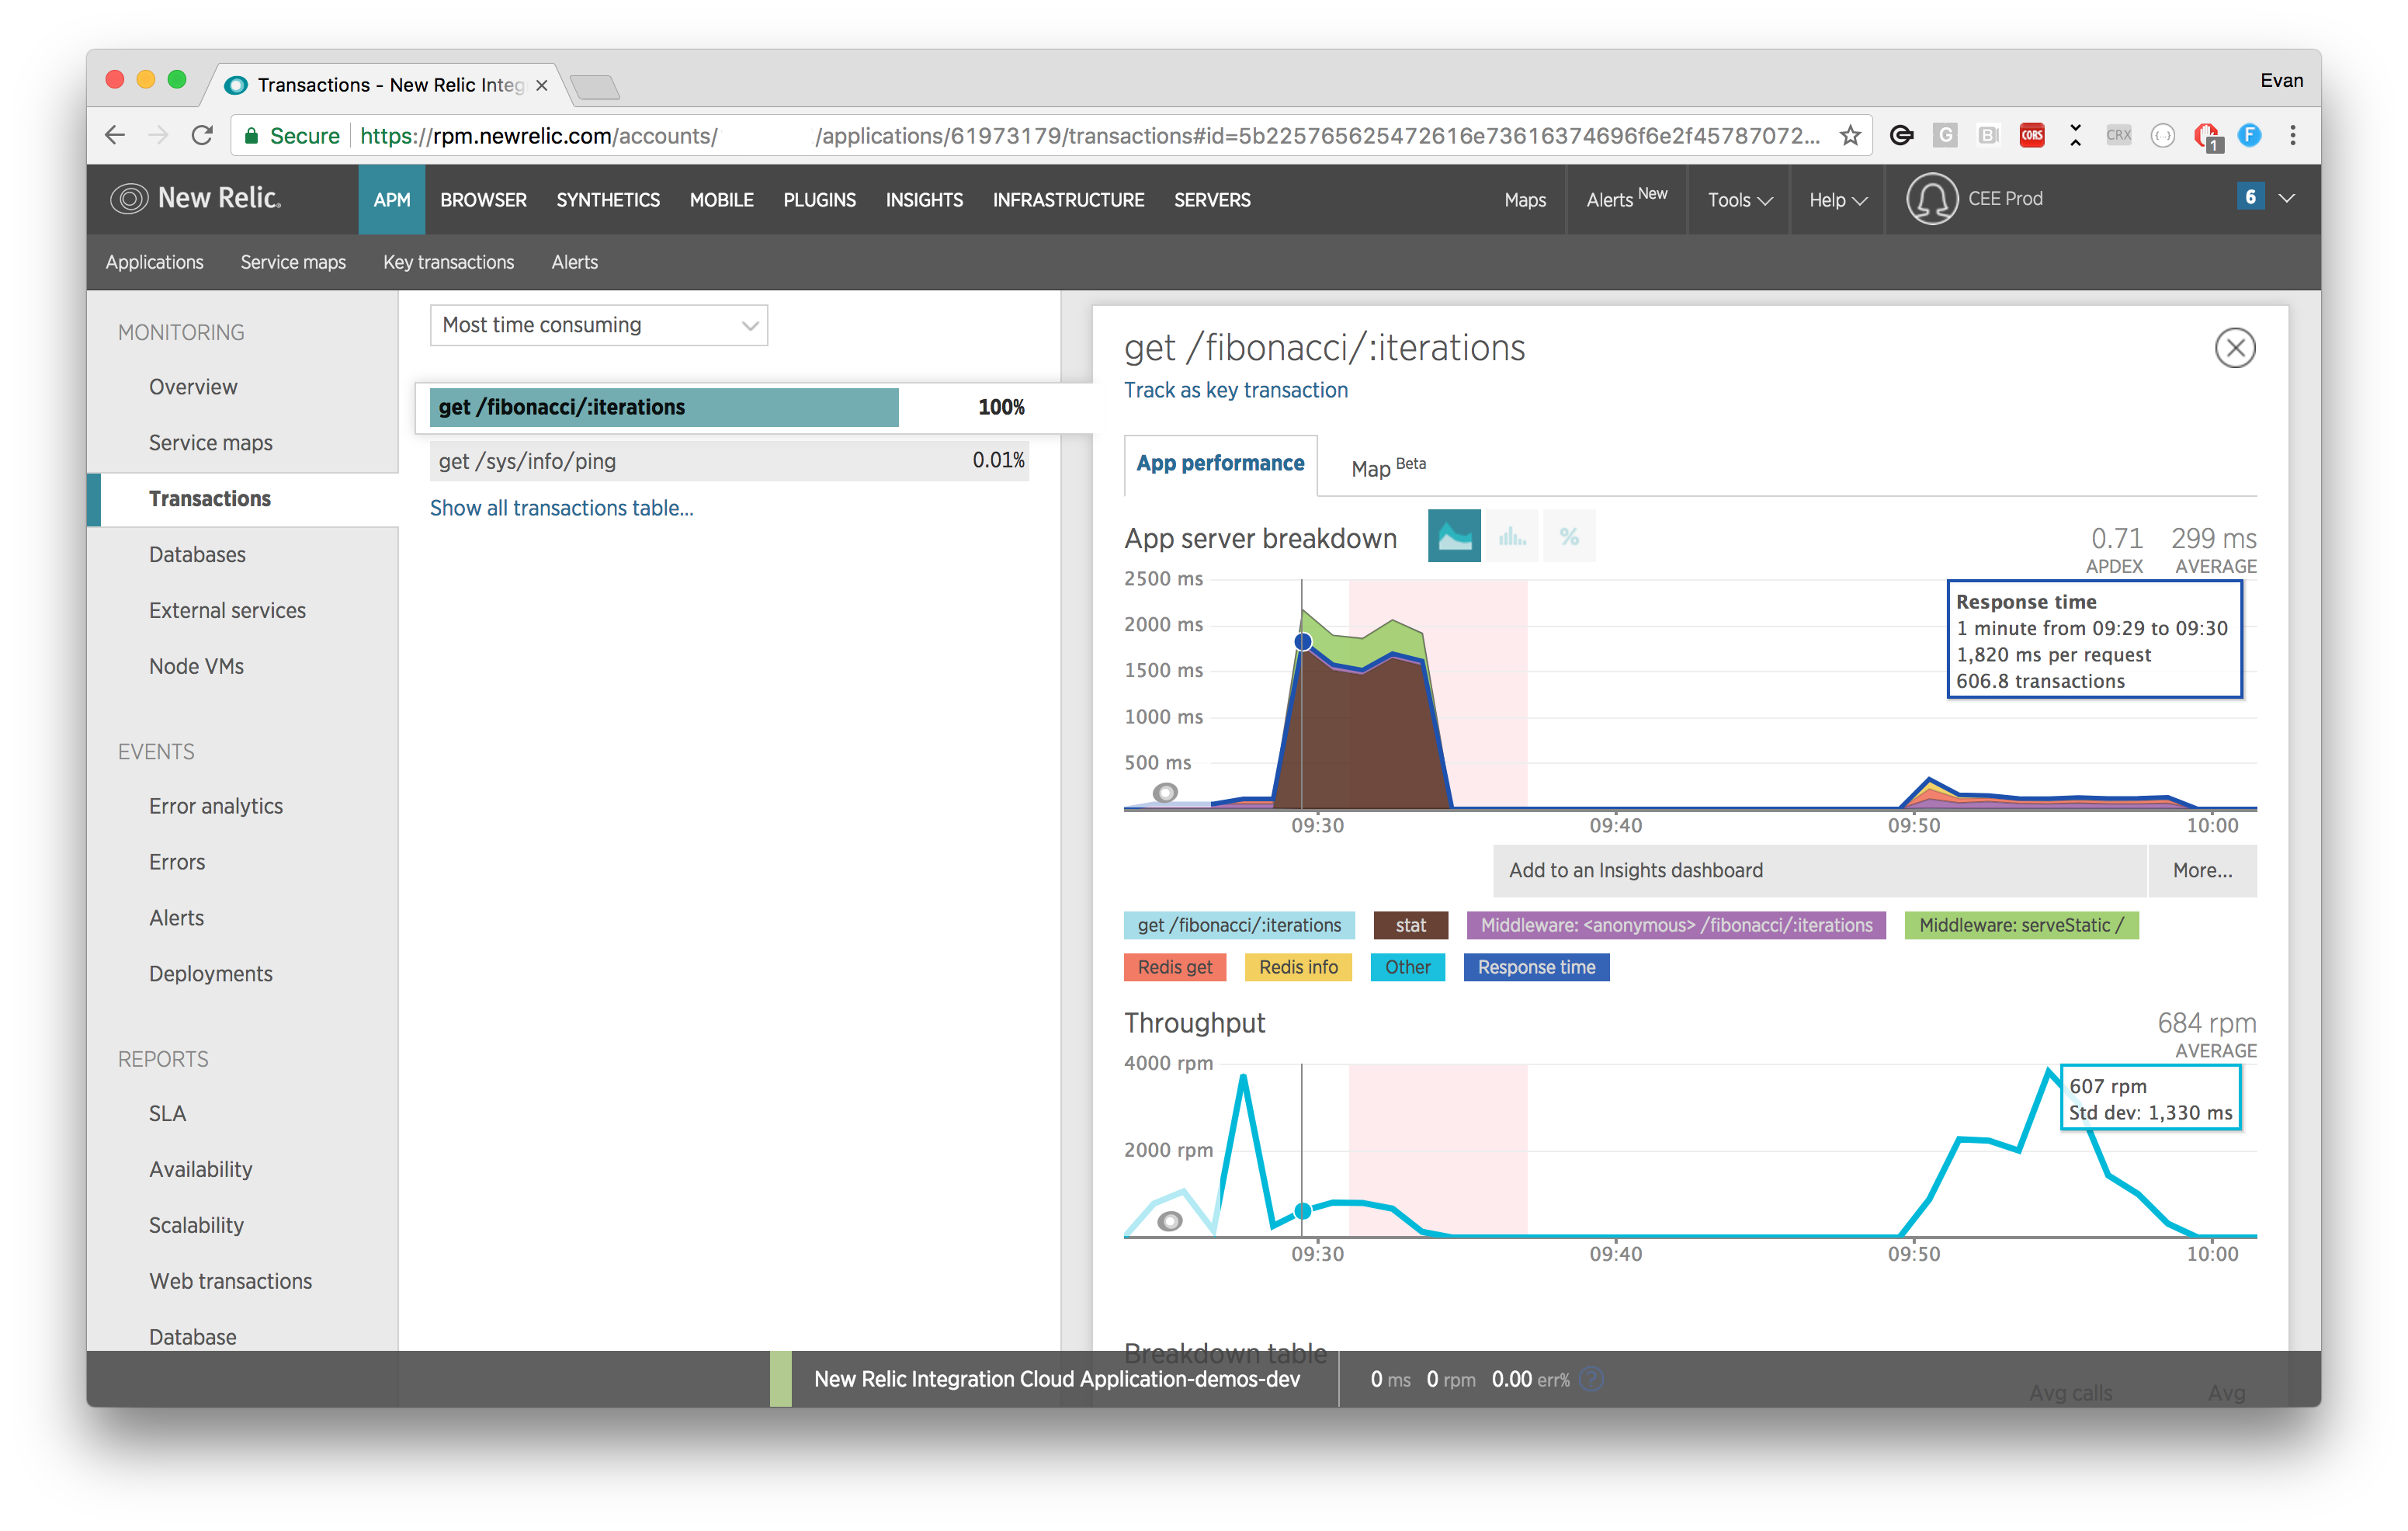
Our initial response times are consistently over 1500ms. After we add caching and remove the call to express.static they are consistently around 100ms.
Based on these graphs it's clear that we have two issues:
- High CPU utilization is clear in the first.
- The stat and serveStatic functions (green and brown peaks in the second image) are significant contributors to overall response time.
The first of these issues are related to the method used to compute these numbers. Computation of the numbers is done in what's known as a "blocking" fashion in the Node.js ecosystem - this means that our Node.js server's event loop is blocked while the sequence is being computed in the JavaScript code of our application. Put simply, this means that the server can't process any other requests while computing a Fibonacci number. If you're familiar with Node.js you'll know that CPU intensive tasks like this should be performed by a child process or more suitable service to ensure the Node.js event loop can continue processing requests and scheduling I/O - the stuff it's designed for! Any time spent blocking in this fashion will be notable due to degraded response times, which are not good for mobile applications that demand high-quality user experiences.
We could cluster our application across multiple cores to ease this issue, or use memoization, but let's use the Red Hat Mobile Application Platform caching abilities to improve the throughput of our Cloud Application. In a real world application, you can use caching to reduce the calls being made to enterprise systems in a similar fashion.
We'll start by replacing the existing /Fibonacci endpoint code with the code below. This code will cache computed numbers so that the next requests will not require the expensive computation to be triggered again for 60 seconds. Subsequent requests will retrieve the cached result asynchronously to significantly increase our throughput.
function getFibonacciEntry (iterations, callback) {
  mbaasApi.cache({
    act: 'load',
    key:`fibonacci-${iterations}`
  }, callback)
}

function setFibonacciEntry (fibonacciResult) {
  mbaasApi.cache({
   act: 'save',
   key:`fibonacci-${fibonacciResult.iterations}`,
   expire: 60,
   value: JSON.stringify(fibonacciResult)
  }, (err) => {
   if (err) {
     console.error(err, 'failed to store entry in cache');
   } else {
     console.log(`stored ${fibonacciResult.iterations} in cache`)
   }
  });
}

app.get('/fibonacci/:iterations', (req, res, next) => {
  getFibonacciEntry(req.params.iterations, onCacheFetched);

  function onCacheFetched (err, data) {
   if (err) {
     // an error occurred - pass it to the error handler
     next(err);
   } else if (data) {
     // we had cached data - return it!
     res.set('content-type', 'application/json');
     res.end(data);
   } else {
     // no entry found in cache - generate the response then store it
     const result = fibonacci.iterate(req.params.iterations);
     setFibonacciEntry(result);
     res.json(result);
   }
  }
});
Now that we've resolved the CPU utilization we can focus on time spent in functions that are not necessary to serve this request. Based on the graphs, we can determine that our Node.js application is spending time performing stat and serveStatic functions. It's highly likely that this points to the express.static middleware that we've included in our application. Since our application doesn't need this middleware, we could simply remove it, or alternatively if you need to use the express.static middleware we could alter our stack so that the lines are ordered in preference, or it only applies for specific endpoints, e.g. public/:
app.get('/fibonacci/:iterations', handlerFunc)

// By placing the static middleware after our routes a
// disk read won't be executed for each incoming request
// unless it reaches this point. We also only execute this
// middleware if the incoming route starts with "/public"
app.use('/public', express.static(__dirname + '/public'));
This article provides a concise explanation of the express middleware pattern, but the main takeaway is that you should ensure requests are not passed through unnecessary middleware functions since it increases resource utilization and response times for your application as a result.
After we deploy these two changes, we achieve a 5.5 fold increase to approximately 180 requests per second in this development environment. If we take a look at the New Relic graphs after caching is enabled it's clear that CPU utilization is much lower which means our application has plenty of resources available to do its job and serve multiple requests concurrently thanks to the event loop no longer being blocked.
Red Hat Mobile Application Platform is available for download, and you can read more at Red Hat Mobile Application Platform.
Last updated: February 23, 2024