Using Linux Perf Tools
The Performance Analysis Tool for Linux (perf) is a powerful tool to profile applications. It works by using a mix of hardware counters (is fast) and software counters, all provided by the Linux Performance Counter (LPC) subsystem that takes charge of the complex task of wrapping the CPU counters for the different type of CPUs. So you can have access to a very efficient way to get information of running processes through their C API or a convenient command in this case (perf).
This command gives you access to a great variety of system and process level events but in this entry, I will use it to investigate CPU bounded issues.
Getting Started
First, you need to install perf tools using your favorite package manager:
#install perf in Archlinux
sudo pacman -Sy perf

#install perf in Fedora
sudo dnf install perf
As a part of this tutorial we are going to use a sample NodeJS server application which I wrote and push in Github, the directory for this example is /cpu_bound, there you can find the following files:
- This is a basic ExpressJS web service, with two basic services /fib and /fast more on those later.
- Is a bash script to run some rudimentary concurrent network request, this will generate some traffic for our service.
If you want to execute these scripts, you need the following Linux 4.0+ and NodeJS 4.3+.
Benchmark
Once you have this file and have installed the dependencies you need to install the dependencies with npm install, after that we can proceed to run that will execute the following steps:test.sh
- Run the Node server.application.js
- Execute 150 curl concurrent requests against the two services (you can decrease this amount if it's too slow).
- Wait for the request to be complete, and then exit node process "gracefully".
Executing
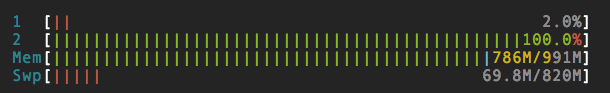
Using a VM with one core and 500 MB of ram, it takes me 83 seconds to handle 150 requests, not spectacular, so let's see what we can do to make it faster. So first thing is while running the example CPU went to 100%, and we are dealing with a single threaded framework (NodeJS), which means that if this application blocks the main thread, we are blocking our dispatch/receive capabilities as well, so how do we start?
Assume nothing. —when you care about performance, do your best to improve the code and then measure the improvement. If you don’t measure performance, you’re just guessing, and if you’re guessing, you’re not very likely to write top-notch code.
Michael Abrash
Run-time Information
So following this advice from one of the x86 assembly prophets, we should start by informing our selves first, to do that we going to make use of the perf command tool. First, we need to tell V8 compiler we want to generate profiling information so to integrate both we just need to pass this flag --perf-basic-prof.
Now we can re-run our script again, V8 will start logging profiling events into /tmp/perf-. Once our program is running we should execute perf record, and attach it to the process we want to profile, in this case 'pgrep -n node', but before this I will recommend that you pick a folder to save perf.data as the command save the file in the same folder where you make the call.
perf record -F 99 -p `pgrep -n node`

# Example:
# F is the sampling frequency in hertz.
# p is the process ID (PID).
# Example: pgrep -n node >> 1801 << returning the PID of a process called node.
Also, for convenience, I wrote this script to execute the recording and remove legacy perf.data; you can use it to test multiple combinations of arguments.
Report
After passing enough time enough to test profile our app, we should detach by doing Ctrl-C, then in our folder, we should see a new file perf.data. This binary contains the profile information, to examine the information we need to run perf report; this command will pick perf.data and will show us a call tree that includes JavaScript and native (C/C++) functions.
It will look something like this:
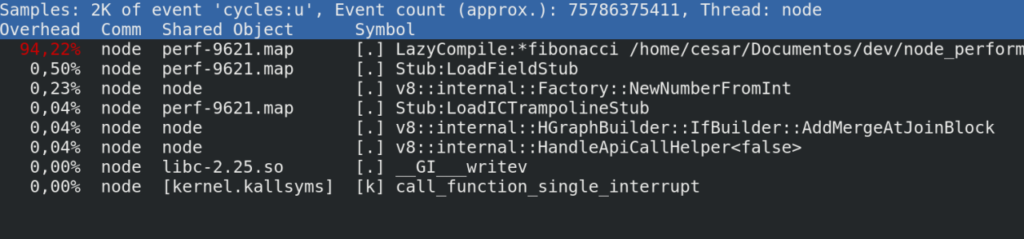
Some quick explanation:
- Overhead: shows the time spent by the CPU.
- Command: The process, in this case, is a node.
- Shared Object: shows the ELF (Executable Linux Format) or where this instruction comes from, in our case the V8 API send the probing logs to a temporary location in /tmp/perf-5671, perf takes this file and assembles a call tree.
- Symbol: This has two components, the first is the privilege where [.] means user level and [k] kernel level call.
Looking for bottlenecks
Here is where the fun start, with a quick look we can spot the CPU hungry call, so let's explain a bit how to read this line in a NodeJS::V8 context.

- LazyCompile Is an event generated by the V8 compiler, meaning that your function is being compiled and optimized on-demand.
- Asterisk* This is good news meaning that your code was successfully compiled to native code (fast) if you see a tilde (~) that means your code is being interpreted (slow).
- Path & Line This tells file and line.
Now that we have our suspect we can jump to the code, in application.js:9, you will find that the /fib is just a simple Fibonacci random generator and is doing its calculation using a naïve recursion algorithm, now we can start planning our optimization plan, which I will leave this as an exercise for the reader ;).
JavaScript Is My Bottleneck
One of the myths I hear from many is that JavaScript is slow and is not their fault, so here is my 5- cent's to try to demystify this:
- x86 Linux link
- x86 Windows VM link
- H.264 Codec link source code
Wrapping Up
In our example, it was easy to spot the performance problem, but I think the real value in the case you need to profile huge projects, so it can create an understandable CPU utilization map, that will simplify the process of finding the inefficient spots. Other advantages are that you can use this with other programming languages so you can have the same amount of information and, as I mention earlier thanks to the architecture of LPC the impact is minimal as some of the work is done at the hardware level.
Here are some useful links:
- Perf Command Documentation.
- How to use it from the command line.
- Perf Technical Documentation.
- Great documentation explaining the inner workings.
- Flame Graphs
- Very useful to analyze the run-time behavior of an application.
- V8 Compiler
- Nice talk of Franziska Hinkelmann about the V8 compiler optimization techniques.
If you know the basic commands of Linux then download the Advanced Linux Commands Cheat Sheet, this cheat sheet can help you take your skills to the next level.
Last updated: May 31, 2024