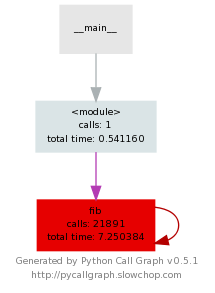
For RHEL6 and newer distributions tools are available to profile Python code and to generate dynamic call graphs of a program's execution. Flat profiles can be obtained with the cProfile module and dynamic callgraphs can be obtained with pycallgraph.
The cProfile Python module records information about each of the python methods run. For older versions of Python that do not include the cProfile module you can use the higher overhead profile module. Profiling is fairly simple with the cProfile module.
Below is an example profiling a simple Fibanocci number program implemented in Python. After the Python program exits the cProfile module print a list of the functions executed. Each entry includes the number of times the function was called (ncalls), the total time the method consumes excluding children (tottime), and the time for the function and the functions it calls (cumtime). cProfile also computes average times for tottime and cumtime in the percall columns to gauge the cost of a single execution of a function.
By default cProfile sorts the output based on function name, but in this example below the -s cumulative option causes the output to be sorted by cumulative execution time (cumtime). The fib.py:3() invokes fib.py:3(fib). Thus, fib.py:3() has a larger cumulative time and is placed earlier on the output than fib.py:3(fib) because it calls the other functions either directly or indirectly. Looking at the functions at the top of this list give an indication which functions are taking the most time. For more information about cProfile refer to the Python manual.
$ python -m cProfile -s cumulative fib.py
6765
         21895 function calls (5 primitive calls) in 0.007 CPU seconds

   Ordered by: cumulative time

   ncalls  tottime  percall  cumtime  percall filename:lineno(function)
        1    0.000    0.000    0.007    0.007 :1()
        1    0.000    0.000    0.007    0.007 {execfile}
        1    0.000    0.000    0.007    0.007 fib.py:3()
  21891/1    0.007    0.000    0.007    0.007 fib.py:3(fib)
        1    0.000    0.000    0.000    0.000 {method 'disable' of '_lsprof.Profiler' objects}
The Extra Packages for Enterprise Linux (EPEL) includes the python-pycallgraph package, which contains the pycallgraph program. You can use the pycallgraph program to generate callgraphs of Python programs. Below is an example invocation for a simple Fibonacci number program, fib.py. The --image-format=svg is used to generate scalable vector graphic (SVG) image that can be examined using web browsers such as Firefox. The --output-file=~/fib_callgraph.svg writes the output to a file once the Python program exits. The resulting SVG file, fib.py_callgraph.svg, shows the recursive fib function calling itself many time at the bottom of the graph.
$ pycallgraph --image-format=svg --output-file=~/fib_callgraph.svg -- ./fib.py Python Call Graph v0.5.1 Starting trace 6765 Creating ~/fib_callgraph.svg Done!Last updated: August 9, 2018

