My previous articles set the stage for a powerful distributed system. We started by exploring how Red Hat OpenShift Service Mesh 3 creates a unified, secure microservices platform in our first guide, Unlocking the power of OpenShift Service Mesh 3. We then advanced, discovering how to go beyond the single cluster with OpenShift Service Mesh 3 by building a geographically distributed, multicluster topology.
Your infrastructure is live, complete with secure cross-cluster gateways and flawless service discovery, but connectivity is only the beginning. The real operational challenge in a highly distributed environment is not just connecting services; it's seeing and understanding the millions of transactions that flow between them. This is where Kiali steps in. While my previous articles focused entirely on the architecture and build, this guide is your practical manual for gaining deep visibility. You will learn how to use Kiali to monitor real-time traffic flows, quickly diagnose network issues, and confirm optimal service performance across your entire distributed application network.
The observability gap in multicluster deployments
Scaling a service mesh from one cluster to many doesn't just add complexity, it multiplies the blind spots. Traditional single-cluster monitoring tools simply cannot cope with a distributed application spanning multiple regions, cloud providers, or network environments.
What happens when you try to manage this kind of mesh without unified observability?
- Fragmented visibility: Troubleshooting becomes a nightmare. You’re forced to log into countless cluster UIs, manually stitching together fragmented metrics and logs to diagnose a single failing request.
- Time-consuming troubleshooting: Tracking a critical transaction as it crosses cluster boundaries and gateways turns simple debugging into a massive, time-consuming detective hunt.
- Metric inconsistency: Incompatible monitoring configurations across clusters make it nearly impossible to establish reliable performance baselines or make consistent comparisons across your entire application portfolio.
- Security gaps: Cross-cluster communication paths introduce critical new security vectors. Monitoring the integrity of policy and mTLS across these boundaries is essential and difficult to manage manually.
Kiali is the answer to these challenges. It provides a single management console over your entire multicluster service mesh, providing the centralized clarity needed to manage and control your distributed application network.
Achieving operational clarity across the mesh
Kiali elevates your multicluster service mesh from a collection of isolated, complex nodes into a fully transparent and manageable system. By establishing itself as the centralized intelligence layer, Kiali delivers the deep, unified visibility essential for mastering highly distributed operations. This is how Kiali empowers your team to gain control and clarity over multicluster topologies.
Seamless fleet mapping
Kiali generates a cohesive, real-time network diagram that visualizes the complete application topology. This view extends across every cluster boundary, allowing you to instantly observe service relationships, dependency chains, and active communication paths. You gain immediate insight into cross-cluster transactions, such as traffic flowing from your East cluster to your West cluster, complete with current performance and health status.
Unified performance metrics
Move beyond cluster-specific monitoring. Kiali leverages a unified telemetry store to aggregate the data and present multicluster visualizations. This capability enables precise analysis of inter-cluster traffic, offering immediate visibility into key indicators like request latency, throughput, and error rates for calls that transit your entire network.
End-to-end request tracking
Leveraging integration with distributed tracing platforms, such as Tempo, Kiali allows you to track the entire life cycle of an individual request. You can visualize the exact path, duration, and dependencies of a transaction as it passes through multiple services hosted on different clusters, which pinpoints any point of failure or performance degradation.
Policy and security assurance
Instantly verify the integrity of your security posture across the entire fleet. Kiali visually represents the application of your authorization policies and mTLS status at every cluster boundary, guaranteeing that your critical multicluster communications are consistently protected and compliant with mesh rules.
Configuration governance
Maintain consistency and significantly reduce operational risk. Kiali’s centralized validation engine performs fleet-wide configuration auditing of Istio resources, allowing you to proactively spot and correct inconsistencies or misconfigurations across all your connected clusters from a single management console.
Prerequisites
Before proceeding with this guide, please ensure you have completed the architectural setup from the previous article.
The following components must be in place:
- Two Red Hat OpenShift Container Platform clusters (East and West) running OpenShift Service Mesh 3, and configured in a multi-primary, multi-network architecture (as detailed in the previous article).
- The test applications
hello-worldandsleepare deployed in thesamplenamespace on both clusters, with sidecars injected. - You have a user with a cluster-admin role.
For the initial setup, we will define cluster contexts and install Kiali.
First, install the Kiali operator as follows:
- In the OpenShift console, navigate to Operators > OperatorHub.
- Enter
Kialiinto the filter box to find the Kiali operator provided by Red Hat. - Once you find the Kiali operator, install it with the "stable" Update Channel, leaving the rest of the default settings.
Next, set the cluster context by logging into your clusters and set the context environment variables:
oc login -u https://<east_cluster_api_server_url>
export CTX_CLUSTER1=$(oc config current-context)
oc login -u https://<west_cluster_api_server_url>
export CTX_CLUSTER2=$(oc config current-context)
Step 1: Configure OpenShift monitoring and Istio telemetry
This step ensures that the OpenShift User Workload Monitoring stack is enabled and that Istio is configured to expose its metrics so Kiali can access them via the centralized Thanos Querier.
Enable user workload monitoring on the East cluster:
cat <<EOF | oc --context "${CTX_CLUSTER1}" apply -f - apiVersion: v1 kind: ConfigMap metadata: name: cluster-monitoring-config namespace: openshift-monitoring data: config.yaml: | enableUserWorkload: true EOF- Apply the same configuration for the West cluster by using
${CTX_CLUSTER2}. Apply an Istio telemetry custom resource to ensure Istio's metrics are explicitly routed to Prometheus.
cat <<EOF | oc --context "${CTX_CLUSTER1}" apply -f - apiVersion: telemetry.istio.io/v1 kind: Telemetry metadata: name: enable-prometheus-metrics namespace: istio-system spec: metrics: - providers: - name: prometheus- Apply the same configuration for the West cluster by using
${CTX_CLUSTER2}. Create a
ServiceMonitorfor the East cluster to scrape metrics from Istiod. Ensure thereplacementvalue formesh_idmatches your mesh configuration.cat <<EOF | oc --context "${CTX_CLUSTER1}" apply -f - apiVersion: monitoring.coreos.com/v1 kind: ServiceMonitor metadata: name: istiod-monitor namespace: istio-system spec: targetLabels: - app selector: matchLabels: istio: pilot endpoints: - port: http-monitoring path: /metrics interval: 30s relabelings: - action: replace replacement: "mesh1" targetLabel: mesh_id EOFApply the same configuration for the West cluster by using
${CTX_CLUSTER2}.You must create a
PodMonitorresource to collect metrics from the Istio sidecars for every namespace that contains services you want to be monitored in your mesh. This example covers thesamplenamespace and theistio-systemnamespace. Ensure thereplacementvalue formesh_idmatches your mesh configuration.Create a
PodMonitorfor the East cluster in thesamplenamespace:cat <<EOF | oc --context "${CTX_CLUSTER1}" apply -f - apiVersion: monitoring.coreos.com/v1 kind: PodMonitor metadata: name: istio-proxies-monitor namespace: sample spec: selector: matchExpressions: - key: istio-prometheus-ignore operator: DoesNotExist podMetricsEndpoints: - path: /stats/prometheus interval: 30s relabelings: - action: keep sourceLabels: [__meta_kubernetes_pod_container_name] regex: "istio-proxy" - action: keep sourceLabels: [__meta_kubernetes_pod_annotationpresent_prometheus_io_scrape] - action: replace regex: (\\d+);(([A-Fa-f0-9]{1,4}::?){1,7}[A-Fa-f0-9]{1,4}) replacement: '[\$2]:\$1' sourceLabels: [__meta_kubernetes_pod_annotation_prometheus_io_port, __meta_kubernetes_pod_ip] targetLabel: __address__ - action: replace regex: (\\d+);((([0-9]+?)(\.|$)){4}) replacement: \$2:\$1 sourceLabels: [__meta_kubernetes_pod_annotation_prometheus_io_port, __meta_kubernetes_pod_ip] targetLabel: __address__ - sourceLabels: ["__meta_kubernetes_pod_label_app_kubernetes_io_name", "__meta_kubernetes_pod_label_app"] separator: ";" targetLabel: "app" action: replace regex: "(.+);.*|.*;(.+)" replacement: \${1}\${2} - sourceLabels: ["__meta_kubernetes_pod_label_app_kubernetes_io_version", "__meta_kubernetes_pod_label_version"] separator: ";" targetLabel: "version" action: replace regex: "(.+);.*|.*;(.+)" replacement: \${1}\${2} - sourceLabels: [__meta_kubernetes_namespace] action: replace targetLabel: namespace - action: replace replacement: "mesh1" targetLabel: mesh_id EOF- Apply the same configuration for the West cluster by using
${CTX_CLUSTER2}. Create a
PodMonitorfor the East cluster in theistio-systemnamespace:cat <<EOF | oc --context "${CTX_CLUSTER1}" apply -f - apiVersion: monitoring.coreos.com/v1 kind: PodMonitor metadata: name: istio-proxies-monitor namespace: sample spec: selector: matchExpressions: - key: istio-prometheus-ignore operator: DoesNotExist podMetricsEndpoints: - path: /stats/prometheus interval: 30s relabelings: - action: keep sourceLabels: [__meta_kubernetes_pod_container_name] regex: "istio-proxy" - action: keep sourceLabels: [__meta_kubernetes_pod_annotationpresent_prometheus_io_scrape] - action: replace regex: (\\d+);(([A-Fa-f0-9]{1,4}::?){1,7}[A-Fa-f0-9]{1,4}) replacement: '[\$2]:\$1' sourceLabels: [__meta_kubernetes_pod_annotation_prometheus_io_port, __meta_kubernetes_pod_ip] targetLabel: __address__ - action: replace regex: (\\d+);((([0-9]+?)(\.|$)){4}) replacement: \$2:\$1 sourceLabels: [__meta_kubernetes_pod_annotation_prometheus_io_port, __meta_kubernetes_pod_ip] targetLabel: __address__ - sourceLabels: ["__meta_kubernetes_pod_label_app_kubernetes_io_name", "__meta_kubernetes_pod_label_app"] separator: ";" targetLabel: "app" action: replace regex: "(.+);.*|.*;(.+)" replacement: \${1}\${2} - sourceLabels: ["__meta_kubernetes_pod_label_app_kubernetes_io_version", "__meta_kubernetes_pod_label_version"] separator: ";" targetLabel: "version" action: replace regex: "(.+);.*|.*;(.+)" replacement: \${1}\${2} - sourceLabels: [__meta_kubernetes_namespace] action: replace targetLabel: namespace - action: replace replacement: "mesh1" targetLabel: mesh_id EOF- Apply the same configuration for the West cluster by using
${CTX_CLUSTER2}. - In the OpenShift console, navigate to Observe > Metrics and run the query
istio_requests_total. If the metrics are being collected correctly, you will see results for this query.
Step 2: Configure Kiali for multicluster access
This process involves installing the full Kiali server on the East cluster and deploying only the necessary remote access resources on the West cluster. In this demonstration, we’ll be configuring Kiali to be fully integrated only with the East cluster's Prometheus. This means the visualization is limited to the East cluster's immediate perspective.
You will still see traffic from the East cluster that directly sends traffic over to the West cluster, but you will not see internal traffic that stays entirely within the West cluster. This is because those metrics are local to the West cluster and aren't being pulled into the East cluster's view in this specific configuration. This view is sufficient for our current use case because our goal is to verify that the East cluster can successfully contact and route traffic to the West cluster, which we will still be able to see.
For a true end-to-end visualization where all internal traffic from both clusters is visible simultaneously, a fully unified metric store is required. This could be implemented manually by using federated Thanos components across the mesh clusters to pull data into a central Querier, or automatically by using Red Hat Advanced Cluster Management for Kubernetes, which automatically aggregates all managed cluster metrics into a centralized, persistent Thanos store.
Install the Kiali server on the East cluster:
cat <<EOF | oc --context "${CTX_CLUSTER1}" apply -f -
apiVersion: kiali.io/v1alpha1
kind: Kiali
metadata:
  name: kiali
  namespace: istio-system
spec:
  version: default
  external_services:
    prometheus:
      auth:
        type: bearer
        use_kiali_token: true
      thanos_proxy:
        enabled: true
      url: https://thanos-querier.openshift-monitoring.svc.cluster.local:9091
EOF
Ensure that Kiali is ready by running the following command:
oc wait --context ${CTX_CLUSTER1} --for=condition=Successful kialis/kiali -n istio-system --timeout=3mRetrieve your Kiali route hostname.
oc --context $CTX_CLUSTER1 get route kiali -n istio-system -o jsonpath='{.spec.host}'Create a Kiali instance on the West cluster. By specifying
remote_cluster_resources_only: true, the necessary service accounts and roles are configured without deploying an actual Kiali server.cat <<EOF | oc --context "${CTX_CLUSTER2}" apply -f - apiVersion: kiali.io/v1alpha1 kind: Kiali metadata: name: kiali namespace: istio-system spec: version: default auth: openshift: redirect_uris: # Replace kiali-route-hostname with the hostname from the previous step. - "https://{kiali-route-hostname}/api/auth/callback/cluster2" deployment: remote_cluster_resources_only: true EOFEnsure that the Kiali CR is ready by running the following command:
oc wait --context cluster2 --for=condition=Successful kialis/kiali -n istio-system --timeout=3m
Step 3: Establish secure remote access
This step creates a secure kubeconfig secret on the East cluster, allowing the central Kiali server to authenticate and pull live data from the West cluster's API server.
Create a long lived API token bound to the
kiali-service-accountin the West cluster. Kiali uses this token to authenticate to the West cluster.cat <<EOF | oc --context "${CTX_CLUSTER2}" apply -f - apiVersion: v1 kind: Secret metadata: name: "kiali-service-account" namespace: "istio-system" annotations: kubernetes.io/service-account.name: "kiali-service-account" type: kubernetes.io/service-account-token EOFCreate a kubeconfig file and save it as a secret in the namespace on the East cluster where the Kiali deployment resides. To simplify this process, use the
kiali-prepare-remote-cluster.shscript to generate the kubeconfig file by running the followingcurlcommand:curl -L -o kiali-prepare-remote-cluster.sh https://raw.githubusercontent.com/kiali/kiali/master/hack/istio/multicluster/kiali-prepare-remote-cluster.shModify the script to make it executable by running the following command:
chmod +x kiali-prepare-remote-cluster.shExecute the script to create the secret on the East cluster:
./kiali-prepare-remote-cluster.sh --kiali-cluster-context ${CTX_CLUSTER1} --remote-cluster-context ${CTX_CLUSTER2} --view-only false --kiali-resource-name kiali-service-account --remote-cluster-namespace istio-system --process-kiali-secret true --process-remote-resources false --remote-cluster-name cluster2Trigger the reconciliation loop so that the Kiali operator registers the remote secret that the CR contains by running the following command:
oc --context ${CTX_CLUSTER1} rollout status deployment/kiali -n istio-systemWait for the Kiali resource to become ready by running the following command:
oc --context ${CTX_CLUSTER1} wait --for=condition=Successful --timeout=2m kialis/kiali -n istio-systemWait for the Kiali server to become ready by running the following command:
oc --context ${CTX_CLUSTER1} rollout status deployments/kiali -n istio-system
Step 4: Verify multicluster observability
This final step confirms that Kiali can successfully connect to the West cluster, authenticate, and display a unified view of the entire mesh.
Access Kiali and log in to the East cluster
Retrieve the hostname for your Kiali instance:
oc --context ${CTX_CLUSTER1} get route kiali -n istio-system -o jsonpath='{.spec.host}'- Navigate to the Kiali URL in your browser:
https://<your-kiali-route-hostname> - Log in using your East cluster credentials.
Access Kiali and log in to the West cluster
To see other clusters in the Kiali UI, you must log in as a user to those clusters through Kiali.
- Click on the user profile drop-down in the top-right menu.
- Select Login to
cluster2. You are redirected to an OpenShift login page and prompted for credentials for the West cluster. - Now log in using your West cluster credentials.
Verify that Kiali shows information from both clusters
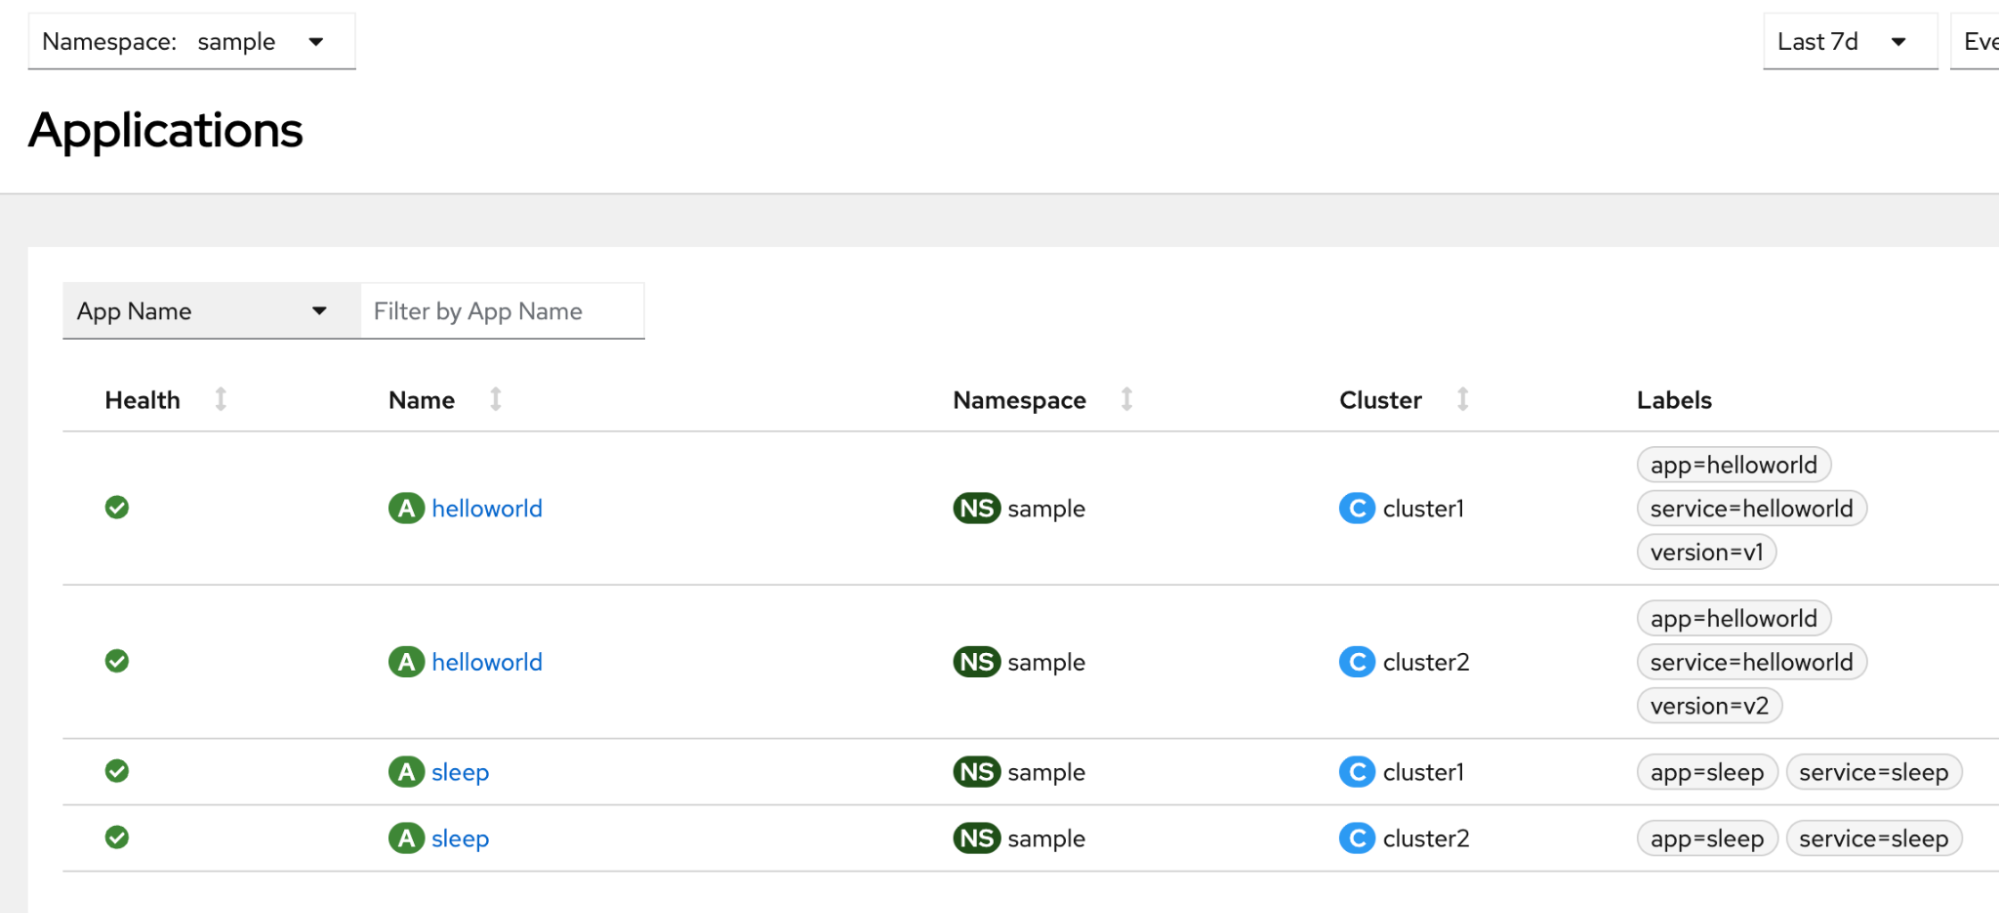
Click Overview and verify that you can see namespaces from both clusters. In our example, when looking at the Application tab under the
samplenamespace you should see (Figure 1):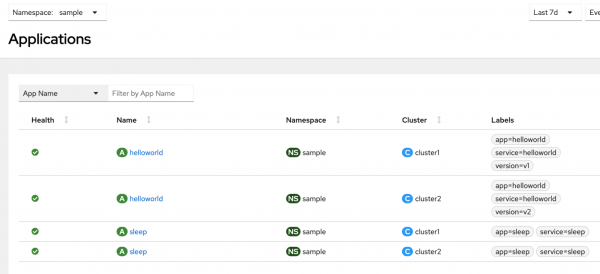
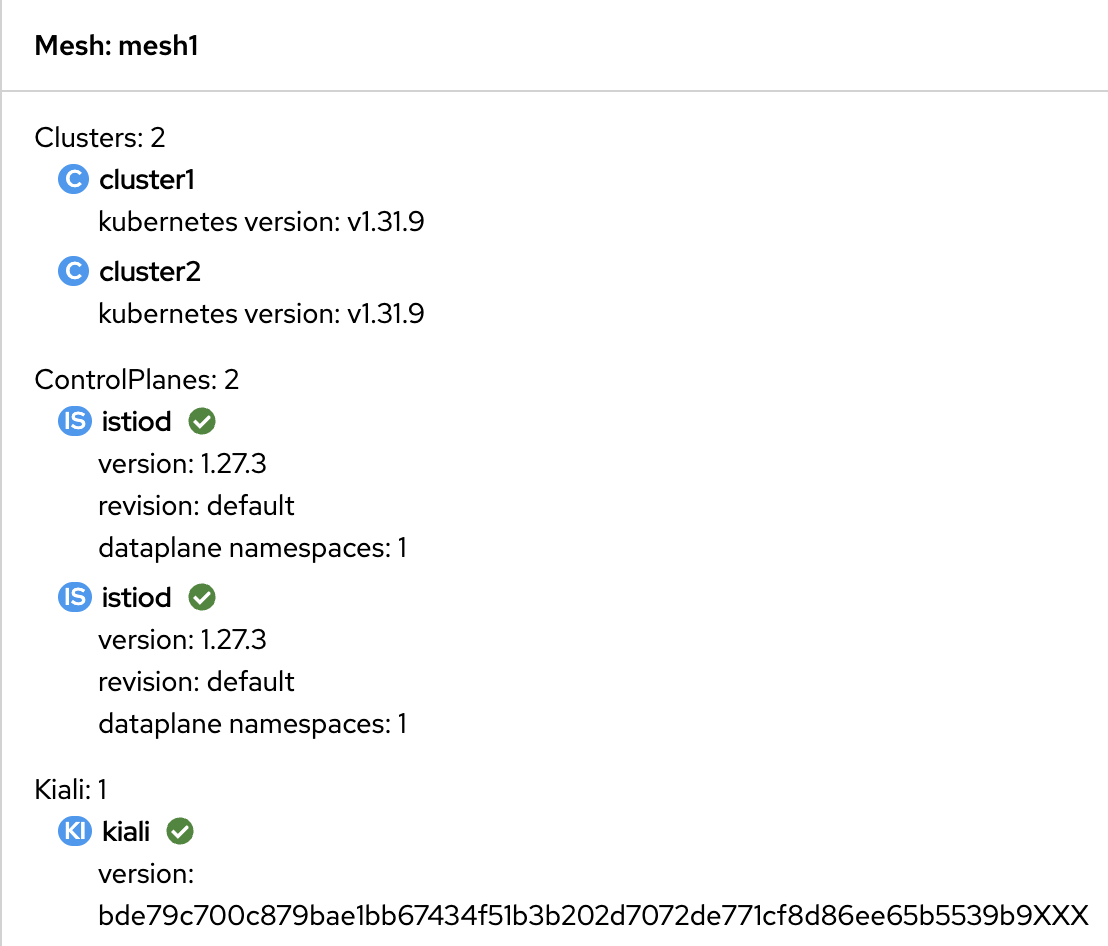
Figure 1: The Applications tab in the Kiali console demonstrates a multicluster mesh. Click the Mesh tab and verify that you see both clusters on the mesh graph (Figure 2).

Figure 2: The Mesh tab in the Kiali console demonstrates a multicluster mesh. You should also be able to see a traffic graph showing services, applications and workloads from both clusters. For example, in the following image we can see the
sleepapplication from the West cluster sending traffic to thehelloworldapplication in the East cluster (Figure 3).
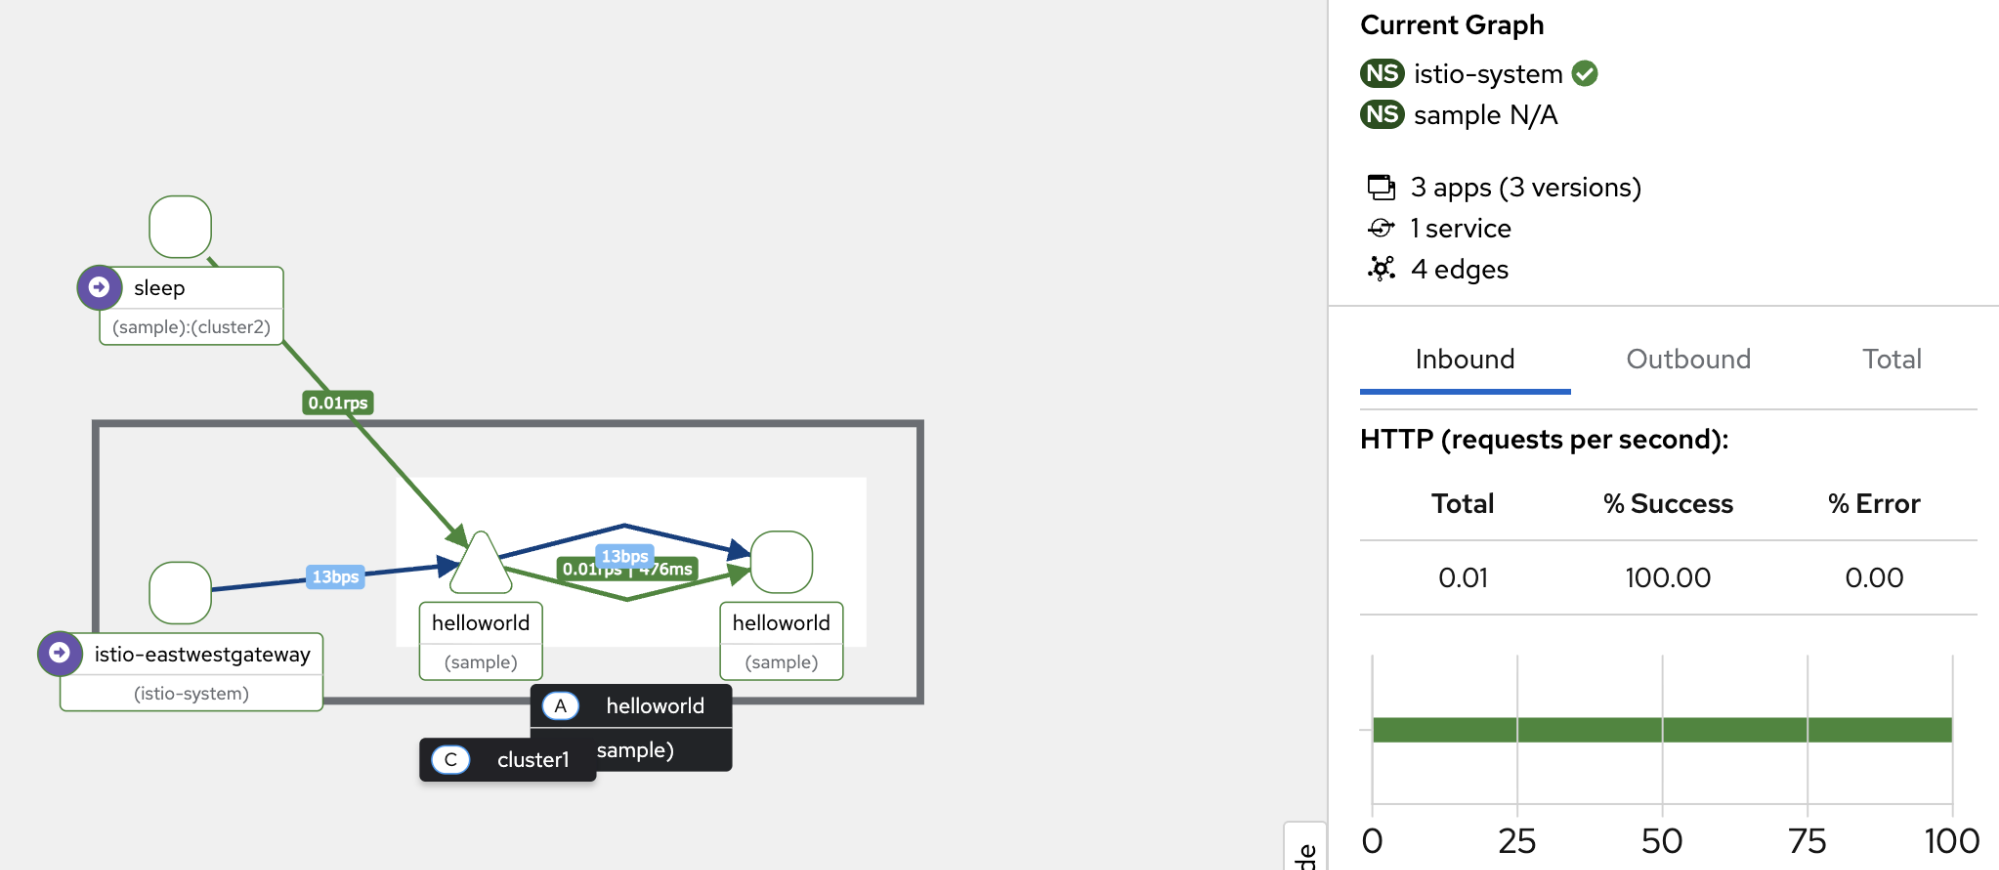
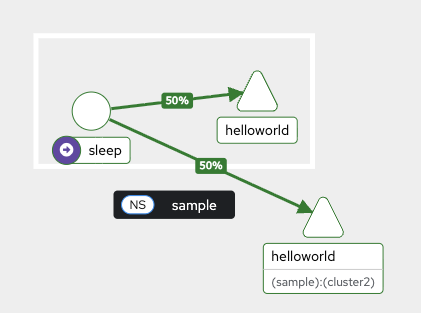
The following image of the service graph (Figure 4) demonstrates the percentage of traffic being actively routed between the East and West clusters:
Operational mastery achieved
With the final configuration complete, you have successfully transformed your two independent OpenShift clusters into a unified, observable service mesh. This guide provided the crucial steps to move beyond simple connectivity. We ensured the OpenShift User Workload Monitoring stack was enabled on both clusters and configured Istio to expose its control plane and data plane metrics to this centralized stack. Then we strategically deployed the Kiali server on your primary cluster while preparing the remote cluster for access. Finally, we enabled Kiali to aggregate data from the remote cluster by creating a dedicated service account token and using a utility script to package the necessary authentication details into a kubeconfig secret.
The result is a transparent, real-time view of traffic, performance, and security across the entire globally distributed application, granting you true operational clarity over your multicluster deployment.
Last updated: January 23, 2026