In our previous article, we tackled the challenge of integrating the Red Hat OpenShift Gateway API with Red Hat OpenShift Service Mesh by establishing a unified Certificate Authority. Now that traffic flows seamlessly between the gateway and your mesh workloads, how do you observe it all?
This follow-up guide demonstrates how to configure Kiali to monitor the OpenShift Gateway API components (in openshift-ingress) and your service mesh workloads—giving you a single pane of glass for your entire ingress-to-service traffic flow.
Install the Kiali operator
Before installing the Kiali operator, there are a few things you need to do.
Prerequisites:
- Complete the gateway API and service mesh integration setup.
- Bookinfo application deployed and accessible via Gateway API.
- An existing Prometheus endpoint (OpenShift’s platform monitoring via
thanos-querieror user workload monitoring).
Install the Kiali operator from the Red Hat catalog as follows:
cat <<EOF | oc apply -f -
apiVersion: operators.coreos.com/v1alpha1
kind: Subscription
metadata:
  name: kiali
  namespace: openshift-operators
spec:
  channel: stable
  installPlanApproval: Automatic
  name: kiali
  source: redhat-operators
  sourceNamespace: openshift-marketplace
EOF
Wait for the operator to be ready and ensure the operator is installed.oc get csv -n openshift-operators | grep kiali
Understanding the challenge
When you deploy Kiali to monitor your service mesh, specifically in a complex setup like this dual-mesh scenario, it encounters two primary limitations that impact its ability to provide comprehensive and unified observability.
The first limitation is namespace discovery. Kiali's traditional architecture and data sources are fundamentally tied to a single underlying mesh implementation (e.g., Istio or Linkerd). In a dual-mesh scenario, where two distinct service mesh technologies or two separate instances of the same mesh are operating concurrently within the same environment or across federated clusters, Kiali typically only offers visibility into the service topology, traffic metrics, and health of the services governed by one of those meshes. It lacks the built-in capability to natively aggregate, correlate, and visualize data from both meshes simultaneously.
This results in a fragmented view of the overall application health, requiring operators to switch context between different Kiali instances or external dashboards, thus hindering the ability to troubleshoot end-to-end service interactions that span both mesh environments.
In a nutshell, Kiali only discovers namespaces that match your Istio mesh’s discoverySelectors by default. The openshift-ingress namespace where the Gateway API runs isn’t part of your mesh, so Kiali won’t see it.
The second limitation is GatewayClass validation. The introduction of advanced networking paradigms, such as those facilitated by the OpenShift Gateway API (which may be used to manage ingress and cross-mesh traffic), often introduces blind spots for Kiali. While Kiali excels at interpreting data plane protocols and configurations managed by the service mesh control plane (like VirtualServices or DestinationRules), the Gateway API operates at a different layer and uses distinct resources (like Gateways and HTTPRoutes). If the Gateway API is used to manage traffic entering or between the dual meshes, Kiali's default instrumentation and metric scraping often fail to fully account for the traffic paths and policies defined by these non-mesh-native resources.
This limitation means that critical components of the data path—specifically the ingress and cross-mesh routing logic—are not fully represented in Kiali's service graphs or health dashboards, leading to an incomplete picture of network flow and potential difficulties in diagnosing issues related to edge routing or mesh federation.
Kiali validates Gateway API resources against known GatewayClasses. Since OpenShift’s gateway controller (not your Istio) manages openshift-default, Kiali will flag it as unknown with a KIA1504 validation error:
Gateway API Class not found in configurationBoth issues have simple solutions through Kiali’s configuration.
Configuring Kiali for dual-mesh visibility
Discovery selectors use OR logic for namespaces. Kiali’s discovery_selectors uses OR logic between array items. We can include namespaces that match your mesh label (istio-discovery: default) or are explicitly named (openshift-ingress).
deployment:
  discovery_selectors:
    default:
      # Match namespaces in your Istio mesh
      - matchLabels:
          istio-discovery: default
      # OR match openshift-ingress by name
      - matchExpressions:
          - key: kubernetes.io/metadata.name
            operator: In
            values:
              - openshift-ingress
Gateway API classes: Registering OpenShift’s GatewayClass
Tell Kiali about all valid GatewayClasses in your environment, including openshift-default.
external_services:
  istio:
    gateway_api_classes:
      - name: Istio
        class_name: istio
      - name: OpenShift Default
        class_name: openshift-default
This eliminates the KIA1504 validation error for gateway resources using openshift-default.
The complete Kiali CR brings it all together.
cat <<EOF | oc apply -f -
apiVersion: kiali.io/v1alpha1
kind: Kiali
metadata:
  name: kiali
  namespace: istio-system
spec:
  deployment:
    cluster_wide_access: true
    discovery_selectors:
      default:
        # Namespaces in the Istio mesh
        - matchLabels:
            istio-discovery: default
        # OpenShift Gateway API namespace
        - matchExpressions:
            - key: kubernetes.io/metadata.name
              operator: In
              values:
                - openshift-ingress

  external_services:
    grafana:
      enabled: false

    prometheus:
      auth:
        type: bearer
        use_kiali_token: true
      thanos_proxy:
        enabled: true
      url: https://thanos-querier.openshift-monitoring.svc.cluster.local:9091

    tracing:
      enabled: false

    istio:
      gateway_api_classes:
        - name: Istio
          class_name: istio
        - name: OpenShift Default
          class_name: openshift-default

  server:
    write_timeout: 60
EOF
Wait for Kiali to be ready. Check the Kiali pods and wait for the deployment as follows:
## Check Kiali pod is running
oc get pods -n istio-system -l app=kiali

## Wait for the deployment
oc rollout status deployment/kiali -n istio-system
Enable the Prometheus metrics collection
For Kiali to display traffic metrics, Prometheus must scrape metrics from both the Istio control plane and the Envoy sidecars.
This requires deploying the ServiceMonitor and PodMonitor resources in both namespaces:
- istio-system: Monitors istiod and mesh workload proxies.
- openshift-ingress: Monitors the Gateway API proxy sidecars.
Deploy the ServiceMonitor for istiod in istio-system.
cat <<EOF | oc apply -f -
apiVersion: monitoring.coreos.com/v1
kind: ServiceMonitor
metadata:
  name: istiod-monitor
  namespace: istio-system
spec:
  targetLabels:
  - app
  selector:
    matchLabels:
      istio: pilot
  endpoints:
  - port: http-monitoring
    interval: 30s
EOF
Deploy the PodMonitor for Envoy proxies in istio-system:
cat <<EOF | oc apply -f -
apiVersion: monitoring.coreos.com/v1
kind: PodMonitor
metadata:
  name: istio-proxies-monitor
  namespace: istio-system
spec:
  selector:
    matchExpressions:
    - key: istio-prometheus-ignore
      operator: DoesNotExist
  podMetricsEndpoints:
  - path: /stats/prometheus
    interval: 30s
    relabelings:
    - action: keep
      sourceLabels: ["__meta_kubernetes_pod_container_name"]
      regex: "istio-proxy"
    - action: keep
      sourceLabels: ["__meta_kubernetes_pod_annotationpresent_prometheus_io_scrape"]
    - action: replace
      regex: (\d+);(([A-Fa-f0-9]{1,4}::?){1,7}[A-Fa-f0-9]{1,4})
      replacement: '[\$2]:\$1'
      sourceLabels: ["__meta_kubernetes_pod_annotation_prometheus_io_port","__meta_kubernetes_pod_ip"]
      targetLabel: "__address__"
    - action: replace
      regex: (\d+);((([0-9]+?)(\.|$)){4})
      replacement: '\$2:\$1'
      sourceLabels: ["__meta_kubernetes_pod_annotation_prometheus_io_port","__meta_kubernetes_pod_ip"]
      targetLabel: "__address__"
    - sourceLabels: ["__meta_kubernetes_pod_label_app_kubernetes_io_name","__meta_kubernetes_pod_label_app"]
      separator: ";"
      targetLabel: "app"
      action: replace
      regex: "(.+);.*|.*;(.+)"
      replacement: "\${1}\${2}"
    - sourceLabels: ["__meta_kubernetes_pod_label_app_kubernetes_io_version","__meta_kubernetes_pod_label_version"]
      separator: ";"
      targetLabel: "version"
      action: replace
      regex: "(.+);.*|.*;(.+)"
      replacement: "\${1}\${2}"
    - sourceLabels: ["__meta_kubernetes_namespace"]
      action: replace
      targetLabel: namespace
    - action: replace
      replacement: "default"
      targetLabel: mesh_id
EOF
Deploy the ServiceMonitor for istiod in openshift-ingress:
cat <<EOF | oc apply -f -
apiVersion: monitoring.coreos.com/v1
kind: ServiceMonitor
metadata:
  name: istiod-monitor
  namespace: openshift-ingress
spec:
  targetLabels:
  - app
  selector:
    matchLabels:
      istio: istiod
  endpoints:
  - port: http-monitoring
    interval: 30s
EOF
Deploy the same PodMonitor in openshift-ingress to collect the gateway proxy metrics:
cat <<EOF | oc apply -f -
apiVersion: monitoring.coreos.com/v1
kind: PodMonitor
metadata:
  name: istio-proxies-monitor
  namespace: openshift-ingress
spec:
  selector:
    matchExpressions:
    - key: istio-prometheus-ignore
      operator: DoesNotExist
  podMetricsEndpoints:
  - path: /stats/prometheus
    interval: 30s
    relabelings:
    - action: keep
      sourceLabels: ["__meta_kubernetes_pod_container_name"]
      regex: "istio-proxy"
    - action: keep
      sourceLabels: ["__meta_kubernetes_pod_annotationpresent_prometheus_io_scrape"]
    - action: replace
      regex: (\d+);(([A-Fa-f0-9]{1,4}::?){1,7}[A-Fa-f0-9]{1,4})
      replacement: '[\$2]:\$1'
      sourceLabels: ["__meta_kubernetes_pod_annotation_prometheus_io_port","__meta_kubernetes_pod_ip"]
      targetLabel: "__address__"
    - action: replace
      regex: (\d+);((([0-9]+?)(\.|$)){4})
      replacement: '\$2:\$1'
      sourceLabels: ["__meta_kubernetes_pod_annotation_prometheus_io_port","__meta_kubernetes_pod_ip"]
      targetLabel: "__address__"
    - sourceLabels: ["__meta_kubernetes_pod_label_app_kubernetes_io_name","__meta_kubernetes_pod_label_app"]
      separator: ";"
      targetLabel: "app"
      action: replace
      regex: "(.+);.*|.*;(.+)"
      replacement: "\${1}\${2}"
    - sourceLabels: ["__meta_kubernetes_pod_label_app_kubernetes_io_version","__meta_kubernetes_pod_label_version"]
      separator: ";"
      targetLabel: "version"
      action: replace
      regex: "(.+);.*|.*;(.+)"
      replacement: "\${1}\${2}"
    - sourceLabels: ["__meta_kubernetes_namespace"]
      action: replace
      targetLabel: namespace
    - action: replace
      replacement: "default"
      targetLabel: mesh_id
EOF
Verify the monitors
Now we will confirm the monitors exist in both namespaces by checking the ServiceMonitor and PodMonitor in istio-system as well as the PodMonitor in openshift-ingress.
## Check ServiceMonitor and PodMonitor in istio-system
oc get servicemonitor,podmonitor -n istio-system

## Check PodMonitor in openshift-ingress
oc get podmonitor -n openshift-ingress
Access the Kiali console for verification (Figure ).
Get the Kiali route:
oc get route kiali -n istio-system -o jsonpath='https://{.spec.host}'Open the URL in your browser. You’ll authenticate with your cluster credentials on OpenShift.
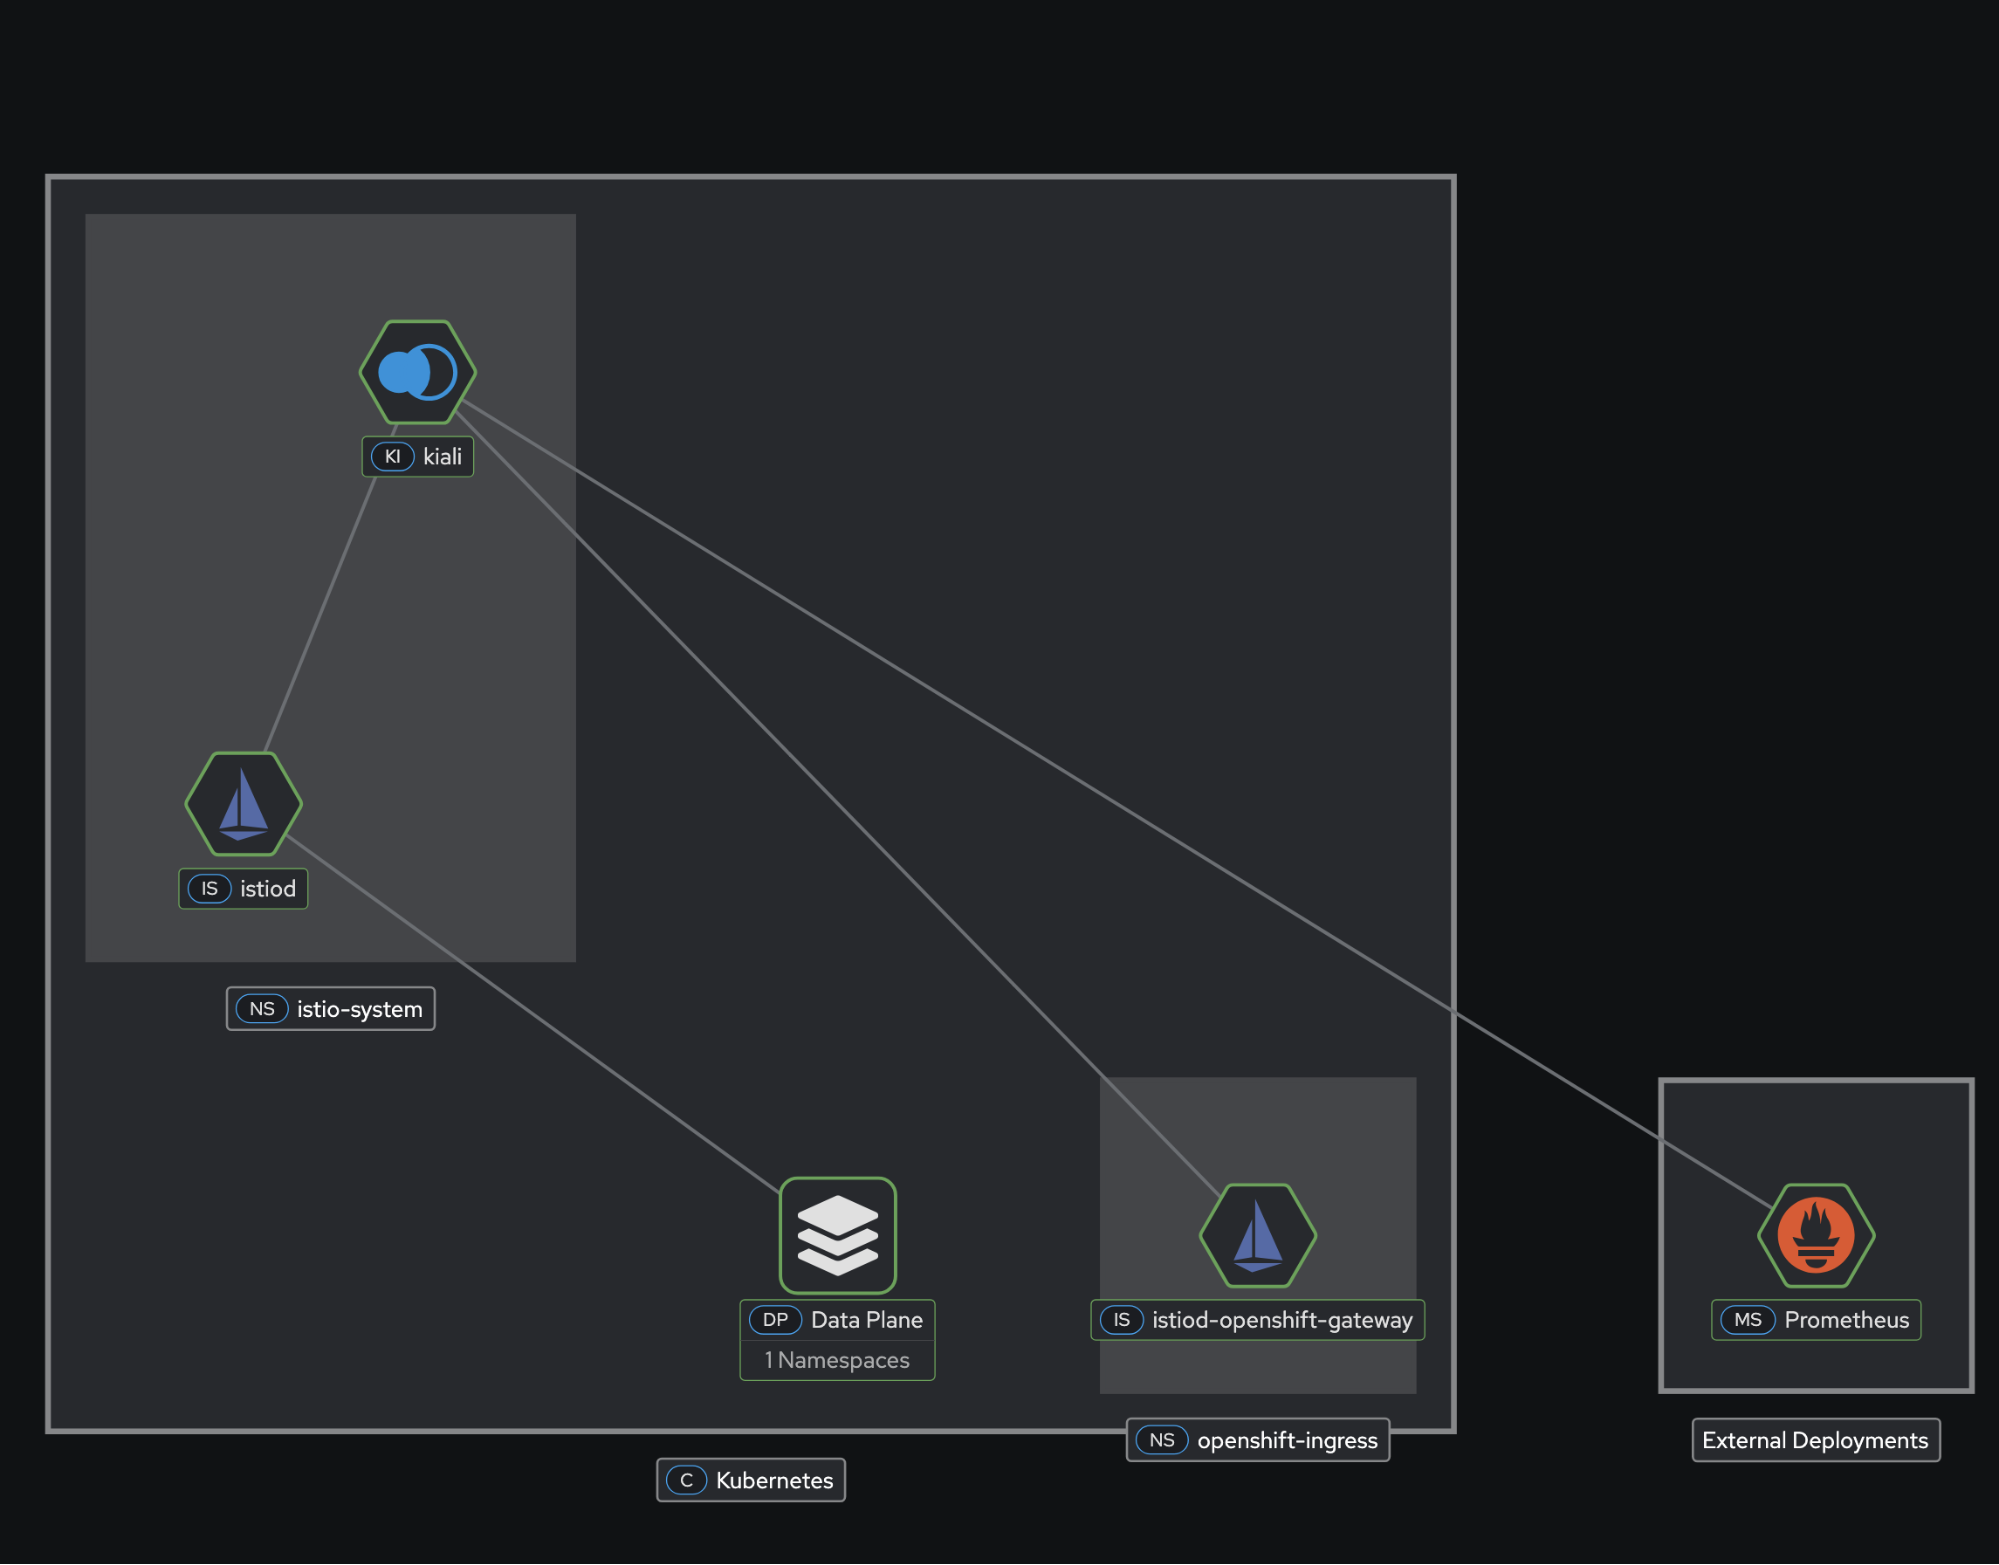
Verify the namespace discovery
In the Kiali UI:
- Navigate to the Graph view.
- In the namespace dropdown, confirm you see both the bookinfo (your mesh workloads) and openshift-ingress (Gateway API).
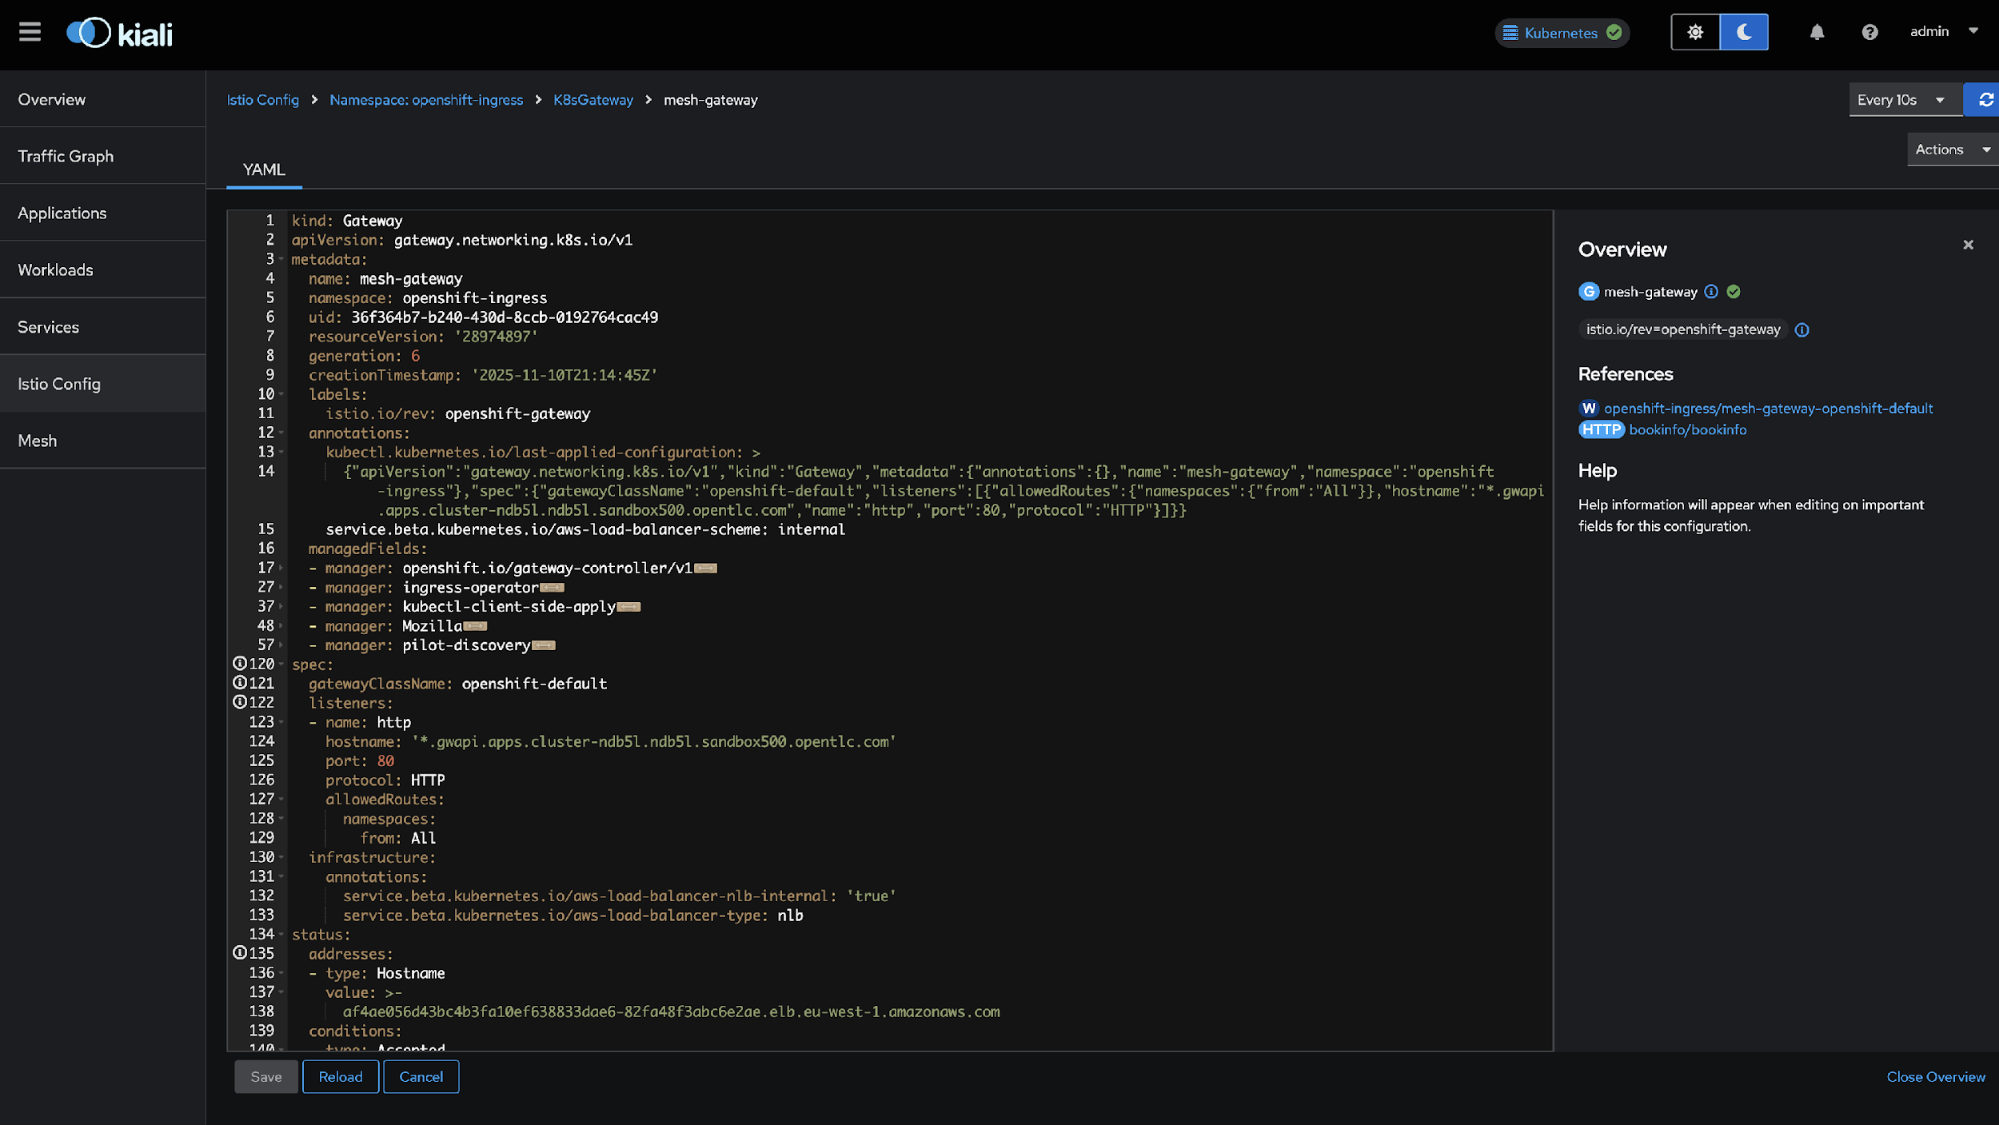
Verify gateway configuration
- Navigate to Istio Config (Figure2).
- Select the
openshift-ingressnamespace. - Find the
mesh-gatewaygateway resource. - Confirm there are no validation errors (no KIA1504).
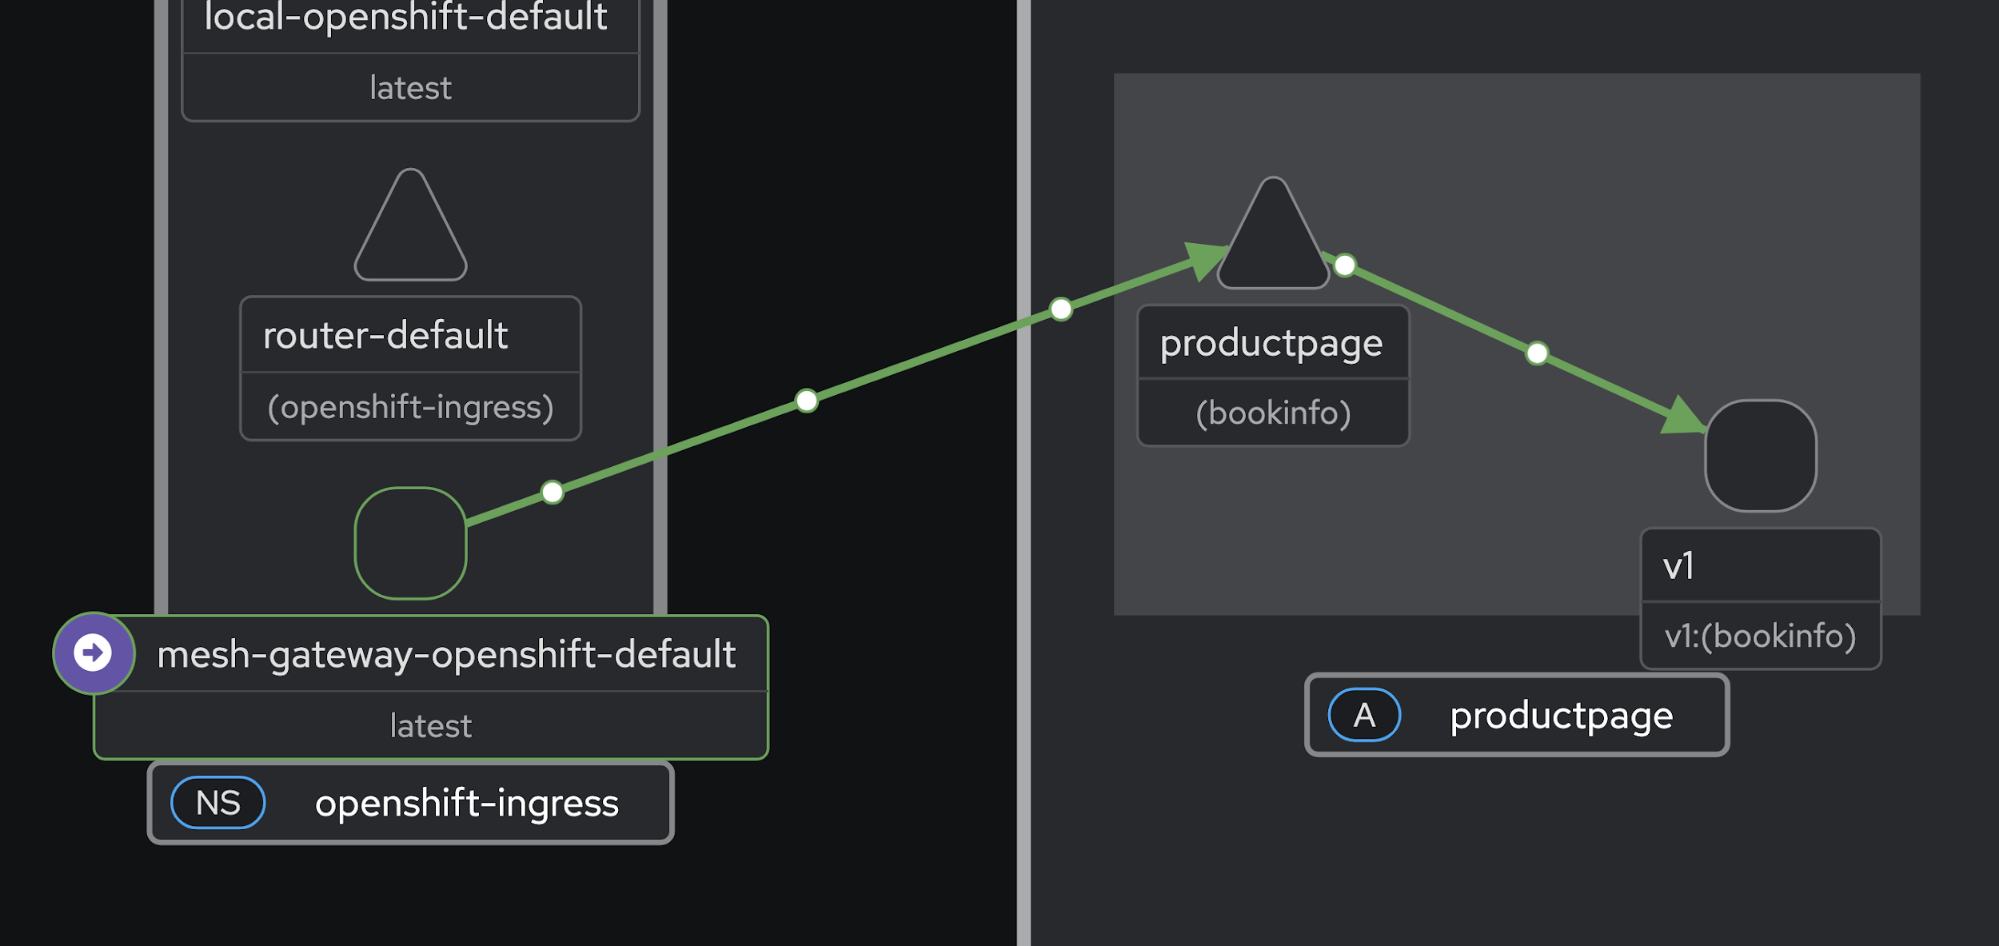
What you can observe
With Kiali properly configured, you now have visibility into traffic flow topology. The graph view shows the complete request path in Figure 4: Client → Gateway (openshift-ingress) → productpage → reviews → ratings.
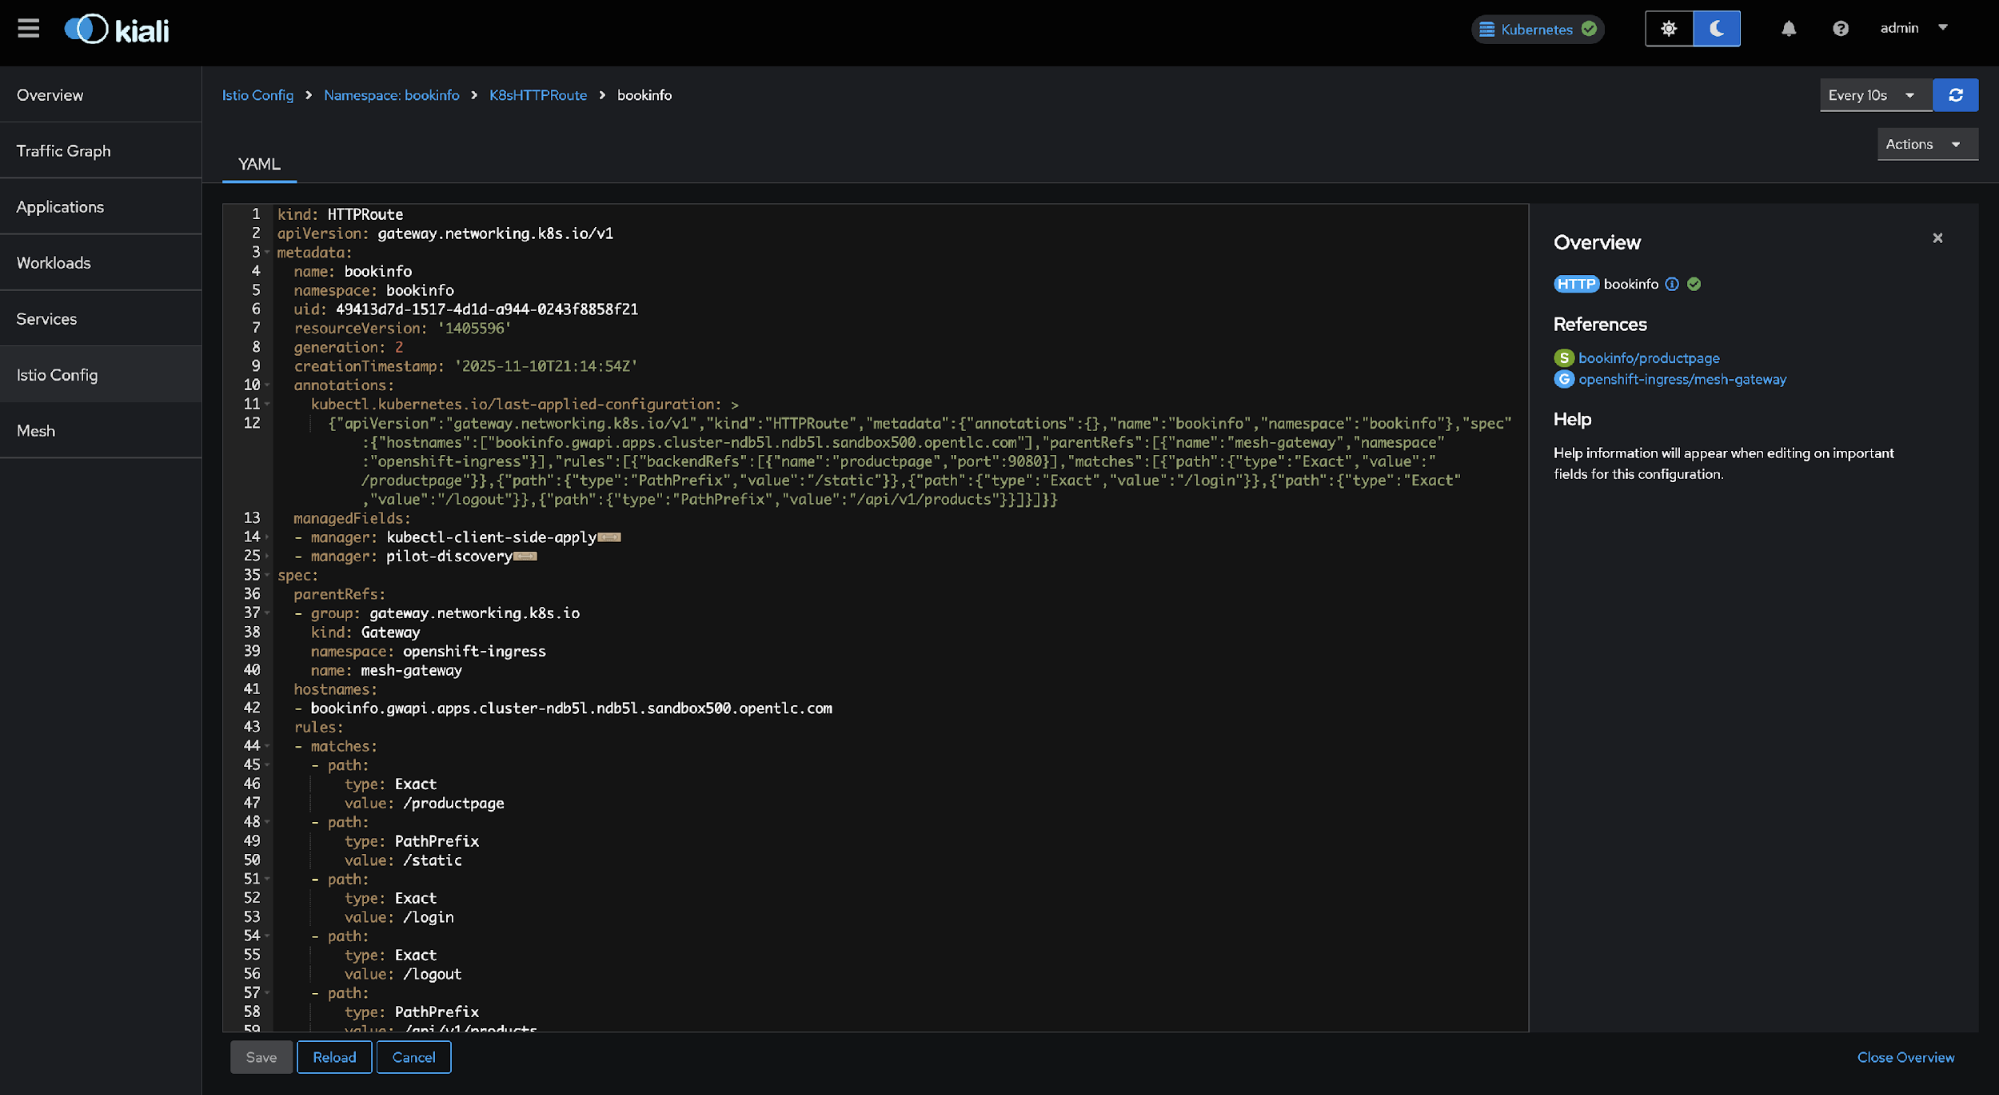
Gateway API resources
In the Istio Config view (Figure 4):
- Gateway: mesh-gateway in
openshift-ingress - HTTPRoute: bookinfo in bookinfo namespace
- Both validated without errors.
Wrap up
By combining these two configurations, Kiali provides unified observability across your dual-mesh architecture from the Gateway API edge all the way to your Service Mesh workloads. Kiali achieves this by allowing you to control which namespaces it monitors using discovery_selectors and which GatewayClasses it validates using gateway_api_classes.
Additional resources: