Compile time does not get as much attention as it once did. Fast machines and compile farms with thousands of machines make time spent compiling seem less important than ever. Most modern priorities are for the program to either run fast or have a small footprint—sometimes both. That does not mean we should ignore compile time. The compiler builds itself, so in some respects compile time is a reflection of how well it generates runtime code.
As a developer of GCC it is important to have good software practices, just like everyone should. When I change the code base, I need to be aware of how my changes impact the compilers performance. Although the focus is primarily runtime and code size, compile time is always an ongoing concern. Inefficient algorithms are obviously to be avoided, but many small unnecessary compile time increases that seem innocuous build up over time. These occasionally turn into more serious problems which are then presented to us as defects to be fixed. Small leaks sink great ships.
I deal with dozens of reports every year that are compile time-related. Often it is small programs which someone noticed takes a disproportional amount of time, but sometimes it is a gargantuan machine generated file which takes 2 days to compile, or perhaps it never finishes compilation (those are usually fun...) Regardless, it is simply good practice to monitor the impact of your code changes and avoid introducing nonsense that may come back to haunt you later.
Measure, measure, measure
When I was much younger I learned a very valuable lesson that still guides me today: "Never make assumptions about where the bottleneck is until you actually measure it."
I was re-architecting part of IBM's compiler into C++ and was quite concerned about how one particular component would perform. When we were finally in a position to test it, sure enough, it was significantly slower than what it was meant to replace. I was pretty sure I knew why, and was prepared to rewrite that component to make it faster. Someone more senior convinced me to go to the effort to profile it first just to be sure. (It was more painful in those days). So we did. To my surprise (and horror), I discovered the hotspot was in a function where a C++ parameter had a typo and was being passed by-value instead of by-reference. By adding that single & to the parameter, the entire slowdown went away and the new code was now faster than the original. All that extra time was spent copying structures unnecessarily. I was saved a lot of unnecessary coding that would not have even solved the real problem. Today, I still live by that lesson and pass it on whenever I can.
When GCC is invoked with the -Q option, it will show how much time is spent in each optimization phase. This is normally the way problems are reported to us, and it's a quick way to see how passes are performing relative to each other.
We monitor how long the pass took before a change, and then how much time it takes afterwards. Then a judgement call is made on whether any increase is worthwhile, or whether further work is required.
Output (trimmed) from a recent issue I dealt with looks something like this:
tree VRP                           :  23.84 ( 13%)    43M (  4%)
tree Early VRP                     :  11.18 (  6%)    12M (  1%)
TOTAL                              : 181.97         1175M
There are a total of 3 VRP passes: 1 early and 2 "normal" passes. The percentage of time spent in a pass is a good guide for when there is an issue that needs to be looked at. When a pass is taking too long (there can be hundreds of optimization passes, so 19% of compile time in 3 passes is too long,) then we usually want to figure out why and fix it. One problem with this -Q time output is that it varies based on many factors, including how busy the machine is. More importantly, it does not help you refine where the problem is.
Valgrind and callgrind
My go-to tool for analysis over the past number of years is Valgrind, and more specifically a component called callgrind.
Valgrind is a framework for tools that are used to analyze the runtime behavior of binaries.
callgrind is one of the tools within the framework and it collects profile data such as the how many instructions are executed by each function, and which functions call each other.
cachegrind is used by callgrind to help simulate execution and provide additional information.
I'm certainly not a power user, but it takes very little knowledge to get useful results. I particularly like that there is no need to recompile the program in order to get trace information. I cannot stress how important this is. The same binary I use to get performance numbers is the same binary I use to get trace information on how long is being spent in each function. This gives me confidence that what gets reported is accurate.
What you see as compile time in GCC is actually the execution time of the compiler for me as a GCC developer. If you are measuring runtime performance, using Valgrind may be just as applicable to you and your projects as it is to mine. These tools have been around for a couple of decades now, and there is lots of information on the web if you are interested in more details, as well as what other capabilities they have.
Where are the hotspots?
In order to analyze where time is being spent, we build a release compiler with debug info (-ggdb) and then invoke whatever the normal compile command is, i.e.:
./cc1 -O2 file.cThis is prefixed with valgrind --tool=callgrind:
valgrind --tool=callgrind ./cc1 -O2 file.cIt does take quite a bit longer to execute (an order of magnitude perhaps?) but it is collecting and logging very valuable info. For this case, how many instructions are executed in each function, and what percentage of total compilation that is.
callgrind generates a file with the prefix callgrind.out.*, and then I then invoke kcachegrind to visualize the results. That's all there is to it. Functions are sorted by how much time was spent in them, and kcachegrind allows for a nice interactive point and click examination of callers and callees, as shown in Figure 1.
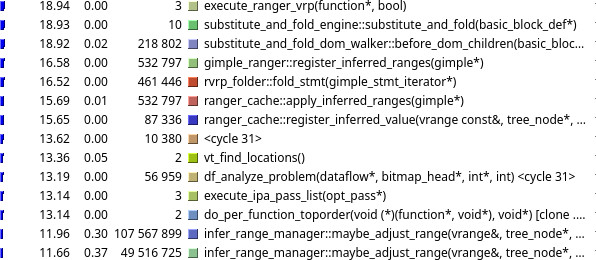
Here ranger_vrp was executes 3 times (that's the 3 passes), for a total of 18.94% of compilation. Of that, 16.58% was spent in register_inferred_range, which, when following the call chain, we also see almost 12% spent in maybe_adjust_range, with over 150,000,000 combined calls.
It also provides a list of callers and callees and how much time is spent in each of those, which you can interactively examine (Figure 2).

Having written the code, I knew this was unexpected and unreasonable. I investigated why so much time was being spent in what was supposed to be a relatively cheap routine. Of the callers, ranger_from_dom was the big culprit at 12.71%, which is suppose to cache values from previous queries, and should not be that expensive, especially from where it was called.
I discovered register_inferred_range was missing a check for known invariant values. It was calling range_from_dom on a very large flow graph and calculating a huge number of values that were already known and did not need to be calculated. A 2 line patch to simply check for this case and avoid that unnecessary call resulted in:
tree VRP                           :   8.11 (  4%)    43M (  4%)
tree Early VRP                     :   3.66 (  2%)    12M (  1%)
TOTAL                              : 158.99         1175M
This is down to 6% (or 2% per pass). For this test case, 67% of the time in VRP was spent calculating values that were already known and easily available. A 100% total waste of time and effort. That is an overall compile time decrease of about 15%. For a 2 line patch. It reminds me of that simple C++ reference typo from years ago.
Day to day use.
I not only use Valgrind to determine the root of a problem, but I also use it daily as a litmus check. In the value range propagation (VRP) ranger project we measure every change.
We have a script (written by a colleague) which first builds the compiler, then rebuilds a significant portion of the compiler again using callgrind. The output files are then parsed and the cycle count is added up to see what the estimated instruction count of the code is. This is accumulated for the entire build, and then we can easily and deterministically compare how the execution for one build compares to the execution of a baseline build. Output from the script looks something like this:
trunk vs 0003 for pass: vrp
---------------------------------------
%change from trunk to 0003 is -1.5%
 %change time: 39245561871.0000 vs 38658550036.0000 (diff -587011835.0000)
 Branch was slower for 36 out of 239 files.
Note: Positive percentage/difference means branch is slower.
Note: Negative percentage/difference means branch is faster.
That is the actual result for the earlier 2 line patch to fix the register_inferred_range problem. It not only helped the problematic test case, but we can see that it demonstrates a general improvement in VRP across multiple source files of 1.5%. That adds up over time.
You may have noticed the "Branch was slower for 36 out of 239 files" line. With every patch we always see some files slowing down a bit, and some files speed up. That is just the nature of different files and functions having different characteristics. As a project, we generally care about the aggregate value so that overall performance across a broad spectrum is improved. Individual file performance cannot be completely ignored, however. The script we use also breaks down the results into which files sped up the most and which slowed down the most. This allows me to notice potential pathological cases early. If we see a 0.2% variance in most files, but one file shows a 400% slowdown (it has happened!), then its important to examine why that file is so much slower and deal with that situation. Cases like that are potential defect reports down the road, and those are exactly what we are trying to prevent.
As a GCC developer, this is part of my efforts at quality control. Every single patch I write for GCC is analyzed this way, including any work-in-progress patches. I frequently use these measurements to help choose between alternate approaches, or to test theories. If an undesirable increase is noted, the callgrind output is available for examination to figure out why.
Summary
Using callgrind for daily analysis is much more effective than using the -Q execution times because it is deterministic and removes any variance from how busy the machine is. It also uses the same binary which is very helpful avoiding frequent re-compiles. The easier something is to use, the more likely it is to be useful.
This daily development regiment of using callgrind helps to avoid introducing changes which have undesirable compile time performance. We can't catch everything of course, but we can at least reduce the chances of pointless slowdowns.
I encourage you to reflect if there is anything in this article that you can apply to your development regiment. In carpentry, they have a saying: "Measure twice, cut once." I think there are a lot of software projects out there that do not measure at all! Code is being written and tested for correctness, but rarely examined or measured for efficiency. I bet there are a lot of wasted cycles being burned every day just because no one has noticed or even looked for them.
Do you know where your hotspots are?