Redhat Developers  Logo
  • Products

    Featured

    • Red Hat Enterprise Linux
      Red Hat Enterprise Linux Icon
    • Red Hat OpenShift AI
      Red Hat OpenShift AI
    • Red Hat Enterprise Linux AI
      Linux icon inside of a brain
    • Image mode for Red Hat Enterprise Linux
      RHEL image mode
    • Red Hat OpenShift
      Openshift icon
    • Red Hat Ansible Automation Platform
      Ansible icon
    • Red Hat Developer Hub
      Developer Hub
    • View All Red Hat Products
    • Linux

      • Red Hat Enterprise Linux
      • Image mode for Red Hat Enterprise Linux
      • Red Hat Universal Base Images (UBI)
    • Java runtimes & frameworks

      • JBoss Enterprise Application Platform
      • Red Hat build of OpenJDK
    • Kubernetes

      • Red Hat OpenShift
      • Microsoft Azure Red Hat OpenShift
      • Red Hat OpenShift Virtualization
      • Red Hat OpenShift Lightspeed
    • Integration & App Connectivity

      • Red Hat Build of Apache Camel
      • Red Hat Service Interconnect
      • Red Hat Connectivity Link
    • AI/ML

      • Red Hat OpenShift AI
      • Red Hat Enterprise Linux AI
    • Automation

      • Red Hat Ansible Automation Platform
      • Red Hat Ansible Lightspeed
    • Developer tools

      • Red Hat Trusted Software Supply Chain
      • Podman Desktop
      • Red Hat OpenShift Dev Spaces
    • Developer Sandbox

      Developer Sandbox
      Try Red Hat products and technologies without setup or configuration fees for 30 days with this shared Openshift and Kubernetes cluster.
    • Try at no cost
  • Technologies

    Featured

    • AI/ML
      AI/ML Icon
    • Linux
      Linux Icon
    • Kubernetes
      Cloud icon
    • Automation
      Automation Icon showing arrows moving in a circle around a gear
    • View All Technologies
    • Programming Languages & Frameworks

      • Java
      • Python
      • JavaScript
    • System Design & Architecture

      • Red Hat architecture and design patterns
      • Microservices
      • Event-Driven Architecture
      • Databases
    • Developer Productivity

      • Developer productivity
      • Developer Tools
      • GitOps
    • Secure Development & Architectures

      • Security
      • Secure coding
    • Platform Engineering

      • DevOps
      • DevSecOps
      • Ansible automation for applications and services
    • Automated Data Processing

      • AI/ML
      • Data Science
      • Apache Kafka on Kubernetes
      • View All Technologies
    • Start exploring in the Developer Sandbox for free

      sandbox graphic
      Try Red Hat's products and technologies without setup or configuration.
    • Try at no cost
  • Learn

    Featured

    • Kubernetes & Cloud Native
      Openshift icon
    • Linux
      Rhel icon
    • Automation
      Ansible cloud icon
    • Java
      Java icon
    • AI/ML
      AI/ML Icon
    • View All Learning Resources

    E-Books

    • GitOps Cookbook
    • Podman in Action
    • Kubernetes Operators
    • The Path to GitOps
    • View All E-books

    Cheat Sheets

    • Linux Commands
    • Bash Commands
    • Git
    • systemd Commands
    • View All Cheat Sheets

    Documentation

    • API Catalog
    • Product Documentation
    • Legacy Documentation
    • Red Hat Learning

      Learning image
      Boost your technical skills to expert-level with the help of interactive lessons offered by various Red Hat Learning programs.
    • Explore Red Hat Learning
  • Developer Sandbox

    Developer Sandbox

    • Access Red Hat’s products and technologies without setup or configuration, and start developing quicker than ever before with our new, no-cost sandbox environments.
    • Explore Developer Sandbox

    Featured Developer Sandbox activities

    • Get started with your Developer Sandbox
    • OpenShift virtualization and application modernization using the Developer Sandbox
    • Explore all Developer Sandbox activities

    Ready to start developing apps?

    • Try at no cost
  • Blog
  • Events
  • Videos

Visualizing Smog Sensor Data with the help of Vert.x, Prometheus, and Grafana

July 6, 2017
Heiko Rupp

Share:

    Air pollution is a major problem in many cities around the globe. Some people in Stuttgart, Germany have developed cheap smog sensors that people can install on their balconies and other convenient places and then report data to a central site. I have written about that on OpenSource.com. The data is sent to a central server, from where it is visualized on a map. At the time of writing the above article, there was no way of seeing how the value has changed over time. Meanwhile, there is a visualization of the last 24 hours available on the map.

    The sensor is also able to send data to an additional target, for example, a local database. Thus, I decided to feed the data to a local server for long-term storage to visualize trends.

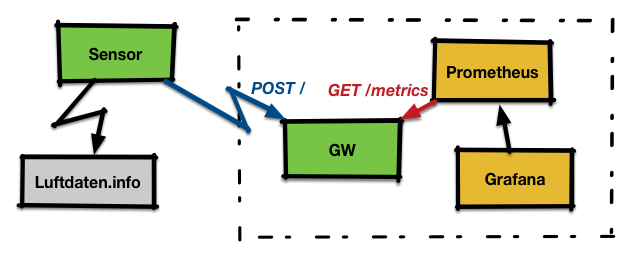
    As I was playing with Prometheus at this time, I thought that feeding the data into it may be a good use case for further exploration. Now that Prometheus wants to scrape the data and the sensor is only pushing the data, it became clear that I need an intermediate gateway that solves this mismatch and which also translates the data format the sensor sends into the format Prometheus expects.

    To implement the gateway, I choose Vert.x a modern day reactive framework that runs on the Java Virtual Machine (JVM). I was first considering other options, but it turned out that Vert.x' implicit handling of connections and threading made my life easy.

    The gateway receives Http POST requests from the sensor with measurement data in InfluxDB format. It exposes the data to GET requests on /metrics in the Prometheus text format.

    Finally, the data stored in Prometheus is visualized via Grafana.

    I will now show some pieces of the code; the full code is available on GitHub.

    Gateway code

    The code consists of two main parts for the two endpoints described above.
    I have implemented both in the same Verticle.

    public class MainVerticle extends AbstractVerticle {
    
      // Label on dust data
      private static final String TYP_FS = "{typ=\"fs\"}";
    
      @Override
      public void start(Future fut) {
    
        // [... see below ...]
    
        vertx
            .createHttpServer()
            .requestHandler(router::accept)
            .listen(
                // Set the port we listen on to 10080
                config().getInteger("http.port", 10080),
                result -> {
                  if (result.succeeded()) {
                    fut.complete();
       [...]

    This first part creates a new verticle and then inside of start() sets the http port it listens on to 10080 and then tells Vert.x that the configuration is ready. Vert.x then starts is accept loop and dispatches incoming requests.

    The next step is now to define handlers for the endpoints to do the actual work. In the handlers we need to be careful not to block or implement slow operations; Vert.x may decide to abort the handler in this case.

    Let's look at the handler for scraping of data first:

    router.get("/metrics")
              .handler(routingContext -> {
    
          HttpServerResponse response = routingContext.response();
    
          // If we have no data yet, return a 204 'no content'
          if (values.isEmpty()) {
            response.setStatusCode(204).end();
            return;
          }
    
          // Construct the response
          StringBuilder builder = [...]
          // send it back
          response.setStatusCode(200)
              .putHeader("content-type","text/plain; version=0.0.4")
              .end(builder.toString());
        });

    Now let's look at the POST handler. This is a tiny bit more complicated as we need to explicitly tell Vert.x to that we want to obtain the body of the request. On top, we also want to get the sensor ID, which is encoded in a Http-Header.

    // We need the body, so we need to enable it.

    // We need the body, so we need to enable getting it.
        router.route("/").handler(BodyHandler.create());
    
        // Bind "/" to our fs-input
        router.post("/")
              .handler(routingContext -> {
          // Get the sensor id from the header
          String tmp = routingContext.request().getHeader("X-Sensor");
    [...]
          // Get the measurement data
          JsonObject body_json = routingContext.getBodyAsJson();
          JsonArray value_array = body_json.getJsonArray("sensordatavalues");
    [...]
          HttpServerResponse response = routingContext.response();
          response.setStatusCode(200).end();

    Building and running the code

    You can check out the full code from GitHub and then build it via,

    $ mvn install

    This creates a self-contained Java archive in the target directory, which contains our Verticle along with all the Vert.x code that is needed to run it. Thus, running is as simple as:

    $ java -jar target/fsgw.jar

    Configuring the other pieces

    For the setup, I run the Gateway, Prometheus, and Grafana on the same host, with an IP of 172.31.7.2.

    For the sensor

    Go to the sensor configuration page, select "Send to own API" and enter the IP and port of the Gateway like this:

    Sensor configuration

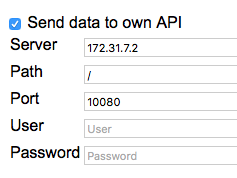
    After this is done, save the configuration and reboot the sensor.

    Prometheus

    Prometheus needs an external configuration file prometheus.yml that gets an additional scrape config for our sensor:

    scrape_configs:
      - job_name: 'feinstaub'
        scrape_interval: 30s
    
        static_configs:
          - targets: ['172.31.7.2:10080']
    

    As the target, you enter the IP address and port from the Vert.x gateway. After this is done, you can start Prometheus and pass the path to the configuration to it:

    $ prometheus -config.file /usr/local/etc/prometheus.yml

    Grafana

    Start Grafana and point your browser at port 3000; default login is admin/admin.
    To set up Grafana, one needs to define a datasource of type Prometheus that points to the Prometheus server at http://localhost:9090/. Once this is done, we can set up a new dashboard and add graphs to it.

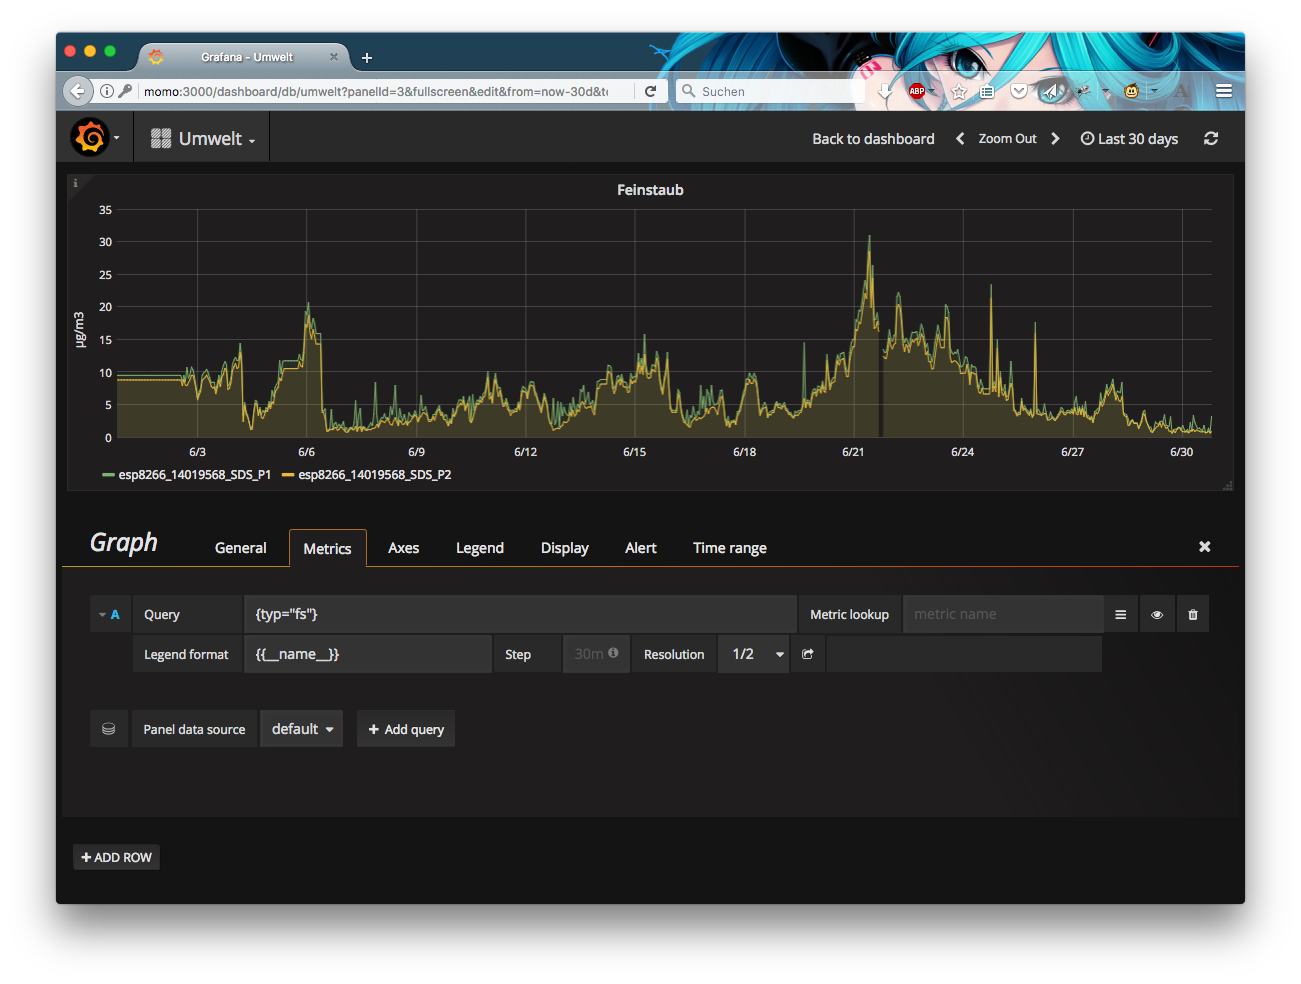
    In above screenshot, you see the query editor. As the code in the gateway is set up to put labels on the exported items according to the type (the sensor can also report temperature and humidity), it is possible to query for the values with a label query of {{typ="fs"}}.

    Summary

    The article shows an end-to-end example of an IoT device sending data in a certain format. A gateway is implemented with the help of the Vert.x framework, which does all the magic of connection handling etc.
    Finally, the data is stored in a Prometheus time series database and graphed via Grafana.


    Download the Eclipse Vert.x cheat sheet, this cheat sheet provides step by step details to let you create your apps the way you want to.

    Last updated: June 30, 2017

    Recent Posts

    • How Kafka improves agentic AI

    • How to use service mesh to improve AI model security

    • How to run AI models in cloud development environments

    • How Trilio secures OpenShift virtual machines and containers

    • How to implement observability with Node.js and Llama Stack

    Red Hat Developers logo LinkedIn YouTube Twitter Facebook

    Products

    • Red Hat Enterprise Linux
    • Red Hat OpenShift
    • Red Hat Ansible Automation Platform

    Build

    • Developer Sandbox
    • Developer Tools
    • Interactive Tutorials
    • API Catalog

    Quicklinks

    • Learning Resources
    • E-books
    • Cheat Sheets
    • Blog
    • Events
    • Newsletter

    Communicate

    • About us
    • Contact sales
    • Find a partner
    • Report a website issue
    • Site Status Dashboard
    • Report a security problem

    RED HAT DEVELOPER

    Build here. Go anywhere.

    We serve the builders. The problem solvers who create careers with code.

    Join us if you’re a developer, software engineer, web designer, front-end designer, UX designer, computer scientist, architect, tester, product manager, project manager or team lead.

    Sign me up

    Red Hat legal and privacy links

    • About Red Hat
    • Jobs
    • Events
    • Locations
    • Contact Red Hat
    • Red Hat Blog
    • Inclusion at Red Hat
    • Cool Stuff Store
    • Red Hat Summit

    Red Hat legal and privacy links

    • Privacy statement
    • Terms of use
    • All policies and guidelines
    • Digital accessibility

    Report a website issue