To truly understand an LLM's real production potential, you have to measure the performance of its serving engine. The high-performance inference technology at the core of Red Hat AI is based on the vLLM open-source project, whose performance optimization techniques are key to achieving speed and throughput at scale.
This article offers Kubernetes users a comprehensive, step-by-step approach to manually deploy and test the inference capabilities of vLLM. We will deploy the community version of a containerized vLLM server on OpenShift (as our Kubernetes distribution of choice) using NVIDIA GPUs and use GuideLLM, a specialized performance benchmarking tool, to generate the metrics needed to validate its capabilities under load.
GuideLLM is designed to run performance benchmarks against LLM inference servers. It is able to simulate multiple simultaneous users by sending requests concurrently at various rates. This allows us to understand how the vLLM server behaves under load, measuring critical metrics like request throughput, latency, and tokens per second to evaluate its suitability for production workloads. Please refer to this article or video to learn more about GuideLLM.
Prerequisites
Before you begin, ensure you have the following:
- An OpenShift or Kubernetes cluster (this guide uses openshift version 4.17.15).
- A node with NVIDIA GPUs (this guide uses NVIDIA A100s).
- The NVIDIA GPU Operator installed on your cluster. This operator acts as a bridge between the GPUs on your nodes and the OpenShift scheduler. It manages drivers and exposes the GPU resource that pods need to request GPU access.
- The oc command-line tool configured to access your cluster.
- Note for Kubernetes Users: This guide uses OpenShift commands (oc), but can be easily adapted for Kubernetes by replacing oc with kubectl. OpenShift-specific features like Routes will have Kubernetes alternatives noted throughout the guide.
Step 1: Deploy vLLM on OpenShift/Kubernetes
Note on Inference Server Options:
This guide demonstrates vLLM deployment for simplicity and broad applicability across Kubernetes environments. However, for enterprise production deployments, Red Hat recommends using Red Hat AI Inference Server, which offers an enterprise-grade and supported version of vLLM. Alternatively, users can leverage Red Hat OpenShift AI, which expands Red Hat AI Inference Server's capabilities into a full, end-to-end gen AI/MLOps platform for the hybrid cloud.
For AI Inference Server or OpenShift AI deployment instructions, refer to the AI Inference Server documentation and OpenShift AI documentation.
The GuideLLM benchmarking methodology demonstrated in Step 2 and beyond applies equally to both vLLM and AI Inference Server deployments.
First, we will need to set up a project and service account to deploy the vLLM server.
1. Create a project and service account.
oc new-project vllm-inference
oc create serviceaccount vllm-sa -n vllm-inference

# Kubernetes Equivalent: Replace 'oc' with 'kubectl'.
2. Create a PersistentVolumeClaim (PVC) for saving our models.
The vLLM needs to download the model weights from Hugging Face. We'll create a PVC to store these models persistently.
vllm-pvc.yaml:
apiVersion: v1
kind: PersistentVolumeClaim
metadata:
  name: vllm-models-pvc
  namespace: vllm-inference
spec:
  accessModes:
    - ReadWriteOnce
  resources:
    requests:
      storage: 50Gi
storageClassName: <your-storage-class>Note: Replace <your-storage-class> with a storage class available on your cluster. You can find available classes by running oc get sc(or kubectl get sc for Kubernetes). If it returns empty you will first need to create a storage class.
Since we're using ReadWriteOnce (RWO) access mode with a single replica, local storage classes work well for this use case. If you plan to scale to multiple replicas, you'll need to change the accessMode to ReadWriteMany (RWX) and use an RWX-compatible storage class. Common storage class examples:
For Local/Block Storage (RWO):
LVMS (Logical Volume Manager Storage): lvms-vg1
OpenShift Data Foundation: ocs-storagecluster-ceph-rbd
Local storage: local-path
Cloud providers: gp3 (AWS), standard-rwo (GKE), managed-csi (Azure)
If you need multiple replicas, these are for Shared/Network Storage (RWX):
NFS: nfs-client or managed-nfs-storage
OpenShift Data Foundation: ocs-storagecluster-cephfs
Cloud providers: efs-sc (AWS), filestore-csi (GKE), azurefile (Azure)
Apply the manifest to create the PVC:
oc apply -f vllm-pvc.yaml
3. Create a Hugging Face Secret
Many models, like Llama 3.1, require authentication with a Hugging Face token. Create a secret to store your token. You will create a token using your Hugging Face account.
oc create secret generic huggingface-secret \
--from-literal=hf_token=<your-hugging-face-token> \
-n vllm-inference
4. Define and deploy vLLM
Now, create the Deployment manifest. This will pull the latest vLLM container image, mount the PVC and the secret, and start the server. This manifest defines everything our vLLM pod needs to run successfully.
vllm-deployment.yaml:
apiVersion: apps/v1
kind: Deployment
metadata:
  name: vllm-llama-8b
  namespace: vllm-inference
spec:
  replicas: 1
  selector:
    matchLabels:
      app: vllm-llama-8b
  template:
    metadata:
      labels:
        app: vllm-llama-8b
    spec:
      serviceAccountName: vllm-sa
      containers:
      - name: vllm
        image: vllm/vllm-openai:v0.11.2
        env:
        - name: HF_TOKEN
          valueFrom:
            secretKeyRef:
              name: huggingface-secret
              key: hf_token
        - name: HOME
          value: /models
        - name: HF_HOME
          value: /models/.cache
        - name: FLASHINFER_WORKSPACE_DIR
          value: /models/.cache/flashinfer
        command: ["/bin/sh", "-c"]
        args:
          - "python3 -m vllm.entrypoints.openai.api_server --model meta-llama/Llama-3.1-8B-Instruct --download-dir /models --tensor-parallel-size 1 max-model-len 2048"
        ports:
        - containerPort: 8000
        resources:
          limits:
            nvidia.com/gpu: 1
        volumeMounts:
        - name: dshm
          mountPath: /dev/shm
        - name: model-storage
          mountPath: /models
      volumes:
      - name: dshm
        emptyDir:
          medium: Memory
      - name: model-storage
        persistentVolumeClaim:
          claimName: vllm-models-pvc
Deploy the vLLM server:
oc apply -f vllm-deployment.yaml5. Expose the service
To allow other applications (like our guidellm benchmark job) to access the vLLM server, we need to create a service.
oc expose deployment vllm-llama-8b --port=8000 --name=vllm-service6. Create a route for external access (optional for testing)
This step creates an external route so you can test the vLLM deployment from outside the cluster using curl or other tools.
oc expose service vllm-service --name=vllm-routeKubernetes alternative:
# For vanilla Kubernetes, Routes are not available. Instead, use one of these options:
a) LoadBalancer Service (if your cluster supports it):
    kubectl patch service vllm-service -p '{"spec":{"type":"LoadBalancer"}}'
 b) NodePort (for testing):
    kubectl patch service vllm-service -p '{"spec":{"type":"NodePort"}}'
 c) Ingress Resource (requires an Ingress Controller installed)
Important note on benchmarking:
While we're creating a route for external testing, our GuideLLM benchmark job will use the internal service endpoint (http://vllm-service.vllm-inference.svc.cluster.local:8000) instead. This ensures accurate performance metrics by avoiding external network latency and ingress overhead that could skew the results. Benchmarking from inside the cluster provides true application-to-service performance measurements.
7. Test your deployed model by using curl
To verify that your model is deployed and accessible, you can try sending a curl request from your terminal using curl.
curl http://<your route>/v1/chat/completions \
-H "Content-Type: application/json" \
-d '{
  "model": "meta-llama/Llama-3.1-8B-Instruct",
  "messages": [
    {"role": "user", "content": "What is Red Hat?"}
  ],
  "temperature": 0.1
}'
Step 2: Run GuideLLM as a Kubernetes job
With our vLLM instance running, follow these steps to launch a guidellm job.
1. Create a PVC for storing benchmark results.
Just like the vLLM pod, the job's pod is ephemeral and will be deleted after it completes. We need a separate PVC to persistently store the output JSON report from the benchmark.
guidellm-pvc.yaml:
apiVersion: v1
kind: PersistentVolumeClaim
metadata:
  name: guidellm-results-pvc
  namespace: vllm-inference
spec:
  accessModes:
    - ReadWriteOnce
  resources:
    requests:
      storage: 10Gi
  storageClassName: <your-storage-class>
Apply the manifest:
oc apply -f guidellm-pvc.yaml
# Kubernetes Equivalent: Replace 'oc' with 'kubectl'.
2. Define and run the GuideLLM job
This manifest defines the benchmark job. Before we look at the complete manifest, let's understand the key GuideLLM benchmark flags we'll be using:
Understanding the benchmark configuration:
--target: The endpoint URL of the inference server to benchmark. We use the internal Kubernetes service DNS name for cluster-internal communication.
--model: The model ID to benchmark. Must match the model deployed in your vLLM server.
--processor: The tokenizer used to calculate token counts for statistics and synthetic data generation. Typically the same as the model ID.
--data: Defines the benchmark request shape. We use a JSON config specifying synthetic data with 1000 prompt tokens and 1000 output tokens per request.
--rate-type: The benchmark mode. "concurrent" maintains a fixed number of simultaneous requests. Other options include "poisson" (requests per second), "synchronous" (one at a time), and "sweep" (automatic load testing).
--rate: For concurrent mode, this specifies the number of concurrent users to test. In the example below, "1,2,4" means we'll run three separate benchmarks with 1, 2, and 4 simultaneous requests.
--max-seconds: Maximum duration for each benchmark iteration (300 seconds = 5 minutes per rate level).
--output-dir: The directory to save the JSON result files inside the container.
--outputs: The output files to create(json, csv, html)
guidellm-job.yaml:
apiVersion: batch/v1
kind: Job
metadata:
  name: guidellm-benchmark-job
  namespace: vllm-inference
spec:
  template:
    spec:
      containers:
      - name: guidellm
        image: ghcr.io/vllm-project/guidellm:v0.5.0
        env:
        - name: HF_TOKEN
          valueFrom:
            secretKeyRef:
              name: huggingface-secret
              key: hf_token
        - name: HOME
          value: /results
        - name: HF_HOME
          value: /results/.cache
        command: ["guidellm"]
        args:
        - "benchmark"
        - "run"
        - "--target"
        - "http://vllm-service.vllm-inference.svc.cluster.local:8000"
        - "--model"
        - "meta-llama/Llama-3.1-8B-Instruct"
        - "--processor"
        - "meta-llama/Llama-3.1-8B-Instruct"
        - "--data"
        - '{"prompt_tokens":1000,"output_tokens":1000}'
        - "--rate-type"
        - "concurrent"
        - "--max-seconds"
        - "300"
        - "--rate"
        - "1,2,4"
        - "--output-dir"
        - "/results"
        - "--outputs"
        - "benchmark-results.json,benchmark-results.html"
        volumeMounts:
        - name: results-volume
          mountPath: /results
      volumes:
      - name: results-volume
        persistentVolumeClaim:
          claimName: guidellm-results-pvc
      restartPolicy: Never
  backoffLimit: 1
Run the job:
oc apply -f guidellm-job.yamlYou can monitor the status of the job by running oc get pods -w. Wait for the guidellm-benchmark-job pod to change its status from Running to Completed. Once complete you can view the benchmark output by doing an oc logs <guidellm-pod-name>. Delete the job oc delete job guidellm-benchmark-job.
Step 3: Retrieve the benchmark results
Once the job is complete, the results will be saved in the guidellm-results-pvc. To get the file, we can create a temporary "helper" pod that mounts the same PVC, and then use oc cp to copy the file to our local machine.
1. Create the helper pod:
pvc-inspector-pod.yaml:
apiVersion: v1
kind: Pod
metadata:
  name: pvc-inspector
  namespace: vllm-inference
spec:
  containers:
  - name: inspector
    image: registry.access.redhat.com/ubi8/ubi
    command: ["sleep", "infinity"]
    volumeMounts:
    - name: results-storage
      mountPath: /mnt/results
  volumes:
  - name: results-storage
    persistentVolumeClaim:
      claimName: guidellm-results-pvc
Apply it:
oc apply -f pvc-inspector-pod.yaml
2. Copy the results:
oc cp pvc-inspector:/mnt/results/benchmark-results.json ./benchmark-results.json
oc cp pvc-inspector:/mnt/results/benchmark-results.html ./benchmark-results.html
You will now have a benchmark-results.html and a benchmark-results.json file on your local machine with the detailed performance metrics from your vLLM server.
3. View the guidellm results UI on a web browser.
Open the downloaded HTML file with a web browser to view the Guidellm UI, which provides an interactive HTML report with tables and visualizations of benchmark results (Figure 1).
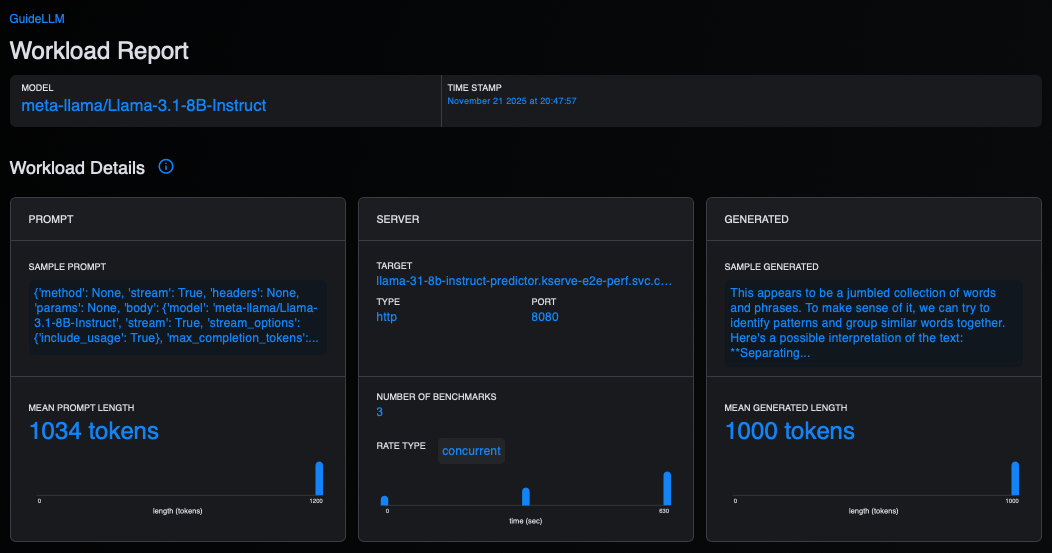
Figure 2 displays a summary of the metrics in the GuideLLM UI.
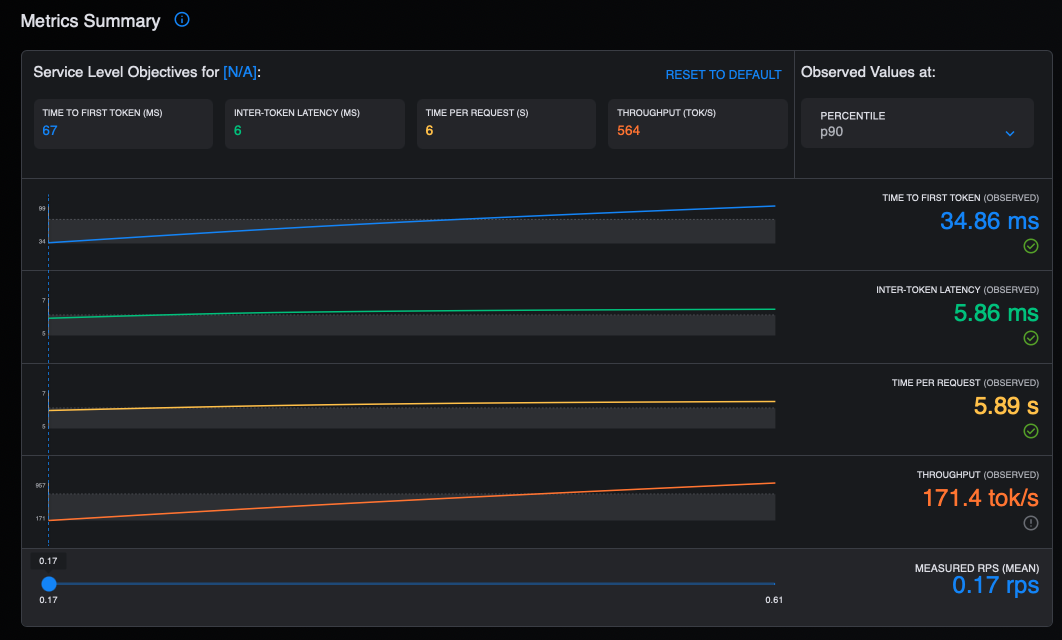
Figure 3 shows the latency in the GuideLLM UI.
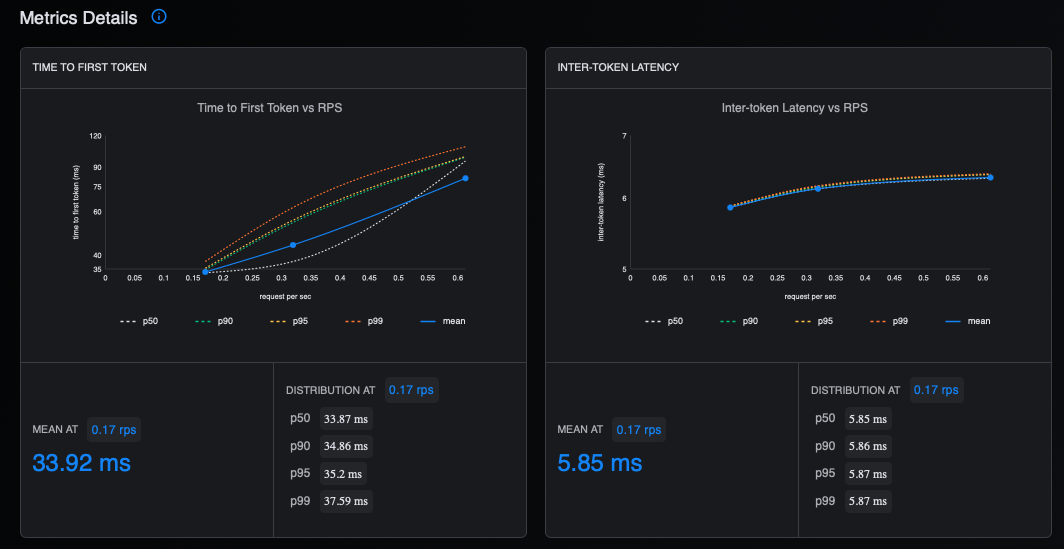
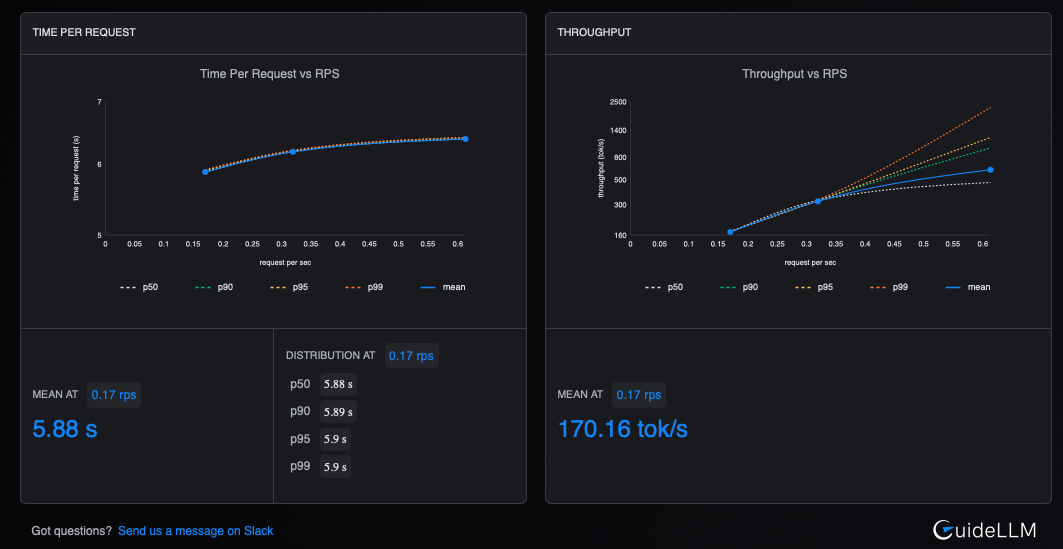
Figure 4 shows the time and throughput metrics.
4. Redisplay the benchmark results.
Guidellm also provides a convenient way to redisplay the results from the saved JSON file using the from-file command. You will need to install guidellm on your local machine using pip as follows:
pip install guidellm[recommended]==0.5.0

guidellm benchmark from-file ./benchmark-results.json
This command will parse the JSON output and display the result tables as shown in Figure 5.
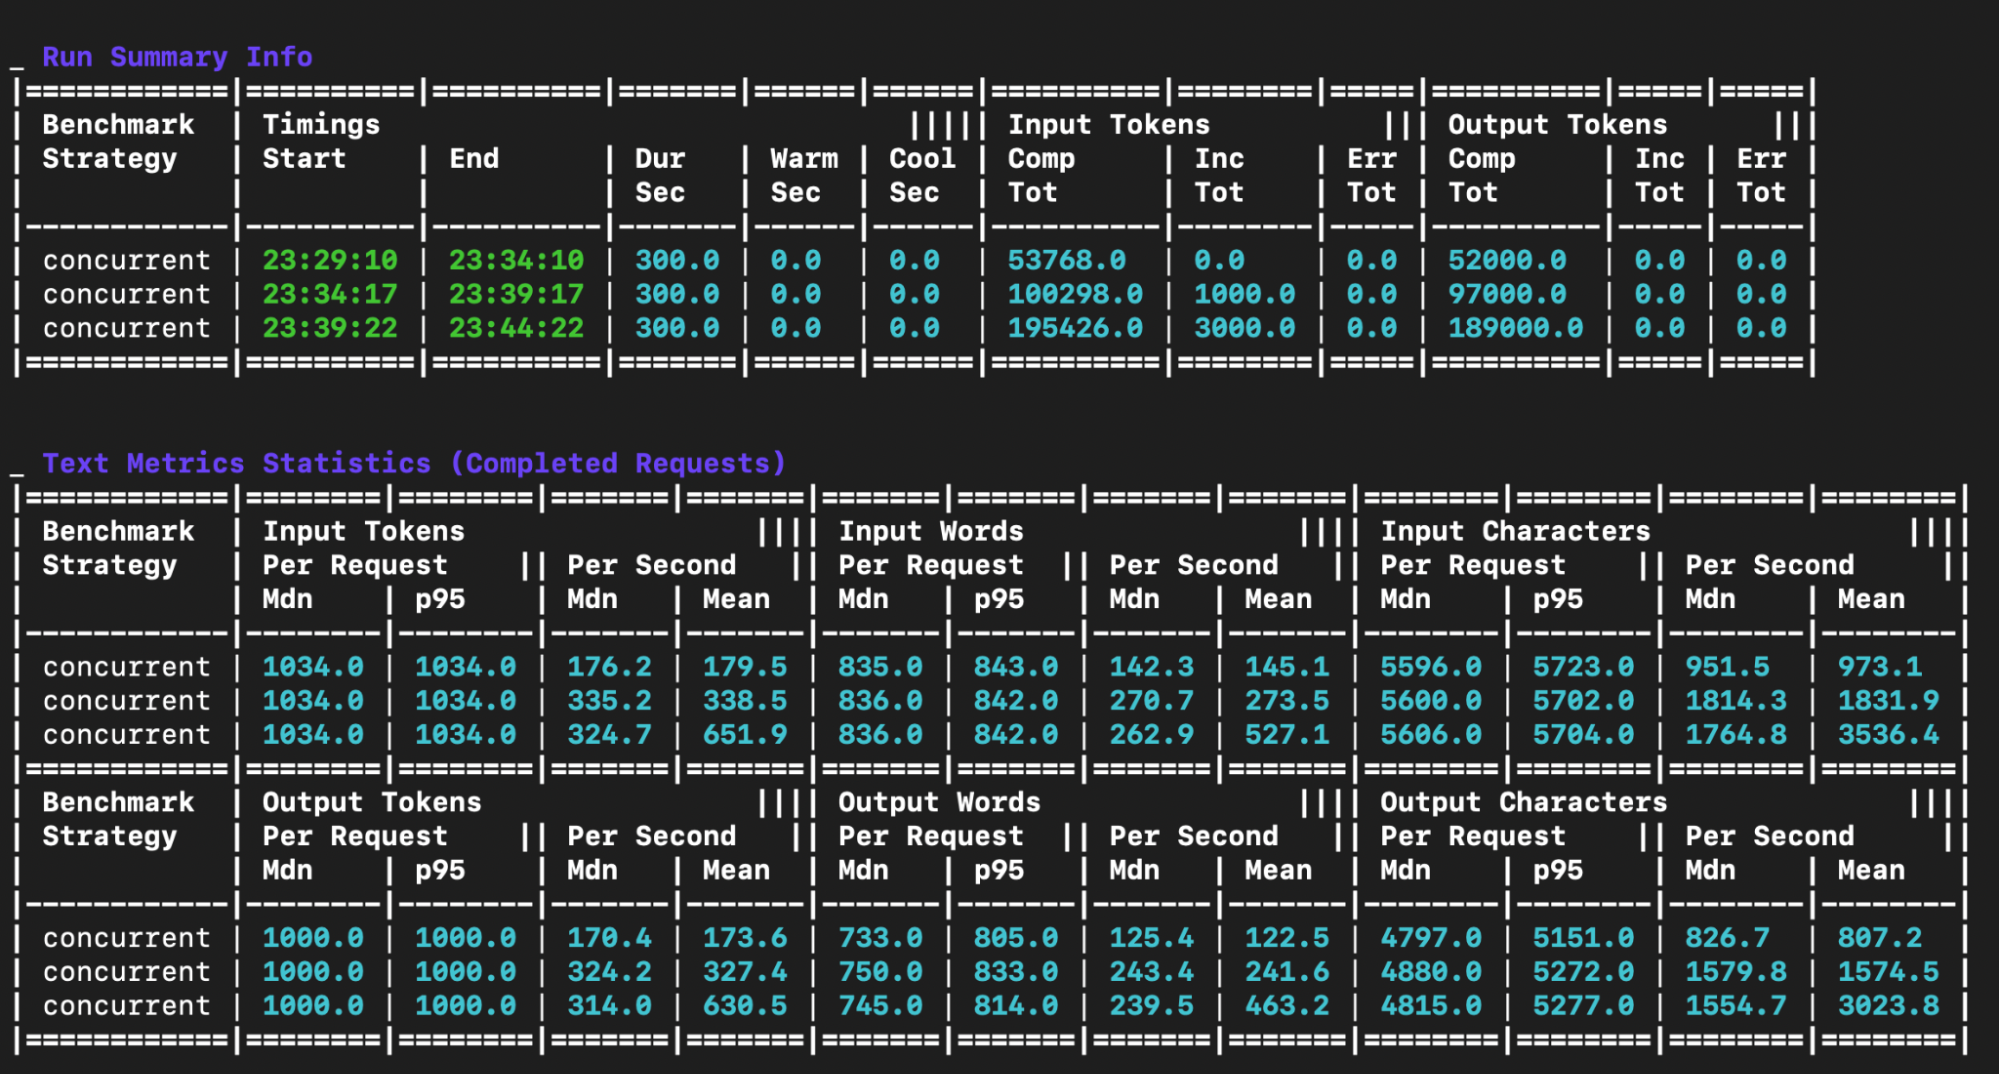
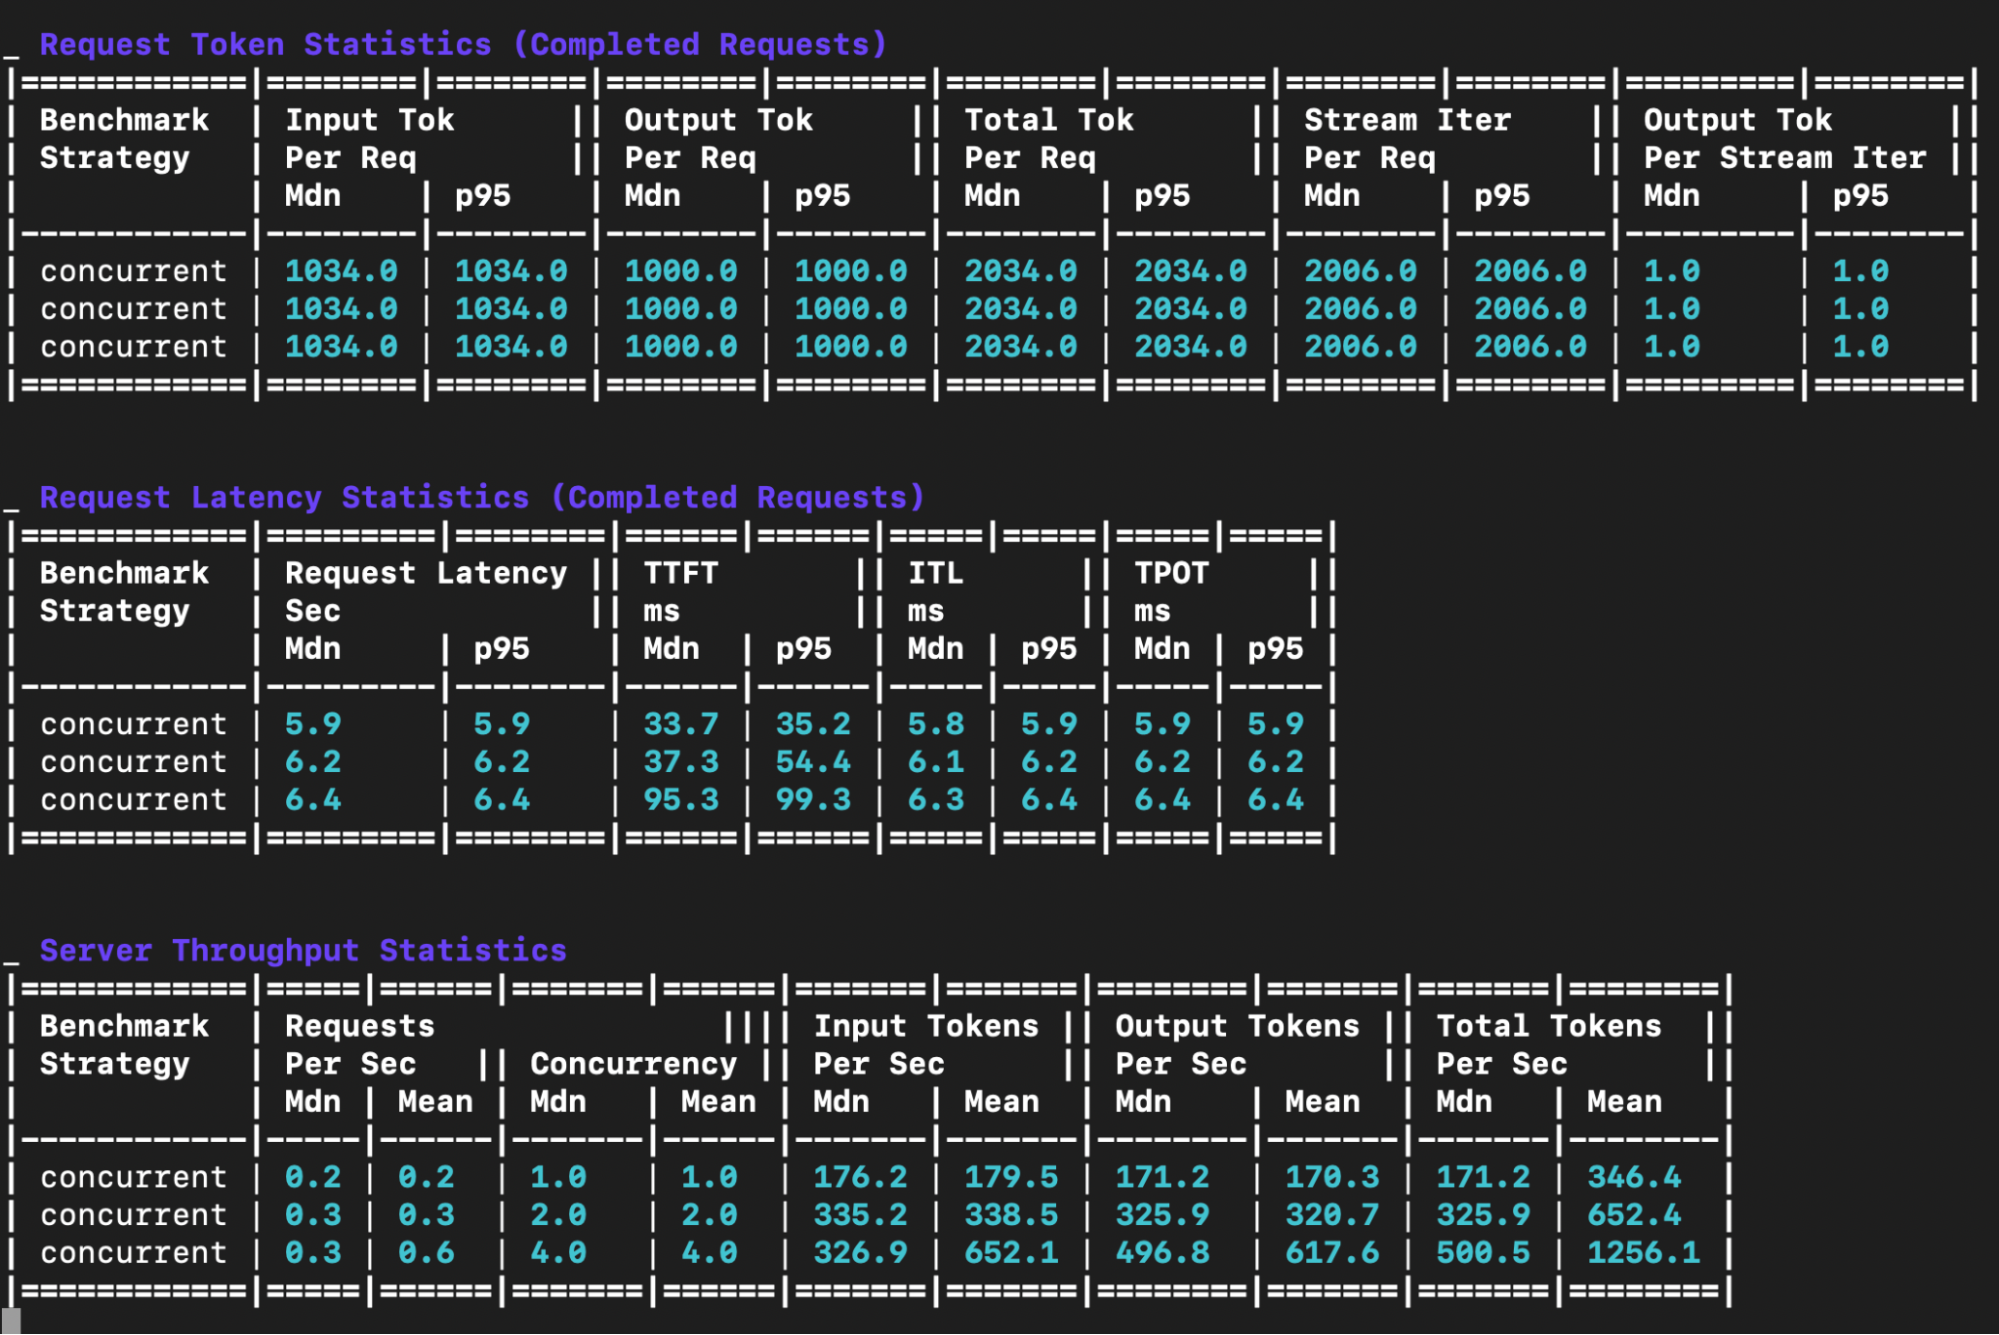
Figure 6 shows more output.
The output includes five main tables:
Run summary info table: This table shows metadata about each benchmark run.
Text metrics statistics table: This table offers a detailed breakdown of the text-related statistics for each benchmark run. It details the input and output token, word and character statistics on a per request and per second basis.
Request token statistics table: This table provides a statistical summary of the input, output and total token counts per request for each benchmark.
Request latency statistics table:
Request latency: Median and p95 end to end latency in seconds - the total time from request to completion
TTFT (Time to First Token): Median and p95 in milliseconds - measures how quickly the model starts generating a response after receiving a request. Lower is better and critical for interactive applications.
ITL (Inter-Token Latency): Median and p95 in milliseconds - the time between consecutive tokens during generation. Consistent low ITL provides smooth streaming experiences.
TPOT (Time Per Output Token): Median and p95 in milliseconds - the average time to generate each subsequent token. Lower values mean faster generation.
Server throughput statistics table: This table displays the throughput performance metrics for each concurrent load level.
Input Tok/sec: Input tokens processed per second. Higher values indicate better throughput.
Output Tok/sec: Output tokens generated per second. Higher values indicate better throughput.
Total Tok/sec: This is the total tokens (input + output) processed per second (a measure of overall system throughput).
Final thoughts
We have demonstrated the comprehensive benchmarking process detailing the production potential of Large Language Models on OpenShift. By combining vLLM and GuideLLM, organizations can measure critical, real-world metrics such as request throughput and latency, which are essential for achieving enterprise-grade readiness.
To continue your journey, dive deeper into GuideLLM and its capabilities by watching this technical overview. Explore an enterprise-grade, supported solution for your production workloads by reviewing the official documentation for Red Hat AI Inference Server.
Last updated: January 6, 2026