Imagine one of the following scenarios:
- Your kids are going on vacation with their grandparents; you want to increase their cell phone plan with more bandwidth and gigabytes so you can see them enjoy the beach through a video call with your parents.
- You’re on a business trip and you're relying on your company’s telco provider for roaming.
But you can’t do either of those things, because there’s an issue with the mobile application provider. Enter Red Hat Technical Account Management to assist in this situation.
Diagnosing the problem
Let’s add a little more context. A telecommunications service provider (telco) provides a mobile application whose front end targets Red Hat's single-sign on (SSO) tool to authenticate and authorize users to either pay plans or enlarge plans.
The issue occurred after the company decided to "eliminate certain users." But something else had changed in the production system, and nobody knew what that was.
After realizing that there was more to the situation than just deleting users, all parties agreed that the priority was to resuscitate production systems. This meant having the single sign-on tool up and running. The steps taken meant scaling down both Red Hat single sign-on pod and the PostgreSQL pod. Once the database pod was up and running, the next step was tuning the requests and limits (because SSO runs on top of Red Hat OpenShift) and changing the garbage collection algorithm.
Here’s a little snippet of what the Technical Account Management team proposed (note these are not the exact values used and might not be suitable to your needs):
resources:

          limits:

            cpu: "2"

            memory: 16Gi

          requests:

            cpu: "2"

            memory: 16Gi
Environment variables JAVA_MAX_MEM_RATIO and JAVA_INITIAL_MEM_RATIO are added to reserve more heap of the requested memory; by default, the Java images and the heap only take a quarter of the memory assigned to the pod.
JAVA_MAX_MEM_RATIO=75

JAVA_INITIAL_MEM_RATIO=100.
The environment variable JAVA_OPTS_APPEND is added to change the default garbage collection algorithm to use G1.
JAVA_OPTS_APPEND = -XX:-UseParallelOldGC -XX:+UseG1GC -XX:+ExplicitGCInvokesConcurrent -XX:MaxGCPauseMillis=500So, after proposing these changes and rolling out the pods, the production system was up and running and everyone was happy with the result. The telco's customers managed to authenticate and use the application for a while. But after a couple of hours, the team realized there was an issue between the mobile front-end application and the single sign-on technology. So, the Technical Account Manager was then summoned back to the war room.
The challenge was that no one knew where the issue was occurring. After much debate with the developers of the application, it was understood that the issue was between the code on the front end and Red Hat's single sign-on technology. They reported it as a loop in between these two components.
From the Red Hat single sign-on side, it was relevant to prove to the telco which URL or method was invoked so that they could point it on their code.
Collecting data using Java Flight Recorder
The Technical Account Manager proposed using Java Flight Recorder (JFR), which lets you see “under the hood” when the systems are productive. Java Flight Recorder is an open source tool that is bundled with the JDK, meaning it has a very low overhead. JFR is a feature available in OpenJDK builds, including the Red Hat build of OpenJDK. Therefore, it is possible to start capturing data with a “live pod.” More details on this knowledge-centered service (KCS): How to use JDK Flight Recorder (JFR)?
The team had two choices:
- Edit the
JAVA_OPTS_APPENDto include certain parameters so that when the pod begins it starts recording (something likeJAVA_OPTS_APPEND= -XX:-UseParallelOldGC -XX:+UseG1GC -XX:+ExplicitGCInvokesConcurrent -XX:MaxGCPauseMillis=500 -XX:StartFlightRecording=duration=200s,filename=flight.jfr) This means that the pods would be rolled out with this configuration and only start a 200 seconds recording. - Start all of the replicas of Red Hat single sign-on, connect to each pod via a terminal (Terminator, to be specific) , and send the signals to start the recording.
The solution
Option 2 is the better choice, because the recording starts when the front end pod of the mobile app is started, and allows us to capture data we need once the external front-end pod is started. (Details on how to connect to a live pod are provided on the KCS; basically, grab the Java PID (the command $JAVA:_HOME/BIN/jcmd will output the process ID of Java processes), and then on the same terminal, execute the following command:
$JAVA:_HOME/BIN/jcmd PID JFR.start settings=profile,filename=/path/flight.jfr,duration=200s After the capture process is finished, you must send the signals to jfr.stop and jfr.dump to write the contents to disks, making sure they are not corrupt. The command-line tool for OpenShift client oc fits perfectly with all of our command executions (rsh to connect to pods and execute the JFR commands). We can use oc rsync to extract the JFR files from the path we used. Once these files are in your local file system, you can analyze them with the Java Mission Control tool.
The recording for the front-end pod can’t be publicly shown, but it was revealed that there was a bug on the front-end application (and many others), which caused the loop on the authentication process. This was evident to see in the method profiling and the times accumulated in the methods. Once these were detected and hotfixed, the application worked perfectly. Red Hat's single sign-on tool and Technical Account Management were key to the success of this situation.
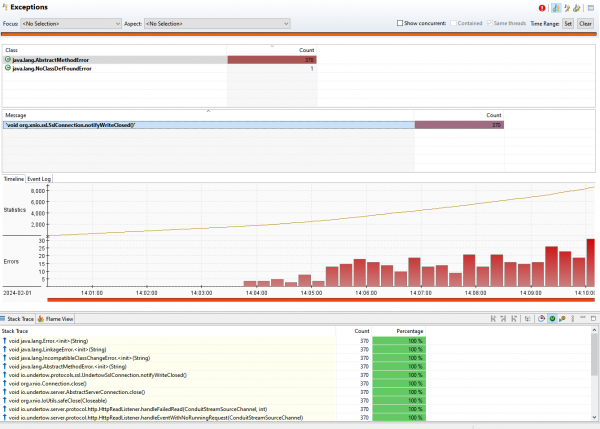
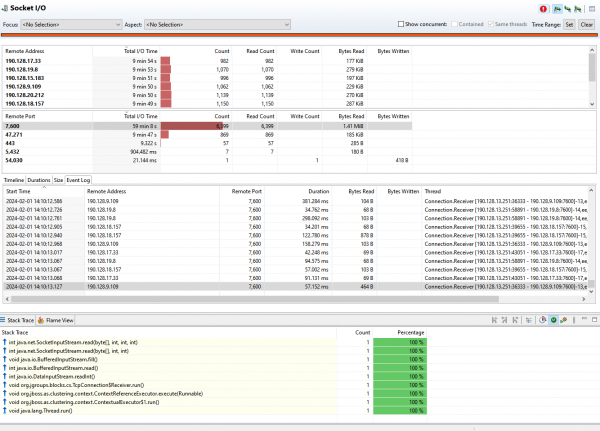
As a bonus, the Java Mission Control GUI revealed the already explained need to update the product, as shown in Figures 1 and 2. This data revealed certain exceptions and excessive times on classes related to Infinispan, a key component to cache sessions.


