Cryostat is a tool for managing JDK Flight Recorder data on Kubernetes. Version 2.1 of Cryostat introduces the option of using a sidecar reports container to generate automated analysis reports for JDK flight recordings. Previously, the main Cryostat container handled the report generation. Report generation is a resource-intensive operation, and as a result, users may find themselves overprovisioning the Cryostat container to meet peak resource demands. Those resources may in turn end up unused if you're not generating reports.
With this new option to delegate report generation to a sidecar container, users will find it easier to provision resources more efficiently. When report generation is not a concern, the main Cryostat container, including its web server and various lightweight operations over HTTP and JMX, has only a small resource footprint. Based on their report generation workflow, users can provision resources to the sidecar reports container accordingly and spin up any number of replicas of that container.
This article explores the process of setting up sidecar report container replicas for automated analysis report generation using Cryostat on Red Hat OpenShift.
Prerequisites for using a sidecar container
To get started, use a running OpenShift or Kubernetes cluster with the Cryostat Operator installed. If you don’t already have access to an OpenShift or Kubernetes cluster, try Red Hat OpenShift Local. This article utilizes the OpenShift UI to interact with the Cryostat Operator.
Then, deploy a containerized Java application with Java Management Extensions (JMX) enabled and exposed running in the same namespace as the Cryostat Operator. To learn more about how to fulfill this requirement by creating a sample Quarkus application, refer to the Red Hat Developer article Configuring Java applications to use Cryostat.
Create the Cryostat resource with the sidecar reports container enabled
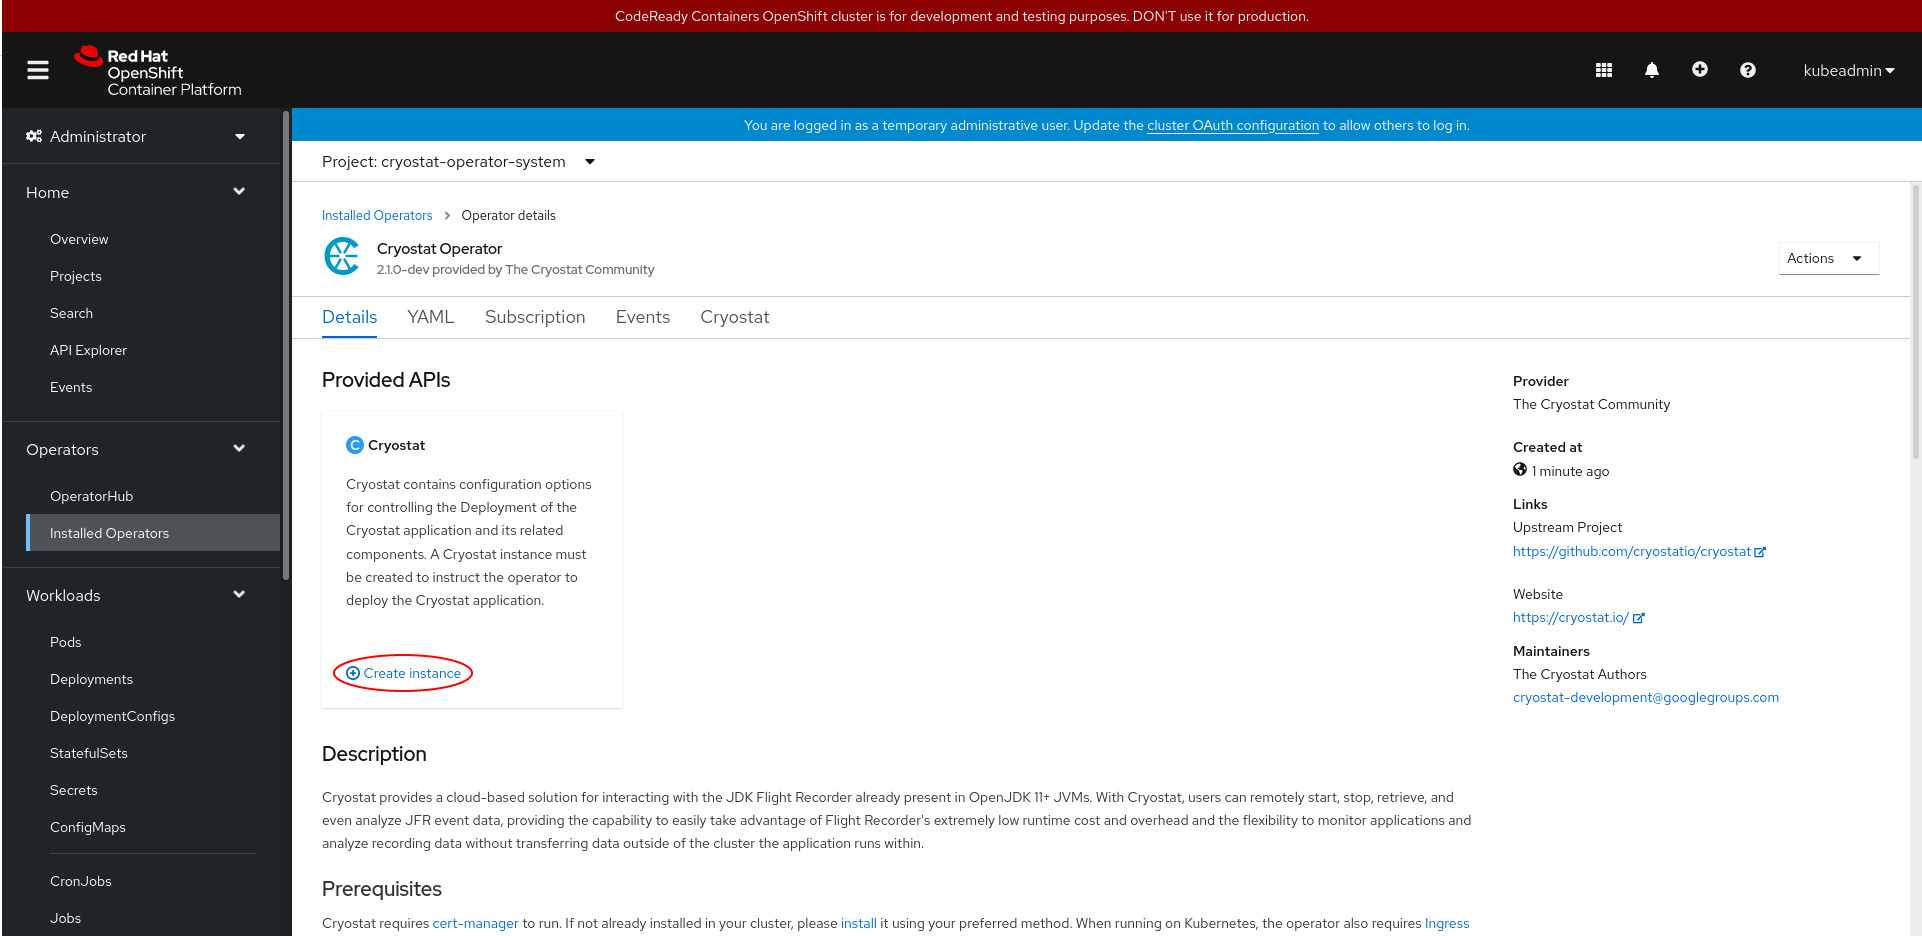
Once the Cryostat Operator is installed, setting up the sidecar reports container is a straightforward process. Navigate to the Cryostat Operator under the Installed Operators tab on the OpenShift web console, then create an instance of the Cryostat resource (see Figure 1).
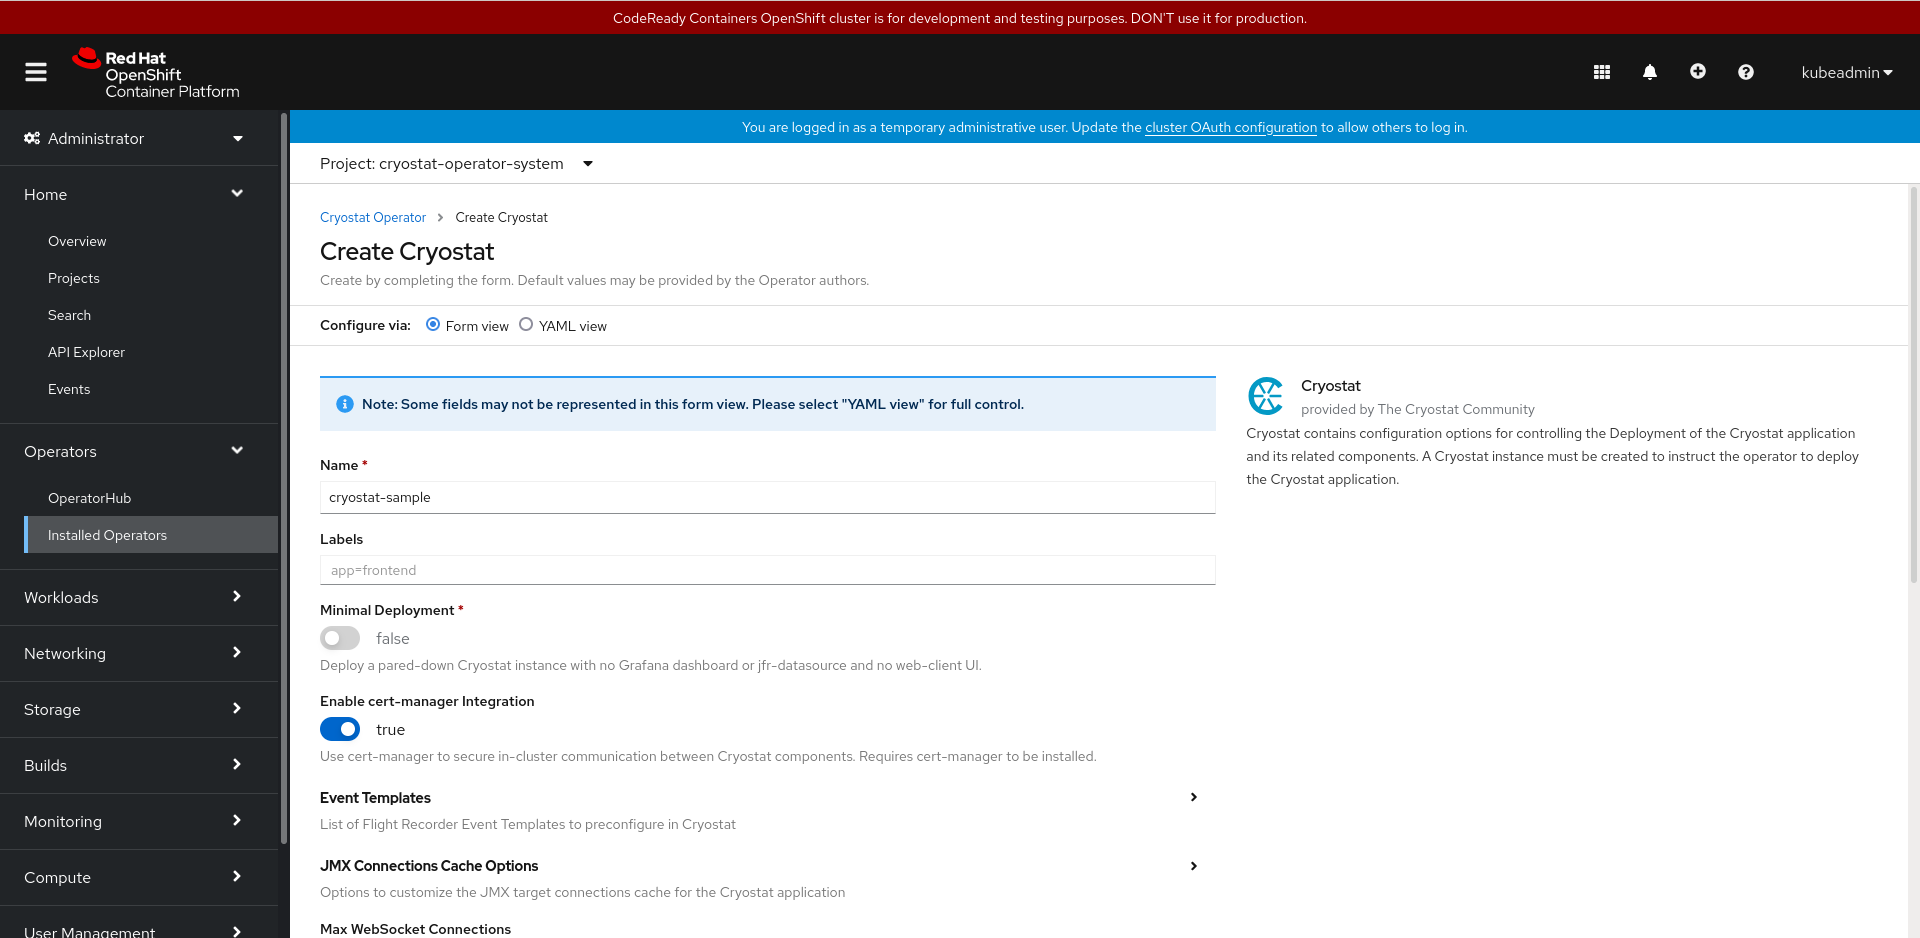
This will direct you to the Create Cryostat page, which provides various configuration options as shown in Figure 2.
Scroll down to select Report Options followed by Resources (see Figure 3).
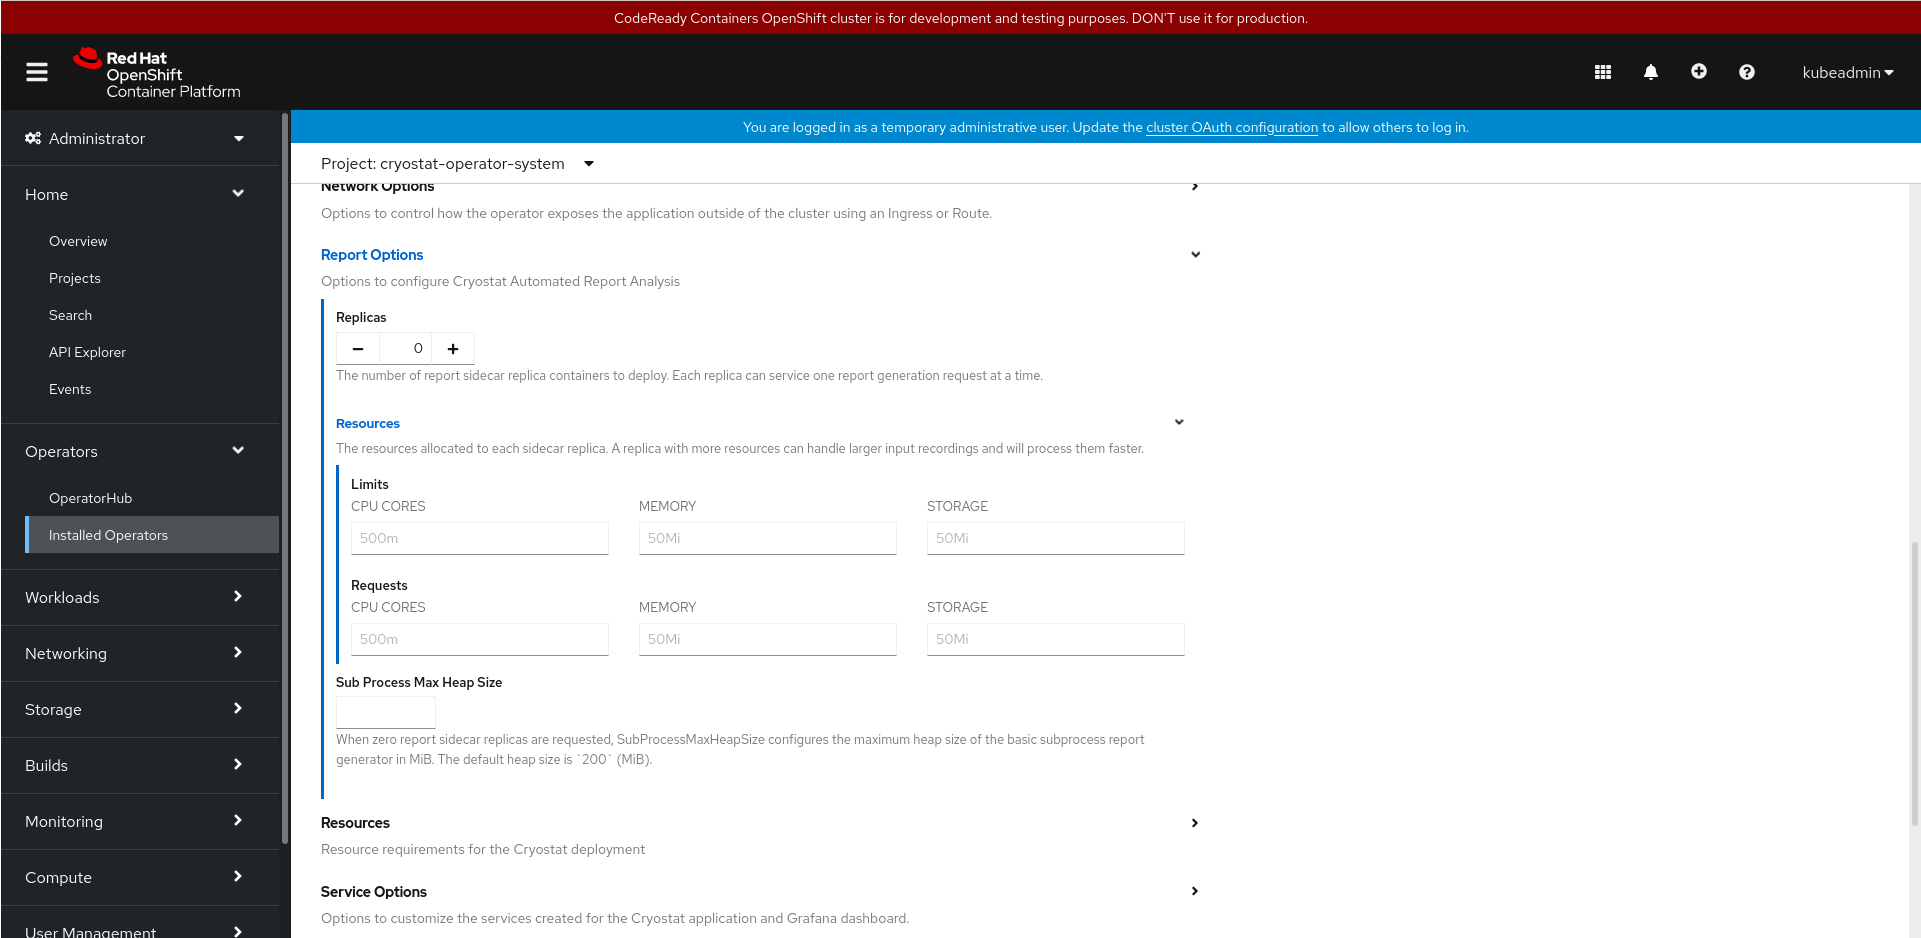
Next, select the number of replicas of the reports sidecar container to deploy and configure the Limits and Requests resources for each replica. The default number of replicas is 0, meaning the main Cryostat container handles the report generation through a sub-process. The default maximum heap size of this sub-process is 200MiB, but the user can adjust the maximum limit as needed. The Sub Process Max Heap Size field will be ignored if you request at least one reports sidecar container replica.
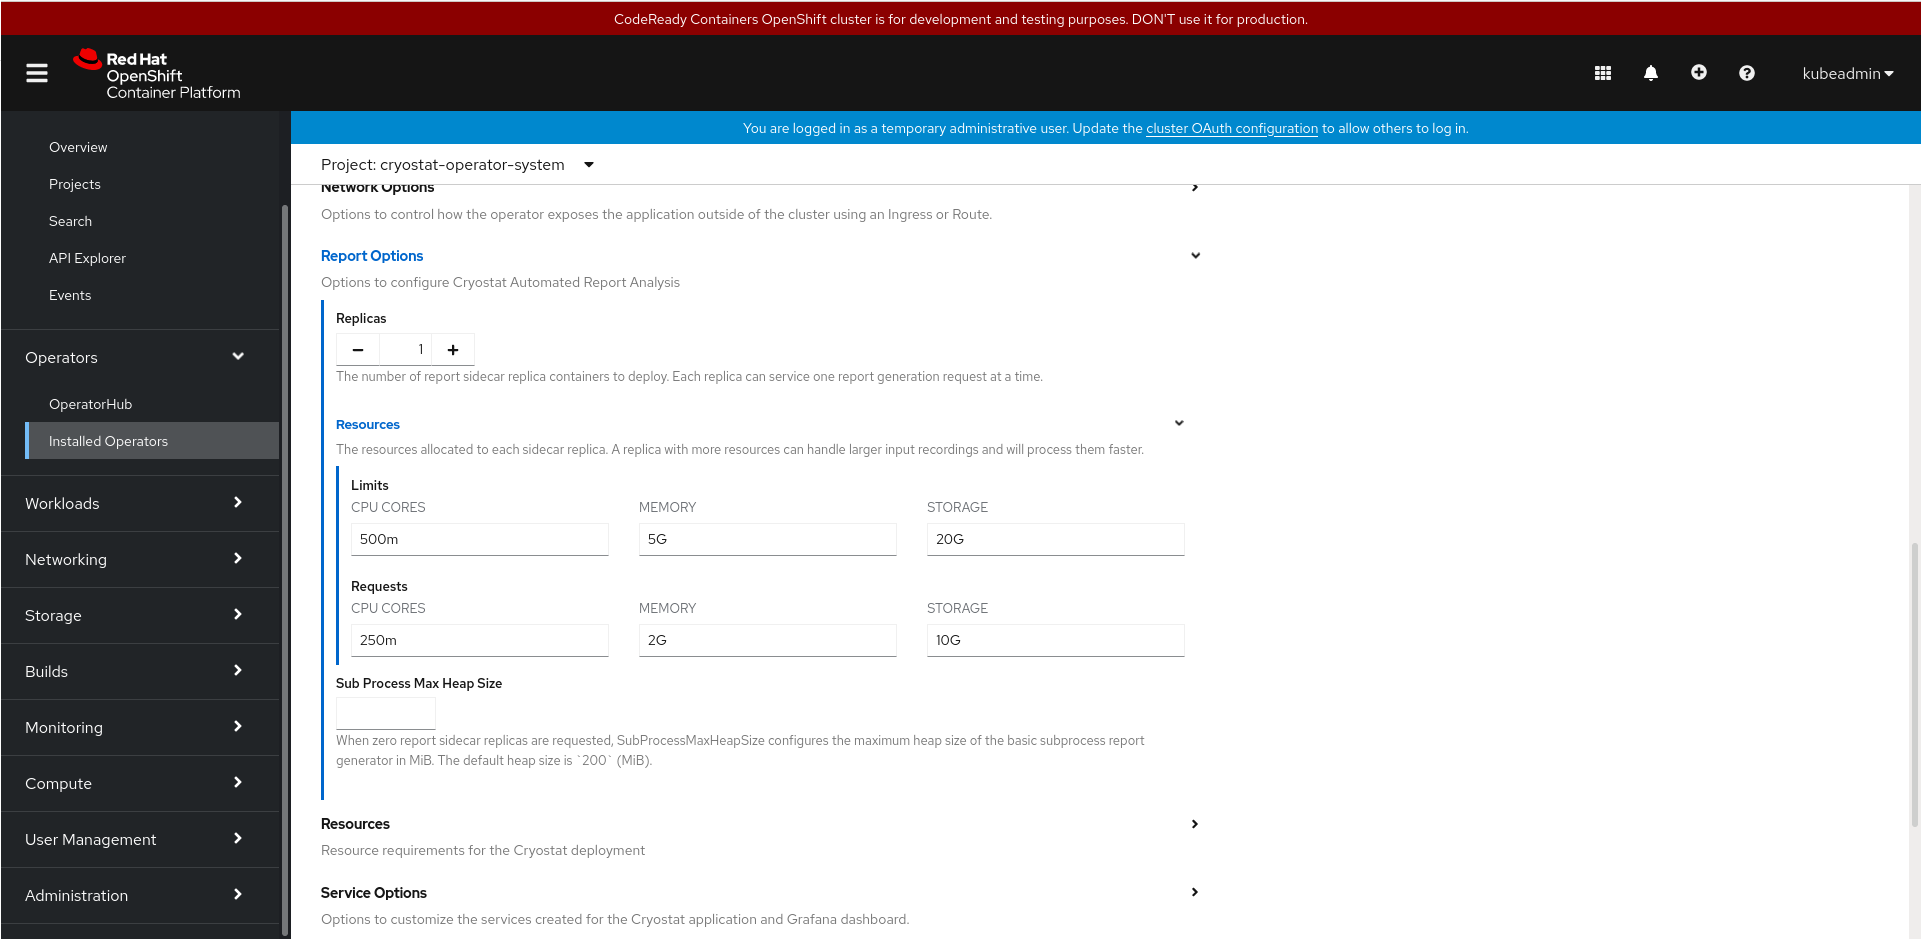
For this example, you should create the Cryostat instance using the report options configuration shown in Figure 4.
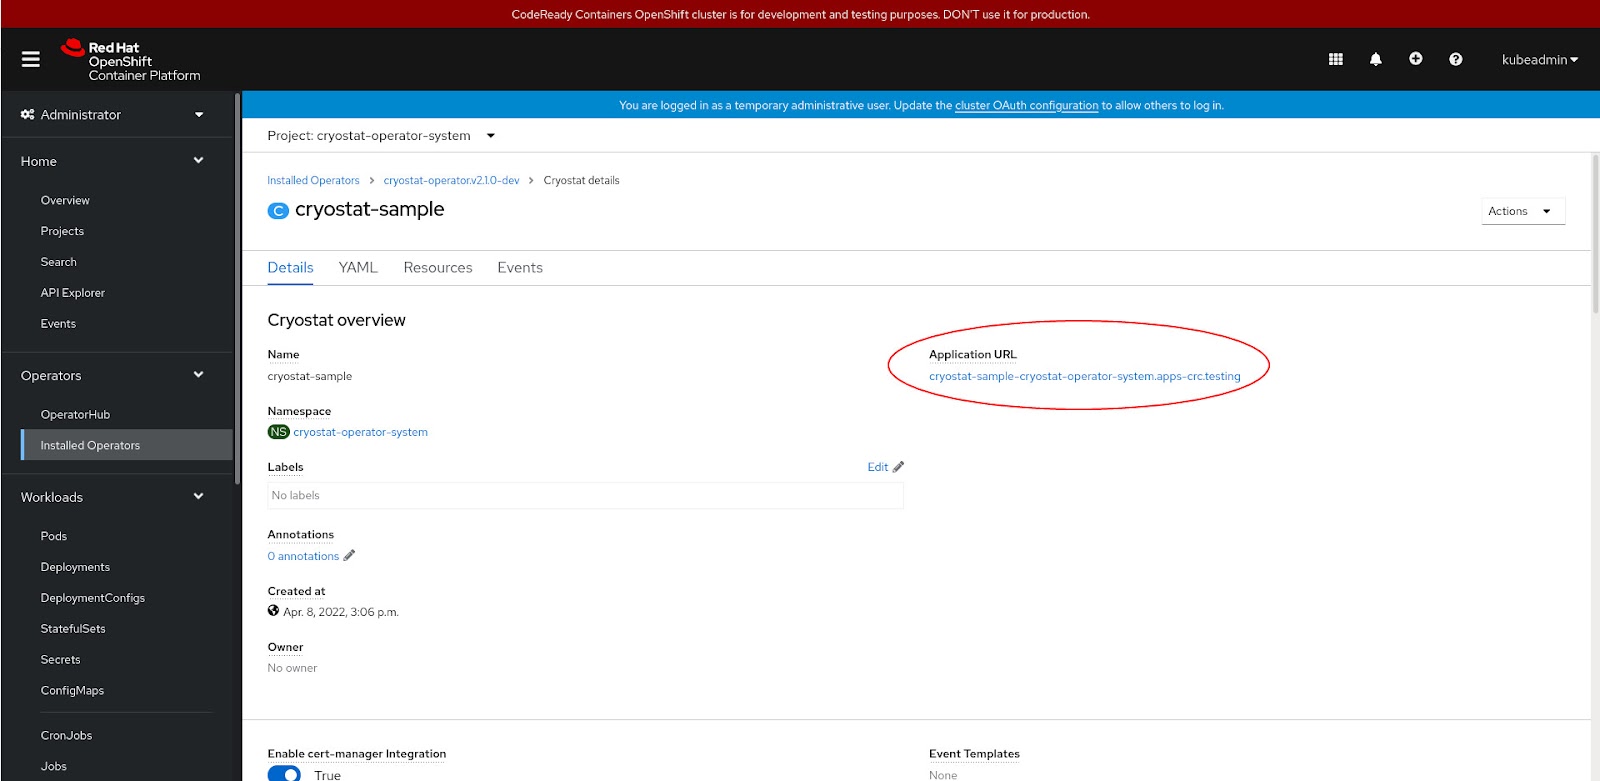
To generate the automated analysis report, navigate to the Cryostat web client. From the Cryostat Operator page under Installed Operators, select the Cryostat tab and then select the cryostat-sample resource. On the resulting page, you can find the URL for the web client (Figure 5).
A prompt will request your cluster credentials to authenticate with the web client. After logging in, select a target application (whether it’s of your own making or the sample Quarkus application we linked to above) and navigate to the Recordings tab (Figure 6). Create a fixed duration custom flight recording. Once it is finished, request an automated analysis report of the recording. For a more detailed walk-through of these steps, refer to the Guides on using Cryostat.

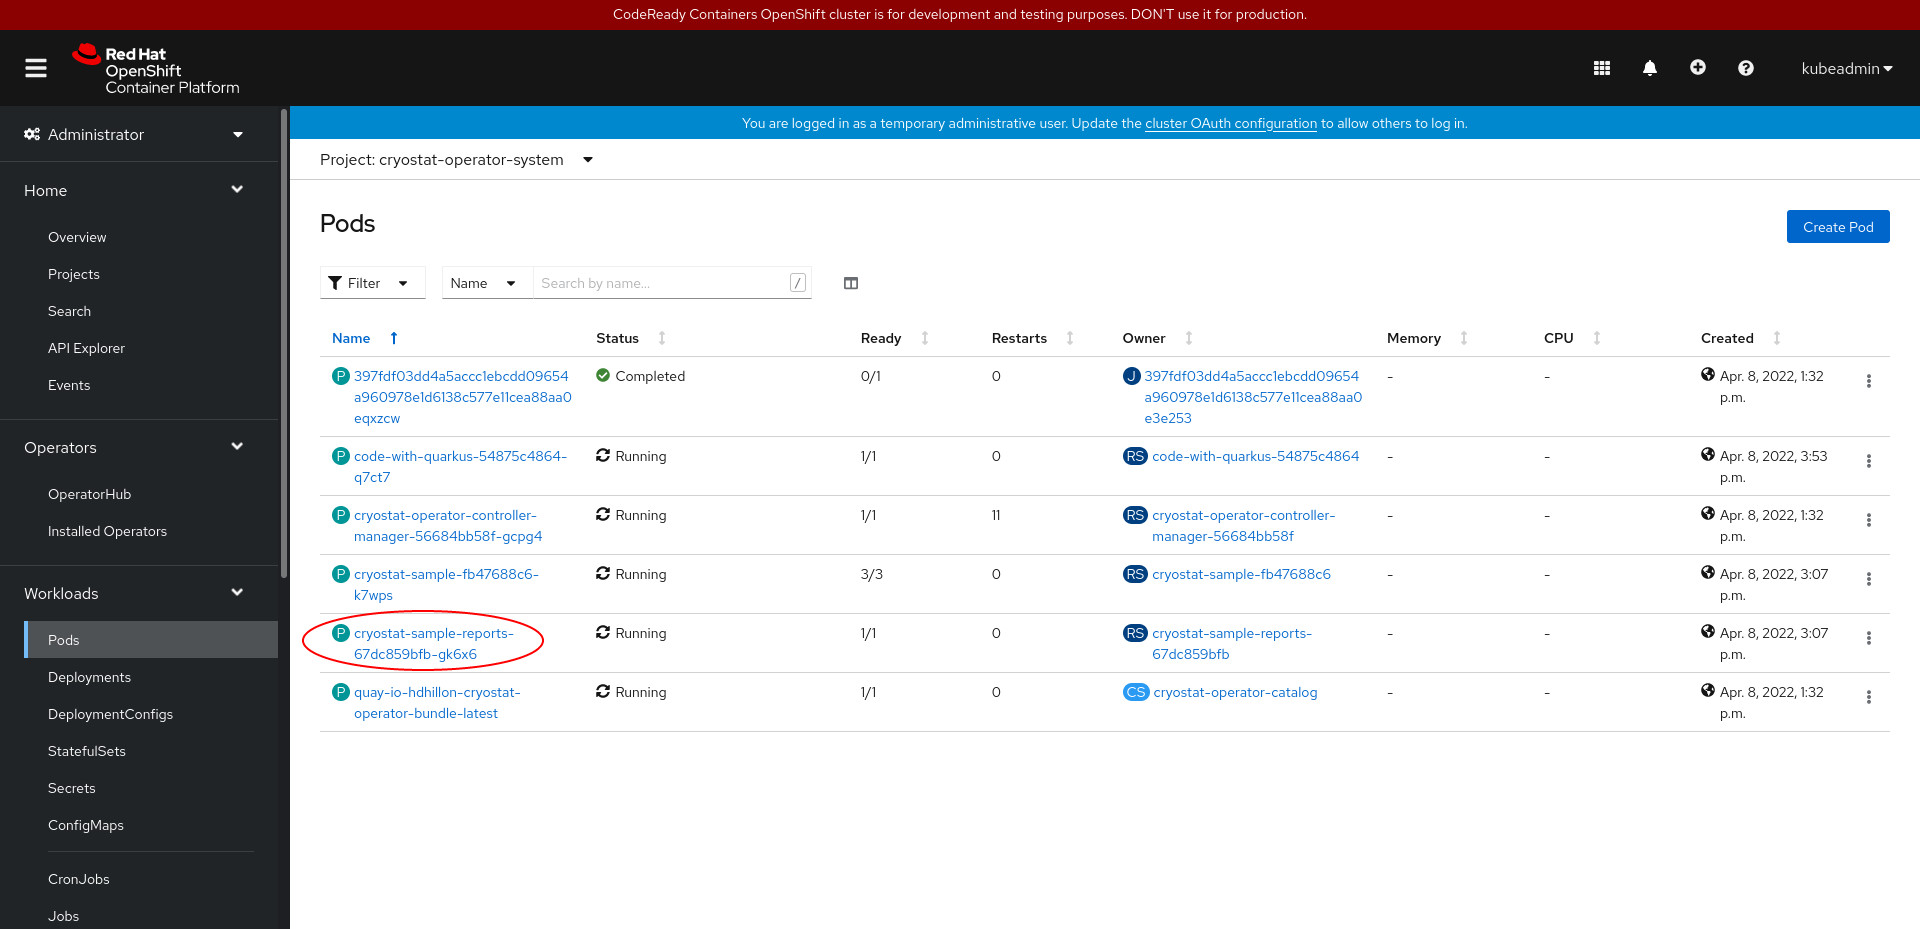
To double-check that the sidecar report container handled the report generation, go back to the OpenShift console and navigate to Pods under the Workloads tab. This is where you can find the pod containing the sidecar report container (see Figure 7).
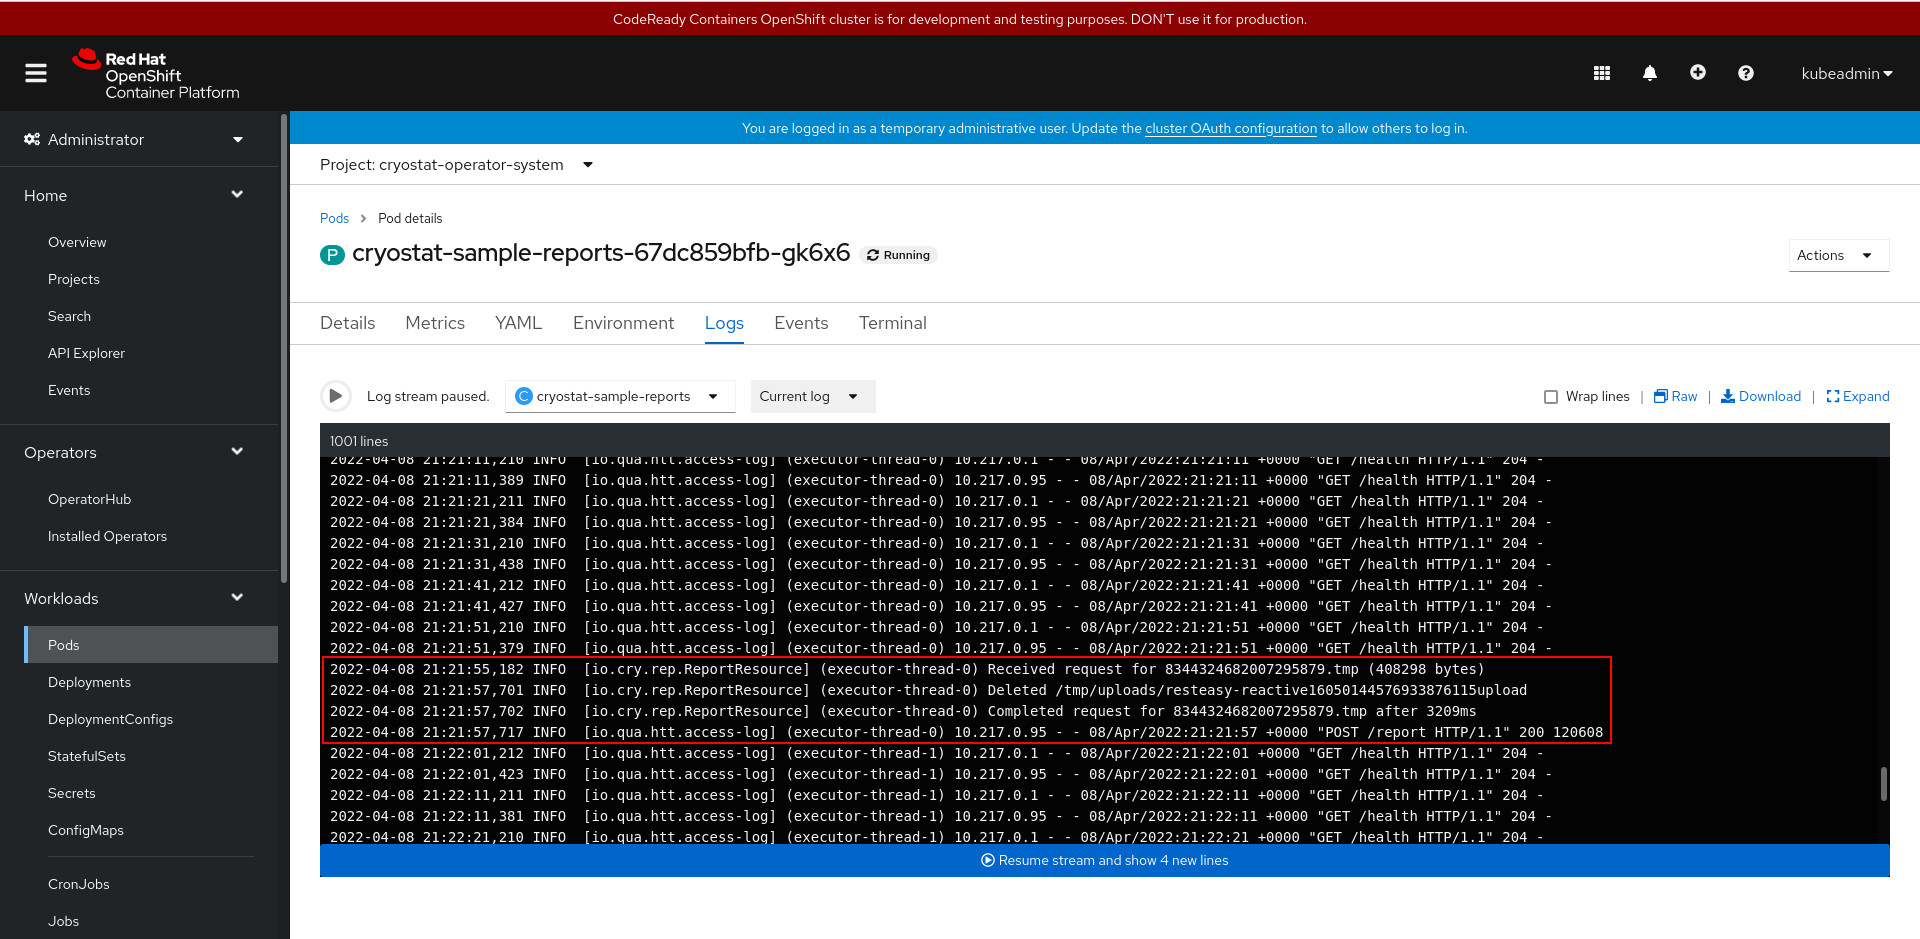
Next, go to the Logs tab, shown in Figure 8, and pause the log stream. Then scroll through the repeated HTTP GET /health requests to locate the log messages confirming that the sidecar reports container received and fulfilled an HTTP request from the main Cryostat container.
Conclusion
Using a sidecar report container for automated analysis report generation allows users to efficiently provision resources for Cryostat. For more information about Cryostat, visit cryostat.io. For questions, comments, and feedback, feel free to connect with us on GitHub or join our mailing list.
Find more Cryostat tutorials on Red Hat Developer:
Last updated: November 6, 2023