Application programming interfaces (APIs) are the core system of most services. Client, web, and mobile applications are all built from APIs. They sit on the critical path between an end-user and a service, and they're also used for intra-service communication.
Because APIs are so critical, API performance is also essential. It doesn’t matter how well-built your front-end application is if the API data sources it accesses take several seconds to respond. This is especially true in a world of microservices, where services depend on each other to provide data. In my opinion, the best feature your API can offer is great performance.
To measure API performance, you need to benchmark your APIs as reliably as possible, which can be challenging. The optimal approach depends on your performance objectives. In this article, I'll guide you through an elegant process for measuring the performance of backend applications running on Red Hat OpenShift or Kubernetes. You'll also learn how to use Vegeta, a versatile HTTP load testing and benchmarking tool written in Golang. We will deploy Vegeta on OpenShift and run performance tests in both standalone and distributed modes.
Standalone benchmarking with Vegeta
To run performance tests, you'll need an API endpoint to test. I've provided a simple Go-based application that you will deploy on OpenShift. Once the application is deployed, we'll apply various loads using Vegeta, as Figure 1 illustrates.

You can follow along with this example on your own OpenShift cluster if you have access to one; otherwise, you can use the Developer Sandbox for Red Hat OpenShift, which is free of charge with a Red Hat account.
Set up the example application
To begin, log in to your OpenShift cluster from the command line and run the following commands to create a simple GET API in Go.
oc new-project perf-testing
oc new-app golang~https://github.com/sclorg/golang-ex.git --name=golang-service1
oc expose deployment/golang-service1 --port=8888
oc expose service/golang-service1
oc get route golang-service1
curl http://$(oc get route golang-service1 -o json | jq  -r .spec.host)
Set up the Vegeta benchmarking environment
Next, install Vegeta on your local machine. Use this command if you're running macOS:
brew update && brew install vegeta
Use this command on Linux:
wget https://github.com/tsenart/vegeta/releases/download/v12.8.4/vegeta_12.8.4_linux_amd64.tar.gz -O /tmp/vegeta.tar.gz
tar -xvf /tmp/vegeta.tar.gz
sudo mv vegeta /usr/local/bin/
Launch your benchmarking process
Now, you're ready to launch the benchmarking process:
echo "GET http://$(oc get route golang-service1 -o json | jq -r .spec.host)" | vegeta attack -duration=60s | vegeta report
How to read the Vegeta output
Vegeta's output is largely straightforward; here's an example:
## Output

Requests      [total, rate, throughput]         3000, 50.02, 49.84
Duration      [total, attack, wait]             1m0s, 59.978s, 214.968ms
Latencies     [min, mean, 50, 90, 95, 99, max]  204.638ms, 217.337ms, 214.49ms, 222.256ms, 227.075ms, 394.248ms, 492.278ms
Bytes In      [total, mean]                     51000, 17.00
Bytes Out     [total, mean]                     0, 0.00
Success       [ratio]                           100.00%
Status Codes  [code:count]                      200:3000
Error Set:
Some of the more important metrics here are:
- Requests: The total number of requests, their rate per second, and their throughput.
- Latencies: The time taken to send the requests and the time taken to wait for the response.
- Success: The percentage of requests that were successful.
- Status Code: The status code and the number of requests that were successful.
To summarize the output of this first test: When we attempted to access the single pod of the service golang-service1 over the internet, we found a mean latency of around 217 milliseconds at 50 requests per second. This is a good indication that the application is working as expected.
Testing API performance with Vegeta
Now, let's get more serious. Run a test with 64 parallel workers, without any throttling or rate-limiting:
echo "GET http://$(oc get route golang-service1 -o json | jq -r .spec.host)"| vegeta attack -duration=60s -rate=0 -max-workers=64 | vegeta report
Here's the output:
## Output

Requests      [total, rate, throughput]         17908, 298.44, 297.38
Duration      [total, attack, wait]             1m0s, 1m0s, 214.692ms
Latencies     [min, mean, 50, 90, 95, 99, max]  201.543ms, 214.793ms, 214.57ms, 222.524ms, 224.861ms, 228.75ms, 563.581ms
Bytes In      [total, mean]                     304436, 17.00
Bytes Out     [total, mean]                     0, 0.00
Success       [ratio]                           100.00%
Status Codes  [code:count]                      200:17908
Error Set:
With the load increased to 64 threads, we got a mean latency of around 214 milliseconds at 298 requests per second—a rate per second that's six times higher than what we saw in the previous test. The latency basically stayed constant (it actually dipped just a bit) as the number of requests per second increased, which is great.
Note: We are stress-testing a Golang app running on a single pod, hosted on a shared OpenShift cluster over the internet (in this case, the cluster is hosted on the Developer Sandbox). This is just an example to show you how to quickly run a performance test against your own application; it does not represent the real-world performance of any component.
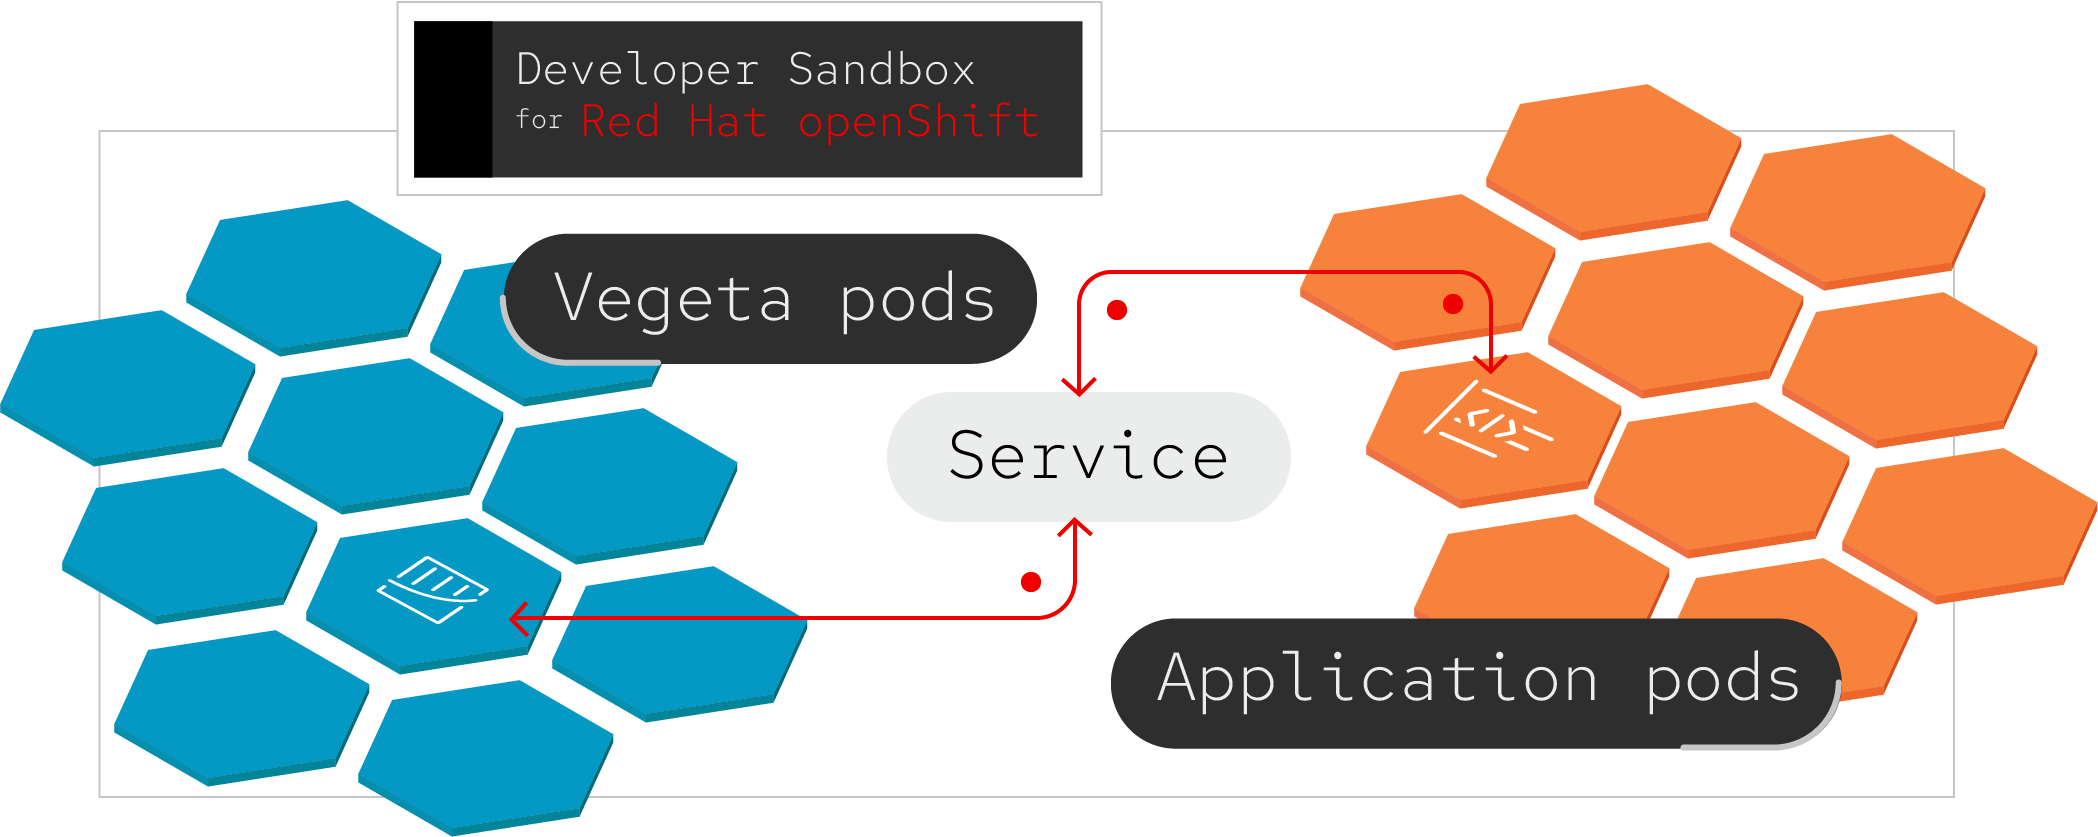
Benchmarking Kubernetes service names in a cluster
In the previous test, you benchmarked an internet-facing service endpoint. In this test, you'll use the locally accessible Kubernetes service name and run a performance test against that, as illustrated in Figure 2.

Launch Vegeta as a pod in the same namespace (project) as your service, then run the same test that you ran previously:
oc run vegeta --rm --attach --restart=Never --image="quay.io/karansingh/vegeta-ubi" -- sh -c \
"echo 'GET http://golang-service1:8888' | vegeta attack -duration=60s -rate=0 -max-workers=64 | vegeta report"
Here's the output:
## Output

If you don't see a command prompt, try pressing enter.
Requests      [total, rate, throughput]         732977, 12205.54, 12205.23
Duration      [total, attack, wait]             1m0s, 1m0s, 1.514ms
Latencies     [min, mean, 50, 90, 95, 99, max]  201.313µs, 3.133ms, 472.767µs, 1.751ms, 3.585ms, 80.58ms, 102.89ms
Bytes In      [total, mean]                     12460609, 17.00
Bytes Out     [total, mean]                     0, 0.00
Success       [ratio]                           100.00%
Status Codes  [code:count]                      200:732977
Error Set:
The service is now seeing about 12,000 requests per second, and the mean latency is 3 milliseconds. These improved results should come as no surprise: All the traffic is staying within OpenShift, unlike the previous test in which Vegeta connected to the Golang service over the internet.
A distributed load test for parallel containerized workloads
Next, let's try a benchmarking test that's closer to a real-world example. You'll run the same test again, using the Golang application's Kubernetes service name. But this time, you'll launch multiple Vegeta pods, all hammering your backend microservice in parallel, as illustrated in Figure 3.
Start by scaling the Go application deployment to 10 replicas, which should make things more interesting:
oc scale deployment/golang-service1 --replicas=10
The best way to launch a distributed load test is to use OpenShift's Job object, which provides the flexibility to launch parallel containerized workloads. Create a YAML file named vegeta-job.yaml with the following content. This sets parallelism to 10 pods, which will launch 10 Vegeta pods, which will in turn launch attacks on the Golang service:
apiVersion: batch/v1
kind: Job
metadata:
  name: vegeta
spec:
  parallelism: 10
  completions: 10
  backoffLimit: 0
  template:
    metadata:
      name: vegeta
    spec:
      containers:
      - name: vegeta
        image: quay.io/karansingh/vegeta-ubi
        command: ["/bin/sh","-c"]
        args: ["echo 'GET http://golang-service1:8888' ]
      restartPolicy: OnFailure
Apply this file to the OpenShift cluster:
oc create -f vegeta-job.yaml
Wait a minute or two for Vegeta to complete its test run. Then, execute the following command, which will import and aggregate the binary output files from all 10 Vegeta pods onto your local machine (where you installed the Vegeta binary at the beginning of this article) and generate a final performance report:
for i in $(oc get po | grep -i vegeta | awk '{print $1}') ; do oc cp $i:tmp/results.bin $i.bin & done ; fg
vegeta report *.bin ;
Here's the output from the distributed test:
## Output

Requests [total, rate, throughput] 5651742, 88071.28, 88070.66
Duration [total, attack, wait] 1m4s, 1m4s, 449.276µs
Latencies [min, mean, 50, 90, 95, 99, max] 69.075µs, 5.538ms, 1.476ms, 16.563ms, 27.235ms, 47.554ms, 333.121ms
Bytes In [total, mean] 96079614, 17.00
Bytes Out [total, mean] 0, 0.00
Success [ratio] 100.00%
Status Codes [code:count] 200:5651742
Error Set:
In this test, the Golang service delivered a mean latency of around 5.5 milliseconds at 88,070 requests per second, which works out to about 5.2 million requests per minute. That's pretty impressive performance.
Tidy up your environment
After my experiments, I like to clean up my system. You can tidy up your own machine with this command:
oc delete -f vegeta-job.yaml
oc delete project perf-testing
Conclusion
There is a great saying from the physicist and engineer Lord Kelvin: "If you cannot measure it, you cannot improve it." In this article, you've learned an elegant method for testing API performance in your distributed microservices applications. You can use the techniques introduced here to benchmark your next great backend microservice application running on OpenShift or Kubernetes.
Last updated: October 18, 2023