Page
Prerequisites and step-by-step guide

Prerequisites
- Login into the Red Hat developer sandbox. Register here if not already registered.
Step-by-step guide
1. Create a VM
In this learning exercise, we will configure the virtual machine using two methods. The first method is the "click-to-play" system, and the second method is using direct SSH connectivity with the virtual machine.
There are two methods to interact with virtual machines. If you created the virtual machine using Method 1, use Method 1 to connect with it under the "How to Connect with VM" section. Similarly, use Method 2 for virtual machines created using Method 2 to connect.
Method 1
To access the Red Hat Developer Sandbox Virtual Machine For RHEL VM, click “Red Hat OpenShift” tile “launch” button.
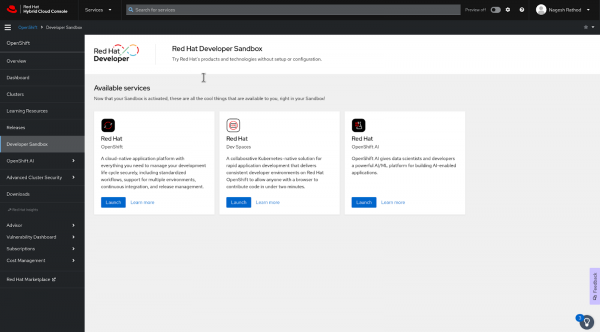
Figure 1: Red Hat hybrid cloud developer sandbox services. - Click the "Launch" button on the "Red Hat OpenShift" tile.
Log in to the Red Hat Developer Sandbox and click the "DevSandbox" button.
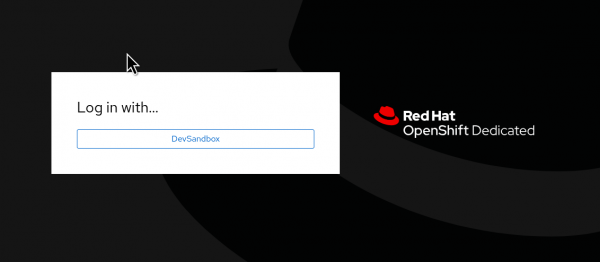
Figure 2: Login in DevSandbox. Switch to the Administrator perspective. Use the top left menu, as shown in the following Figure 3.
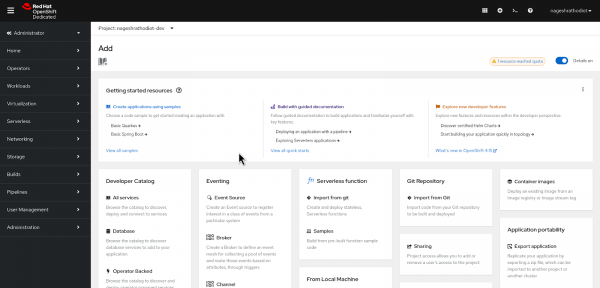
Figure 3: Red Hat Developer Sandbox Landing Page. Navigate to the "Virtualization" section and select "Virtual Machines." You will then arrive at a page similar to the one shown in Figure 4.
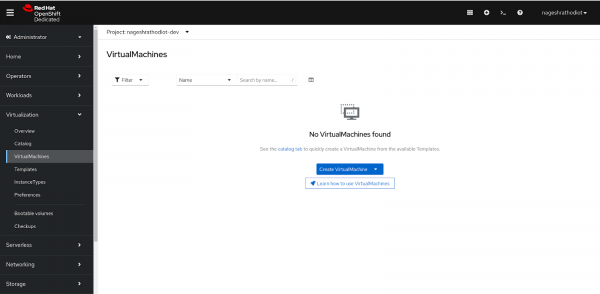
Figure 4: Virtual Machine Overview Page. Click on "Create VirtualMachine," then select the "From template" option from the dropdown menu.
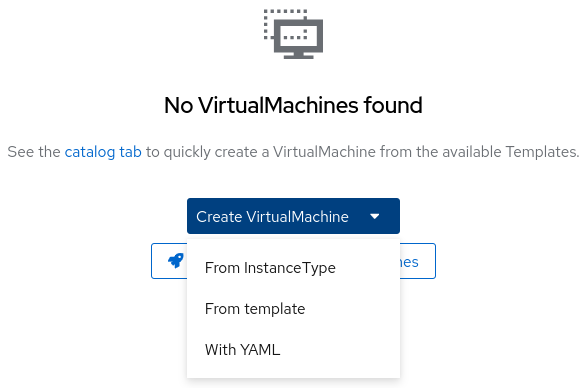
Figure 5: Selecting Virtual Machine Configuration Method. You will be directed to a Catalog page where you can select from various types of Virtual Machine images available in OpenShift Virtualization.
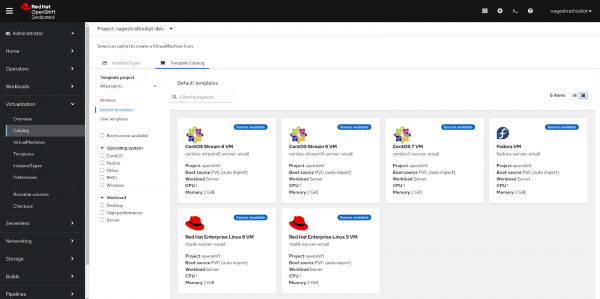
Figure 6: Selecting Virtual Machine Image. In this learning exercise, we will deploy the RHEL9 image. To do so, select "Red Hat Enterprise Linux 9 VM".

Figure 7: Virtual Machine Installation Page. Click on the "Quick Create VirtualMachine" button.
If you encounter any "namespace" related errors after clicking the "Quick Create Virtual Machine" button, it indicates that the Project has not been selected correctly. Ensure the projects are selected accurately, as shown in the following Figure 8.
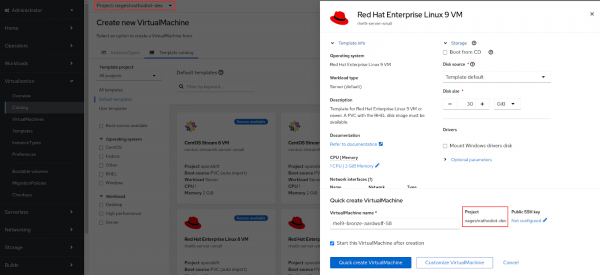
Figure 8: Selection of Project. After that you will land up on the overview page of the virtual machine which you provisioned. The status of the virtual machine will be “Provisioning”. Similar to the following Figure 9.
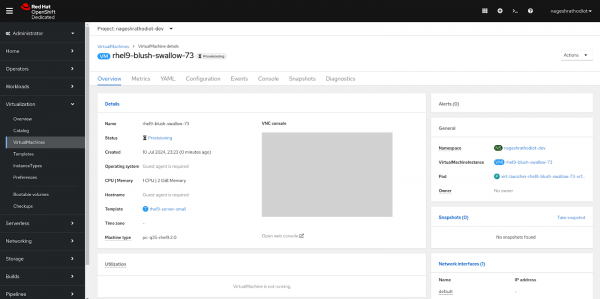
Figure 9: Virtual Machine in Provisioning status. After successfully fetching the image from the library, it will be available in "pvc". The status of the virtual machine will change from "Provisioning" to "Running", as shown in Figure 10.
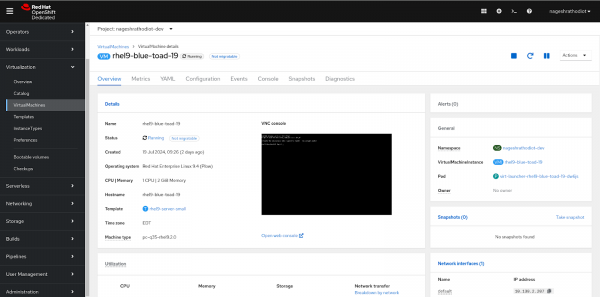
Figure 10: Virtual Machine in Running status. If you created a virtual machine using Method 1, ensure you follow the instructions under "Method 1" in the "How to Connect with the VM" section to interact with the virtual machine effectively.
Method 2
To configure the virtual machine, you can alternatively add an RSA key. To generate the RSA key, open the web terminal located in the top right corner of the Red Hat developer sandbox. Click on the “>_” icon, as shown in Figure 11.

Type the following command:
$ ssh-keygen -t rsa -f redhatPress the Enter key twice when prompted for a passphrase.
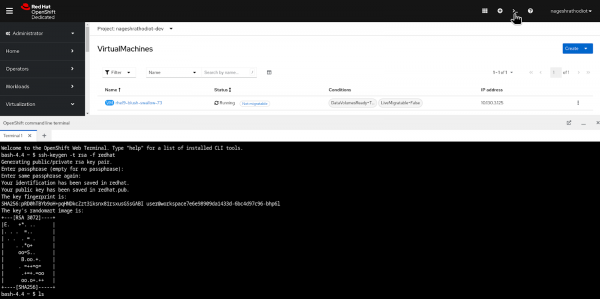
After creating the RSA SSH key, you need to check the generated keys.
$ ls
redhat  redhat.pub
Info alert: NOTE: Take a backup of the private key "redhat" on your local system by using the command “$ cat redhat” and saving the output to a text file. This is important because if the web terminal is accidentally closed or after a couple of hours, the web terminal (an ephemeral pod) will delete your key. Without the private key, you will lose SSH access to the VM and will need to create a new key pair, add it to the secret, and create a new VM.
The public key is now ready to integrate with the VM. Copy the content of the ".pub" file using the following command:
$ cat redhat.pubCopy the “redhat.pub” key content.
- Go back to the Catalog option under Virtualization.
Choose the Red Hat Enterprise Linux 8/9 image for your virtual machine.
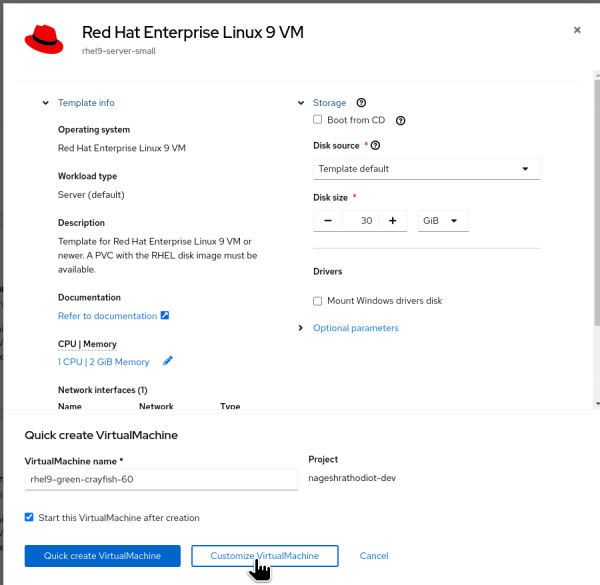
Figure 13: Selecting the "Customize Virtual Machine" option. Instead of selecting "Quick Create Virtual Machine," this time select "Customize Virtual Machine" to enable more customization during the virtual machine's configuration process.
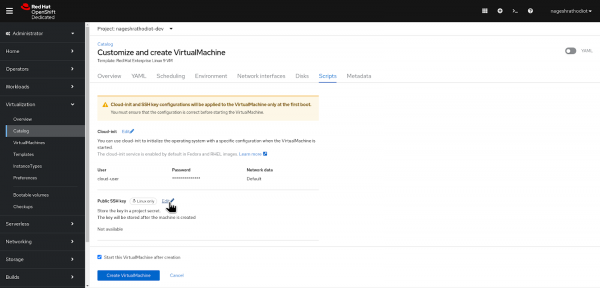
Figure 14: Adding SSH Key for Virtual Machine. - Switch to the “Scripts” tab as shown in the figure above.
- Select the “Edit” button under the “Public SSH key” section.
- Paste the public key (redhat.key) that was created earlier.
- Define the “Secret name” for your key.
Click on the Save button.

Figure 15: Saving SSH Public Key as Secret.
At the bottom, click on "Create VirtualMachine".
Once the VM is created, you will be redirected to its overview page. The VM's status will be in provisioning mode, similar to the following figure.

After a few minutes, the VM status will transition to the 'Running' status.
If you created a virtual machine using Method 2, ensure you follow the instructions under "Method 2" in the "How to Connect with the VM" section to interact with the virtual machine effectively.
2. How to connect with VM
To connect to a virtual machine, we have two options: 1) Using the Web Console 2) SSH method using Web Terminal.
Method 1: Using Web Console
From the left menu, navigate to Virtualization > VirtualMachines.
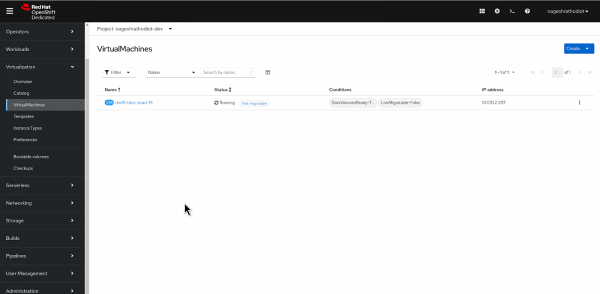
Figure 17: Listing available virtual machines. Select the recently created virtual machine.

Figure 18: Virtual Machine in Running Mode. - Switch from the “Overview” tab to the “Console” tab.
- Under “Guest login credentials,” you will find the username and password for the virtual machine.
Copy and paste these credentials into the terminal to successfully log in to the VM.
Similar as shown in the following Figure 19.

Figure 19: Logging into the Virtual Machine from Console.
Method 2: SSH method using Web Terminal
Retrieve the SSH command for the virtual machine from the running virtual machine, as shown in Figure 20.
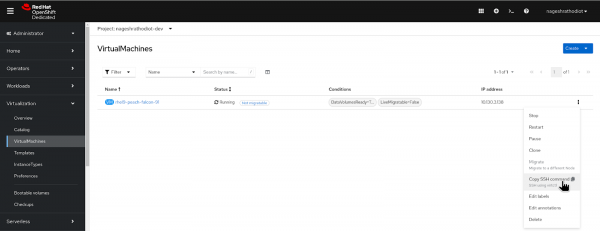
Open web terminal from developer sandbox similar as shown in the following image.

To SSH into Virtual machine paste the copied command from step above into the web terminal.
$ virtctl -n user-namespace-dev ssh
cloud-user@rhel9-peach-falcon-91 --identity-file=<path-to-ssh-key>
Replace the <path-to-ss-key> with “redhat” private key. For example as shown below.
$ virtctl -n user-namespace-dev ssh
cloud-user@rhel9-peach-falcon-91 --identity-file=redhat
It will ask to save the fingerprint, so type yes and press Enter.

In the upcoming section, you will execute more handy Linux commands, so make sure to run these commands in the "web_terminal," similar to the setup shown in Figure 22.
3. Linux commands
Command-line executables are vital tools for developers working on Linux operating systems. These commands, organized by category, streamline various tasks such as file management, system monitoring, and software installation. By utilizing these commands, developers can efficiently manage their development environment and workflow.
Commands:
Manipulating file contents
Complete the quote by redirecting the output of the "echo" command. The command below uses the append redirection operator (>>) to cause the output of the "echo command to be written to the end of the file quote.txt.
$ echo "makes it seem more manageable." >> quote.txtUse the "cat" command to quickly check what is in file quote.txt. The cat command is short for "concatenate", but it is much more versatile than that name suggests.
$ cat quote.txtExpected output:
makes it seem more manageable.The >> operator allows you to add to files from the command line and is particularly useful in shell scripting. You can also use it when a command has a lengthy output and you want to view that output in a text editor.
Use "ls" to take a look at the contents of the current directory:
$ ls
quote.txt
Info alert: NOTE: You may also encounter the > redirection operator. This operator will write the output to a file, overwriting the file if it already exists. By contrast, the >> operator will append the output to the specified file. The input operator (<) will redirect data as an input to whatever is called before the operator. The pipe operator (|) is used to send the output of one command to another command so that you can carry out an operation on the results of the first command.
Viewing the end of log files with 'tail'
Some files are large enough that it is not practical to display their contents with a "cat". A common example is log files, which are often packed full of information.
Since "tail" only displays the last ten lines of a file, it is particularly useful for viewing recent entries in log files. Take a look at the final ten lines of the audit log.
$ sudo tail /var/log/audit/audit.logExpected output:
type=SERVICE_STOP msg=audit(1654785357.108:201): pid=1 uid=0 auid=4294967295 ses=4294967295 subj=system_u:system_r:init_t:s0 msg='unit=user@0 comm="systemd" exe="/usr/lib/systemd/systemd" hostname=? addr=? terminal=? res=success'UID="root" AUID="unset"If you wish to then see the entire file, a text viewer like "less" or "view" will show the entire file.
Adding the -f option will follow the log file so that you can see new entries. Follow the system log for any new entries.
Expected output:
$ sudo tail -f /var/log/messagesExpected output:
<< OUTPUT ABRIDGED >>
Jul 15 22:37:26 6d5380e16498 NetworkManager[886]:  [1626403046.8294] device (ens5): Activation: failed for connection 'Wired connection 1'
Jul 15 22:37:26 6d5380e16498 NetworkManager[886]:  [1626403046.8298] device (ens5): state change: failed -> disconnected (reason 'none', sys-iface-state: 'managed')
Jul 15 22:37:26 6d5380e16498 NetworkManager[886]:  [1626403046.8343] dhcp4 (ens5): canceled DHCP transaction
Jul 15 22:37:26 6d5380e16498 NetworkManager[886]:  [1626403046.8343] dhcp4 (ens5): state changed timeout -> done
Enter ctrl-c to break out of this stream.
Expected output:
Dec  8 18:37:15 rhel systemd[1]: Started man-db-cache-update.service.
Dec  8 18:37:15 rhel systemd[1]: run-rcd7035fb3d1d4176bf081e5732f65f65.service: Succeeded.
The "logger" command will make entries to the system log from provided input. From the terminal, write to the log:
$ logger Hello WorldCheck that this message was recorded.
$ sudo tail /var/log/messagesExpected output:
Jul 15 22:39:06 6d5380e16498 dnf[3679]: Metadata cache created.
Jul 15 22:39:06 6d5380e16498 systemd[1]: dnf-makecache.service: Succeeded.
Jul 15 22:39:06 6d5380e16498 systemd[1]: Started dnf makecache.
Jul 15 22:42:07 6d5380e16498 root[3693]: Hello World
The message you just sent with logger is present in messages.
The message you just sent with the "logger" is present in messages.
Locating files
Manipulating files is only useful if you can locate the file you need. This step will walk you through two commands that are useful for this, "locate" and "find".
The "find" command is great for searching for files which satisfy some specified criteria. This step will show an example using the filename, but you can also use it to look for files with certain permissions, empty files, or much more.
$ sudo find / -name messagesExpected output:
/var/log/messagesThe output is the full path to the file. If there are multiple matches, then this output would have multiple lines and it would be up to the user to decide which is the appropriate file. Instead of having to search through countless directories, you can quickly locate the file.
Info alert: Note: An in-depth explanation of using "find" to sort by file permissions is included in the File Permissions Basics lab.
Create a new file with "touch":
$ touch newFileAllow a user to view and traverse the content of a file or stdout.
The command "more" invokes itself within a distinct command-line user interface. To exit the process users press the q key.
This example uses the "more" command to display the first four lines of the file /etc/passwd. Users can then traverse the rest of the file one line at time by pressing the <enter> key:
$ more -4 /etc/passwdExpected output:
root:x:0:0:root:/root:/bin/bash
bin:x:1:1:bin:/bin:/sbin/nologin
daemon:x:2:2:daemon:/sbin:/sbin/nologin
adm:x:3:4:adm:/var/adm:/sbin/nologin --More--(5%)
This example shows use of the "more" command to process stdout data. The example pipes the result of running "ls" against the directory /etc. The command "more" displays the first four lines of the output from stdout as declared in the option -4. Users can traverse through the rest of stdout, a line at time, by pressing the <enter> key:
$ ls /etc | more -4Expected output:
DIR_COLORS
DIR_COLORS.lightbgcolor
GREP_COLORS
NetworkManager
-MORE-
Searching for text within files and outputs
"find" is great if you are looking for a file based on some criteria, but if you instead want to locate specific file contents, the "grep" command is what you need. To illustrate this, search for the words you added to the messages log file. The command below uses the -r option to search recursively from the starting directory (/var/log). This will return all locations in any file residing in a subdirectory of /var/log that contain the string "Hello World".
$ sudo grep -r "Hello World" /var/logExpected output:
/var/log/messages:Jul 16 21:38:22 be3f7e9f7264 root[24468]: Hello WorldThe output shows the line you added using "logger" earlier in this lab. If you do not specify a search location in the "grep" command, it will default to your current directory. Additionally, the string being searched for is case-sensitive by default. If you want a case-insensitive search, add the -i option.
$ sudo grep -ir "hello world" /var/logExpected output:
/var/log/messages:Jul 16 21:38:22 be3f7e9f7264 root[24468]: Hello WorldThis option can save you from believing that a string does not exist if you weren't sure about how it was capitalized in the file.
Using 'df' to check disk usage
A large part of a system administrator's job is to be able to diagnose what is causing a system to misbehave. Disk space being full can lead to unexpected behavior, so the "df" command is great to include in any troubleshooting session.
The "df" command, short for "disk free", shows a breakdown of disk usage. The -h option will present the sizes in a human readable format:
$ df -hExpected output:
Filesystem             Size  Used Avail Use% Mounted on
devtmpfs               890M     0  890M   0% /dev
tmpfs                  909M     0  909M   0% /dev/shm
tmpfs                  909M  8.5M  901M   1% /run
tmpfs                  909M     0  909M   0% /sys/fs/cgroup
/dev/mapper/rhel-root   35G  4.5G   30G  14% /
/dev/vda1             1014M  197M  818M  20% /boot
tmpfs                  182M     0  182M   0% /run/user/0
The usage percentage (Use %) column is a great place to start. If any filesystem is close to capacity, then it may be unable to perform installations or other operations that require data to be written. However, the absolute size of the partition will determine what "close to capacity" means. In the case of this system, the root partition is 35 GiB. Therefore, even if it is at 80% usage, the filesystem will still have 7 GiB to work with. Probably something you need to address eventually, but unless you are doing some storage-intensive operation that is failing, likely not the cause of immediate issues.
The boot partition is on the other end of the spectrum, with a size of only 1014 MiB. Therefore, if this filesystem is at 80% usage, there will only be 200 MiB available. That may not be enough for basic operations such as installing system updates. Therefore, it is very concerning if you run "df" and discover one of the smaller filesystems is at 80% usage.
Info alert: NOTE: The tmpfs entries are filesystems accessible by the machine that are stored in RAM. This means that you don't have to care as much about these file systems when troubleshooting using "df". A reboot will give you a fresh copy of these filesystems.
Networking
Get or post a file to or from the Internet using a specific URL.
This example downloads a web page from the Red Hat Developer website and implements the -o option to save the page to the file article.html:
curl
https://developers.redhat.com/articles/2022/01/11/5-designprinciples-microservices -o article.html
Expected output:
  % Total    % Received % Xferd  Average Speed   Time    Time     Time  Current
                                 Dload  Upload   Total   Spent    Left  Speed
100  224k    0  224k    0     0   124k      0 --:--:--  0:00:01 --:--:--  124k
The following example returns the IP address information associated with network interfaces on the current machine:
$ ip addrExpected output:
1: lo: <LOOPBACK,UP,LOWER_UP> mtu 65536 qdisc noqueue state UNKNOWN group default qlen 1000
    link/loopback 00:00:00:00:00:00 brd 00:00:00:00:00:00
    inet 127.0.0.1/8 scope host lo
       valid_lft forever preferred_lft forever
    inet6 ::1/128 scope host
       valid_lft forever preferred_lft forever
2: eth0: <BROADCAST,MULTICAST,UP,LOWER_UP> mtu 8951 qdisc fq_codel state UP group default qlen 1000
    link/ether 02:70:41:00:00:94 brd ff:ff:ff:ff:ff:ff
    altname enp1s0
    inet 10.0.2.2/24 brd 10.0.2.255 scope global dynamic noprefixroute eth0
       valid_lft 86306482sec preferred_lft 86306482sec
    inet6 fe80::70:41ff:fe00:94/64 scope link noprefixroute
       valid_lft forever preferred_lft forever
Viewing processes
Just as files organize how data is stored on Linux, processes organize all of the programs that are running on the system. The "ps" command (short for Process Status) will display information about the processes running in the current shell. To see all of the processes running on the system and present them in a user-readable format, it is common to add the aux options to "ps".
$ ps auxExpected output:
root           1  0.0  0.7 186400 14448 ?        Ss   15:38   0:11 /usr/lib/systemd/systemd --switched-root --system --deserialize 17
root           2  0.0  0.0      0     0 ?        S    15:38   0:00 [kthreadd]
root           3  0.0  0.0      0     0 ?        I<   15:38   0:00 [rcu_gp]
root           4  0.0  0.0      0     0 ?        I<   15:38   0:00 [rcu_par_gp]
root           6  0.0  0.0      0     0 ?        I<   15:38   0:00 [kworker/0:0H-events_highpri]
root           9  0.0  0.0      0     0 ?        I<   15:38   0:00 [mm_percpu_wq]
root          10  0.0  0.0      0     0 ?        S    15:38   0:00 [ksoftirqd/0]
root          11  0.0  0.0      0     0 ?        I    15:38   0:00 [rcu_sched]

<< OUTPUT ABRIDGED >>
Info alert: NOTE: There is another lab which goes into depth about "ps" and process management. For more info on using "ps" (including how to end processes), check out the Service Administration Basics lab.
The output of this command is often very lengthy, so this is a great chance to apply what you just learned a few steps ago. Using the pipe operator (|), pipe the output of "ps aux" into the grep command to search for a specific process. Search for the "sshd" process:
$ ps aux | grep sshdExpected output:
root        1441  0.0  0.2  16120  9688 ?        Ss   14:35   0:00 sshd: /usr/sbin/sshd -D [listener] 0 of 10-100 startups
root        1708  0.0  0.0   6412  2116 pts/0    S+   14:47   0:00 grep --color=auto sshd
Here the search finds the "sshd" process, but the second line of this output shows that the search also finds itself.
"ps" is great for showing a snapshot of the active processes and their resource usage, but sometimes it is more useful to have a utility that keeps updating this information in real time. "top" does just that.
$ topExpected output:
top - 21:11:07 up  4:10,  2 users,  load average: 0.45, 0.16, 0.06
Tasks: 114 total,   1 running, 113 sleeping,   0 stopped,   0 zombie
%Cpu(s):  0.0 us,  0.3 sy,  0.0 ni, 99.3 id,  0.2 wa,  0.2 hi,  0.0 si,  0.0 st
MiB Mem :   1817.0 total,   1135.0 free,    181.5 used,    500.5 buff/cache
MiB Swap:   4000.0 total,   4000.0 free,      0.0 used.   1482.2 avail Mem

  PID USER    PR  NI   VIRT   RES   SHR S %CPU %MEM    TIME+ COMMAND
 2940 root    20  0       0     0     0 I  0.3  0.0  0:00.01 kworker/u4:2-flush-253:0
15893 root    20  0   65416  4736  3952 R  0.3  0.3  0:00.04 top
    1 root    20  0  187008  4968  9800 S  0.0  0.8  0:03.06 systemd
    2 root    20  0       0     0     0 S  0.0  0.0  0:00.01 kthreadd
    3 root     0 -20      0     0     0 I  0.0  0.0  0:00.00 rcu_gp
In addition to the process info, "top" includes some status information:
- The system uptime
- Total number of user accounts
- 1 minute, 5 minute, and 15 minute load averages
- The total number of tasks and a breakdown of their status counts
- The kinds of tasks using the CPU
- A breakdown of memory and swap usage
Info alert: NOTE: For more information on the top preamble, visit section 2 of the top man page.
This output will continue updating until you quit "top". To quit top press q.
Using 'free' to view information about the system memory usage
Processes require memory to run, so when the system is running low on free memory it can slow down significantly. The "free" command is useful for quickly getting a summary of memory usage.
$ free -hThe -h option outputs the information in a human-readable format.
Expected output:
           total       used      free    shared   buff/cache  available
Mem:       1.8Gi       156Mi     1.2Gi   16Mi     430Mi       1.5Gi
Swap:      3.9Gi       0B        3.9Gi
Let's launch "top" again but this time we'll run it in the background by adding a &.
$ top &Expected output:
top &
[1] 3567
If the available memory is very low, the fourth column of "ps au" can be used for finding which processes are the culprits. To sort the output by memory usage, add the --sort=-%mem option:
$ ps au --sort=-%memExpected output:
USER         PID %CPU %MEM    VSZ   RSS TTY      STAT START   TIME COMMAND
root        3566  0.0  0.1  61648  4028 pts/0    R+   19:46   0:00 ps -au --sort=-%mem
root        2406  0.0  0.1  26112  3816 pts/0    Ss   19:05   0:00 /bin/bash
root         805  0.0  0.0  16224  2112 ttyS0    Ss+  18:57   0:00 /sbin/agetty -o -p -- \u --keep
root         804  0.0  0.0  13656  1676 tty1     Ss+  18:57   0:00 /sbin/agetty -o -p -- \u --nocl
Suppose you no longer needed "top" and wanted to free up the resources being used by this process. One option would be to return to the terminal that it is running in and quit it. However, it is simpler in most cases to use the "kill" command. The process ID shown in the "ps" output is how you refer to the process when killing it. Kill the process running "top" command from the terminal:
$ kill -9 $(pidof top)Here's what you should see in the terminal.
Expected output:
root@rhel:~# ps -au
USER         PID %CPU %MEM    VSZ   RSS TTY      STAT START   TIME COMMAND
root         820  0.0  0.0  13656  1716 tty1     Ss+  18:33   0:00 /sbin/agetty -o -p -- \u --nocl
root         821  0.0  0.0  16224  2060 ttyS0    Ss+  18:33   0:00 /sbin/agetty -o -p -- \u --keep
root        2533  0.0  0.1  26112  3760 pts/0    Ss   18:48   0:00 /bin/bash
root        2696  0.0  0.1  51632  3812 pts/0    T    18:52   0:00 top
root        2698  0.0  0.1  58728  3944 pts/0    R+   18:53   0:00 ps -au
This does not show any output, but you can see that "top" is no longer running.
More information on process management can be found in the Service Admin Basics lab.
Console and output management commands
The "which" command in Linux is used to locate the executable file associated with a given command. Following example shows the binary used for "clear" command:
$ which clear
 /usr/bin/clear
The following command displays the contents of the system-release file that describes the version of RHEL, CentOS, or Fedora that’s running:
$ cat /etc/system-release
Red Hat Enterprise Linux release 9.4 (Plow)
Environment variables commands
The following command creates an environment variable named WEB_PAGE and sets the value to "https://www.redhat.com/en". The "echo" command displays the value of the environment variable:
$ export WEB_PAGE="https://www.redhat.com/en"
$ echo $WEB_PAGE
https://www.redhat.com/en
The following example uses "printenv" to print the value of the environment variable HOSTNAME:
$ printenv HOSTNAME
rhel9-peach-falcon-91
The following example uses the "cat" command to create a file named new_vars.sh. The file contains an export command for the environment variable ALT_USER=barry. Then, the "source" command is called to set the environment variable into the system. The "echo" command verifies that the environment variable ALT_USER is set:
$ cat <<EOF > new_vars.sh
> #!/bin/bash
> export ALT_USER=barry
> EOF
$ source ./new_vars.sh
$ echo $ALT_USER
barry
Clears the terminal screen
$ clearEnvironment variables commands Commands in this section apply to working with a Linux computer’s environment variables.
$ env | more
SSH_CONNECTION=192.168.86.20 54276 192.168.86.34 22
LANG=en_US.UTF-8
HISTCONTROL=ignoredups
HOSTNAME=localhost.localdomain
Pressing the 'Enter' key will explore all logs on the screen, and pressing the 'q' key will exit.
File and directory management
Copy the contents of the source directory or file to a target directory or file.
The following example copies the contents of the file helloworld.txt to the file named helloworld.bak.
$ cp helloworld.txt helloworld.bakMove a file or directory. The mv command transfers all the contents from the source file or directory to the new location.
This example moves the directory documents to the directory docs-bak. When "move" command is invoked, the source directory will be renamed docs-bak:
$ mv documents docs-bakDisplay the name of the current working directory. The following example displays the invocation and result of using the command "pwd" in the HOME directory for a user named user:
$ pwd
/home/user
Remove a file or directory.
This example removes the file named new_hithere.txt from the current directory:
$ rm new_hithere.txtCreates a new directory named documents in the user’s home directory:
$ mkdir ~/documentsNavigate to the directory using "cd" command:
$ cd ~/documentsHelp command
Display the internal help documentation for a given command.
The following example shows how to display the command-line help documentation for the command "cp":
$ man cp
Summary
In this learning exercise, you created a virtual machine in the Red Hat Developer Sandbox using OpenShift Virtualization. You explored various methods to configure and connect to the virtual machine. Additionally, you activated a free developer subscription for an RHEL server and tried most commonly used Linux commands on it. This hands-on experience helps you understand the setup, configuration, and management of virtual machines in an OpenShift environment.
