Page
Multi-container applications
The goal of this exercise is to build a containerized multi-tier application–four tiers in this case–in a Red Hat OpenShift cluster. This application will help you learn about clustered containers and distributed systems. It will teach you about Kubernetes and how it operates with the principles of defined state and actual state. It constantly monitors the environment and attempts to make the actual state match the defined state..
In order to get full benefit from taking this lesson, you need:
- The GitHub command-line interface.
- The following GitHub repositories:
By the end of this lesson, you will:
- Understand the uses of multi-container applications.
- Internalize the difference between orchestration and application definition.
- Command basic container scaling principles.
- Use tools to troubleshoot containers in a clustered environment.
Multi-container workloads: A multi-tiered application
The goal of this exercise is to build a containerized multi-tier application in an OpenShift cluster. This application will help you learn about clustered containers and distributed systems. It will teach you about Kubernetes and how it operates with the principles of defined state and actual state–it constantly monitors the environment and attempts to make the actual state match the defined state.
In Kubernetes/OpenShift, applications are defined with either JSON or YAML files. Either file format can be imported or exported. You can even convert between the two. In this lab, we will use YAML files.
Essentially, the application definition files are a collection of software-defined objects in Kubernetes. The objects in the file are imported and become a defined state for the application.
Important objects include:
- Deployments: The top-level object that manages the instantiation, scaling, and state of an application.
- Pods: Collections of one or more containers.
- Services: An internal object that represents the port/daemon/program running.
- Routes: Expose services to the external world.
Developers and architects can group these objects/resources in a single file to make sharing and deployment of the entire application easier. These definitions can be stored in version control systems just like code. Let's inspect some of the Kubernetes resource definitions we will use for this lab.
Deploy the MongoDB database
Begin by cloning or downloading the four GitHub repositories that represent the four layers of our application. Run the following four commands:
git clone https://github.com/redhat-developer-demos/quotesforudatabase

git clone https://github.com/redhat-developer-demos/getquoteslistforu

git clone https://github.com/redhat-developer-demos/triviahhh-api-gateway

git clone https://github.com/redhat-developer-demos/triviahhh-web
Move into the /quotesforudatabase directory to continue. Now look at the objects/resources that define the application. Run the following two commands:
cat quotesdb_secrets.yaml

cat quotesdb.yaml
While there are two YAML files used, they could easily be put into one YAML file. Keeping the secrets separate, however, is a good idea. Looking at the file quotesdb_secrets.yaml, you will notice some notable entries. The labels are important when it comes to managing objects. To learn more about labels, Red Hat Developer has another learning path, Using Red Hat OpenShift labels. Visit that learning path if you’re interested in more about labels.
At the bottom of the YAML file, you will notice credentials for the MongoDB database. Each entry is Base-64 encoded and not encrypted. These entries are used by the deployment, which is explained in the section. Looking at the contents of the file quotesdb.yaml, you will notice that the environment variables are set using the values in the secret that is created by the quotesdb_secrets.yaml file.
A service named quote is created in the YAML. This is the name of the service that is running the MongoDB database. Note that the name does not need to be significant. You could name it foo, and it would still work. You will, however, later refer to it by name. You could have multiple instances of MongoDB running in your cluster, each with a different name and different credentials. That’s handy to know.
The MongoDB service (quote) does not have a route, which is an external URL. This is because you will only be referencing this service inside your cluster, by its name: quote. The rest of the contents simply install an ephemeral version of a MongoDB database.
Deploying this database involves three steps:
- Create the secrets.
- Create the MongoDB instance.
- Create and populate the database table.
Create the secrets
Run the following command:
oc create -f quotesdb_secrets.yamlCreate the MongoDB instance
Run the following command:
oc create -f quotesdb.yamlCreate and populate the database table
Run the following command:
If using Bash:
./buildDB.shIf using PowerShell:
./buildDB.ps1As an optional step to prove your work, run the following command:
oc exec $(oc get pods --selector app=quote -o custom-columns=NAME:.metadata.name --no-headers) -- mongosh -u admin -p quote --authenticationDatabase admin --eval 'use quote' --eval 'db.quote.find()'Now that the ephemeral MongoDB instance is up and running, run the following command to see which Persistent Volume Claim (PVC) it is using.
oc get pvcThe result may be surprising. No resources (PVCs) found.
This is because the instance of MongoDB is ephemeral. It is using the file system inside the pod. This is simple and useful for development, but keep in mind that when the pod is destroyed, the data is deleted. In production, you would create a PVC, bind to it, and put your MongoDB data there.
To learn more about using a PVC for data storage, visit this Red Hat Developer learning path: Store persistent data in Red Hat OpenShift using PVCs.
Deploy the data access layer
The next layer in our four-tier architecture is the data access layer. For this layer, a microservice will be deployed that accepts a REST request and returns data from the MongoDB service.
Move into the /getquoteslistforu directory that you created when you cloned the repository. Feel free to view the contents of the file deployment.yaml. You will notice that a prebuilt Linux image, quay.io/rhdevelopers/getquoteslistforu:latest, is being pulled into the OpenShift cluster. You will also notice that the environment variable MONGODB_URI is set to mongodb://quote:quote@quote/quote.
If you were to use a different name for the earlier MongoDB service, this value would change accordingly. Also, once the application is deployed, you can easily change the value of this environment variable by using the oc set command. Think about how easy that makes testing, migrations, and updates.
Notice that in this case, only one YAML file is being used. The file deployment.yaml contains three objects:
- ImageStream
- Deployment
- Service
This layer does not contain a route, which is an external URL. This is because this service is only used inside the OpenShift cluster. Later, an API gateway service will be made publicly available to our web application, and that API gateway will access this data layer.
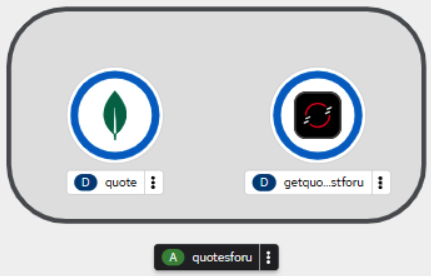
To create the data access layer, run the following command:
oc create -f deployment.yamlIf you visit the web-based OpenShift dashboard, you will see something like Figure 1:
Deploy the API gateway
The third part of our four-part architecture is the API gateway. Move into the /triviahhh-api-gateway directory that resulted from the previous git clone operation.
Again, we will be using one YAML file, deploy.yaml, to deploy a prebuilt Linux image. In this instance, we are introducing a new object: Route.
The route is a URL that is external to the OpenShift cluster. That is to say, it is open to the world. The resulting URL will be used in our front-end web application so it can access the API gateway, which calls the data access layer, then the MongoDB database, and returns data.
Note:
In a production environment, you may want to use an API management tool, such as Red Hat 3scale API Management.
Take a look inside the file deploy.yaml and notice the image being used, the ports being used, and the lack of any environment variables.
In this case, the name and port numbers used to access the data access layer are hard-coded into this Quarkus app. A bad idea, to be sure, but done to illustrate the point that you are in control of naming and can, if you wish, hard-code values.
To deploy the API gateway, run the following command:
oc create -f deploy.yamlIf you look at your dashboard, you will see a third container appear (Figure 2):
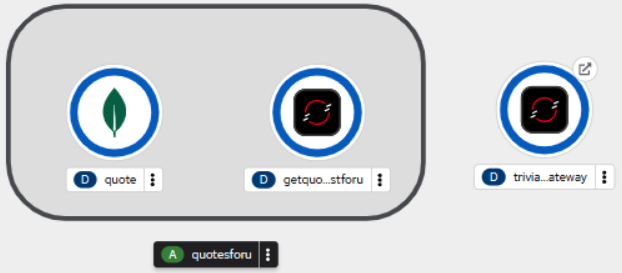
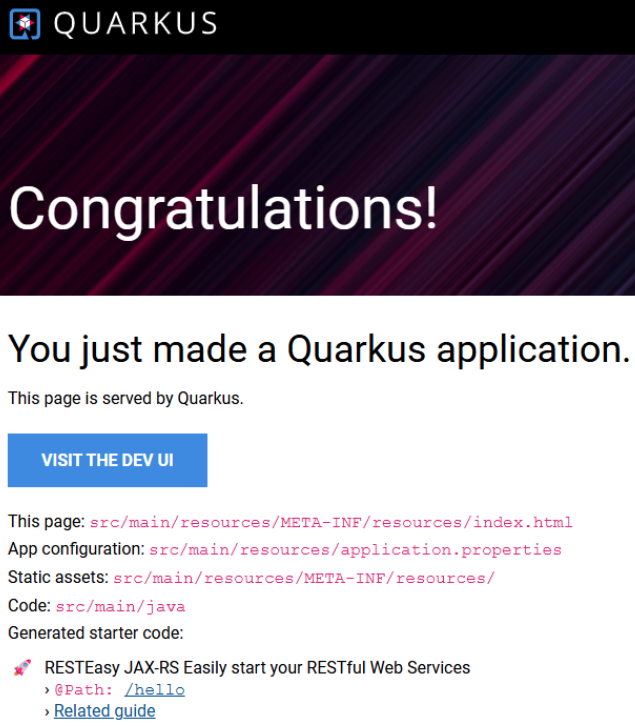
You will notice that the triviahh-api-gateway icon has a small arrow in the upper right corner. This indicates that the service has an external URL or route. By clicking on the arrow, you will open the URL in your browser. Do that now. You will see a Quarkus default web home page (Figure 3).
Note:
If you don’t see the above page, you may need to change the URL scheme from “https” to “http”.
What is this? This isn’t useful at all. I thought this was an API gateway that returned data? It is. But the root path was never defined in code, so the default that Quarkus created is displayed. You will most likely want to put something meaningful in the root path.
To see the API gateway, data access layer, and database in action, append /gateway/quotes/random to the URL. Now it makes sense. For example, you will see a random quote from the database. The following is an example (Figure 4):

Refresh your browser multiple times to see different quotes. The three pieces are working together.
Deploy the web front end
The final piece is the web front end, triviahhh-web. Move into the triviahhh-web directory that resulted from the previous git clone operation. Looking inside the file deploy.yaml, you will see three objects to be created: A deployment, a service, and a route.
Run the following command:
oc create -f deploy.yamlAfter a brief wait, the fourth and final part of the system will appear in the cluster dashboard (Figure 5):
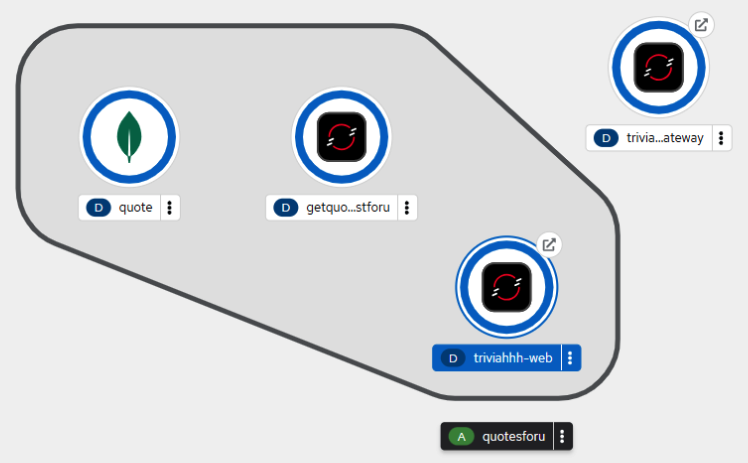
As before, a route is available for our newest app. Click on the small arrow on the triviahhh-web icon to view the web page. You may need to change the scheme from https to http. You will see a Welcome message (Figure 6):

The website is up and running, but it's not displaying data. What is going on?
Here’s the issue: The website needs to know the URL of the API gateway. The website gets the URL by reading the environment variable TRIVIAHHH_BACKEND_HOST. We need to set the value of that environment variable in the triviahhh-web deployment to the value of the route URL for the API gateway. This app uses a variant of the technique described in another Red Hat Developer learning path, “Reference server-side environment variables in OpenShift when using client-side JavaScript libraries”.
To get the URL of the API gateway, run the following command:
oc get route triviahhh-api-gateway -o custom-columns=URL:.spec.hostThe result will look like this:
triviahhh-api-gateway-rhn-engineering-dsch-dev.apps.rm3.7wse.p1.openshiftapps.comBy adding the scheme (http://) to this, we can get the URL to the API gateway. Using that with the oc set command, we can set the environment variable we need to allow the website to see the API gateway.
To get the full effect of the following command, it is recommended that you position your screen such that the triviahhh-web icon in the OpenShift dashboard is visible, and the command line is in front of it. This way, when you run the command, you can watch OpenShift automatically replace the running pod with a new pod that contains the correct URL in the environment variable.
Run the following command using the URL you created:
oc set env deploy/triviahhh-web TRIVIAHHH_BACKEND_HOST={URL_HERE}Here’s an example:
oc set env deploy/triviahhh-web TRIVIAHHH_BACKEND_HOST=http://triviahhh-api-gateway-rhn-engineering-dsch-dev.apps.rm3.7wse.p1.openshiftapps.comAt this point, you have updated the website and all four pieces are working together. Open the website and you will see a quote being displayed (Figure 7):
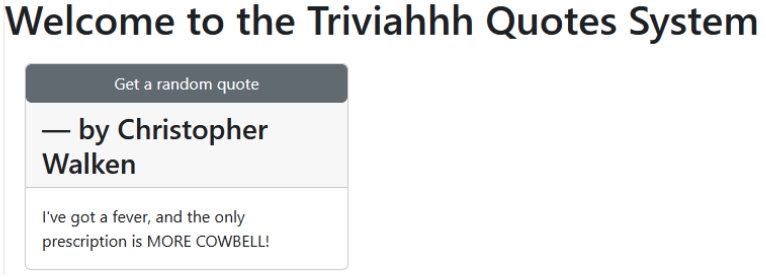
Think about it. We just instantiated a fairly complex, multi-service application with simple commands and pre-defined state in the YAML files. This is extremely powerful and can be used to construct complex applications with 10, 20, 30, or 100 services.
In this exercise, you learned how to deploy a fully functional multi-tier application with simple commands (oc create). All of the dependent code is packaged up and delivered in the container images because the data and configuration come from the environment. Production instances will access production persistent volumes, and development environments can be seeded with copies of production data.
It's easy to see why container orchestration is so powerful.
Inspect and troubleshoot using the OpenShift web interface
In the previous section, you created a multi-tier web application. Now, log in to the OpenShift web interface, which is a convenient place to monitor the state and troubleshoot things when they go wrong. You can even get a debug terminal into a Pod to troubleshoot if it crashes. This can help you figure out why it crashed. This shouldn't happen in this learning path, but as you build applications, it surely will. Also, feel free to delete a pod and see what happens. Kubernetes will see that the defined state and actual state no longer match and will recreate it. This is useful when things are taking too long.
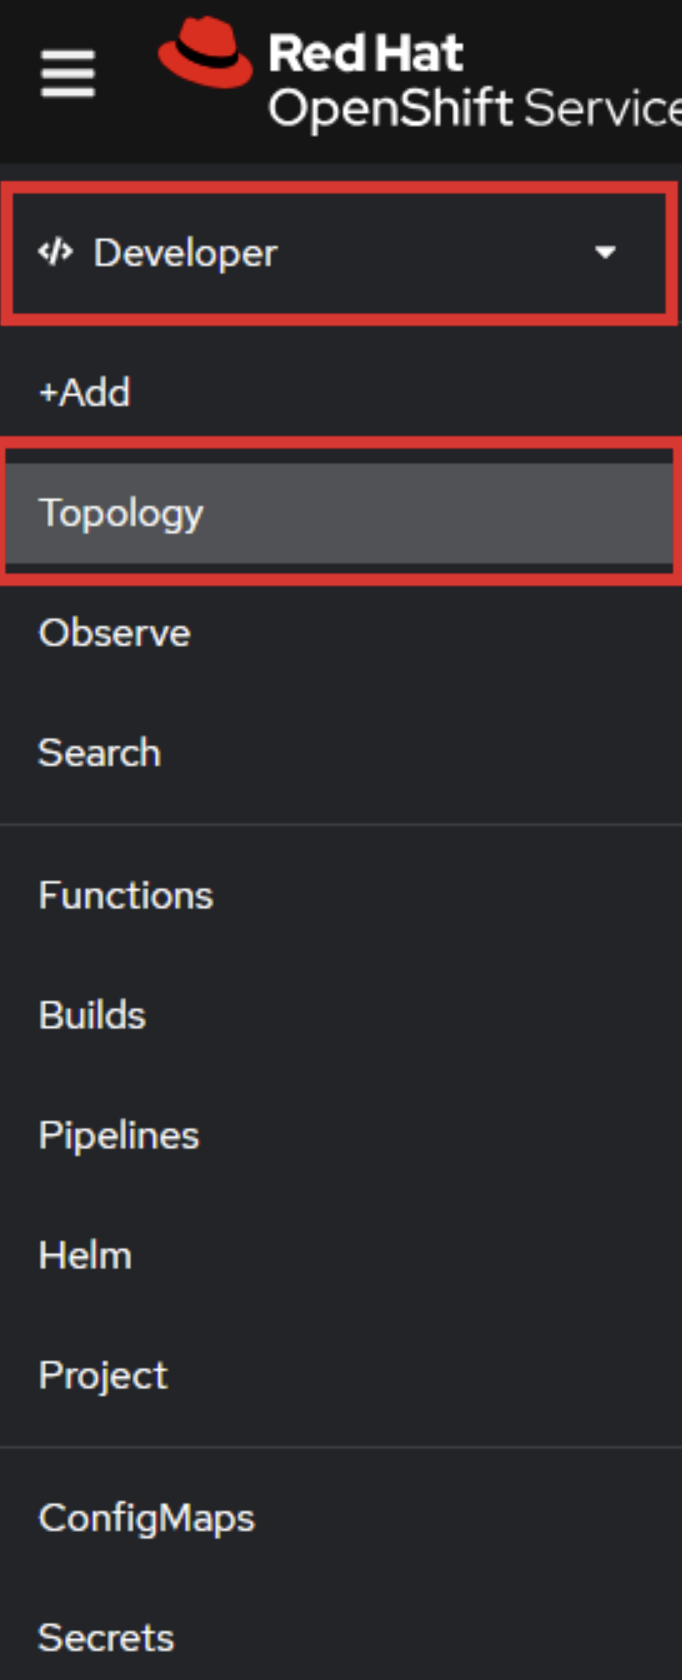
To begin, open the OpenShift web console in your Developer Sandbox.
In the Developer perspective, choose the Topology view (Figure 8):
Choose any pod and click in the middle of the icon to reveal the information panel to the right (Figure 9):
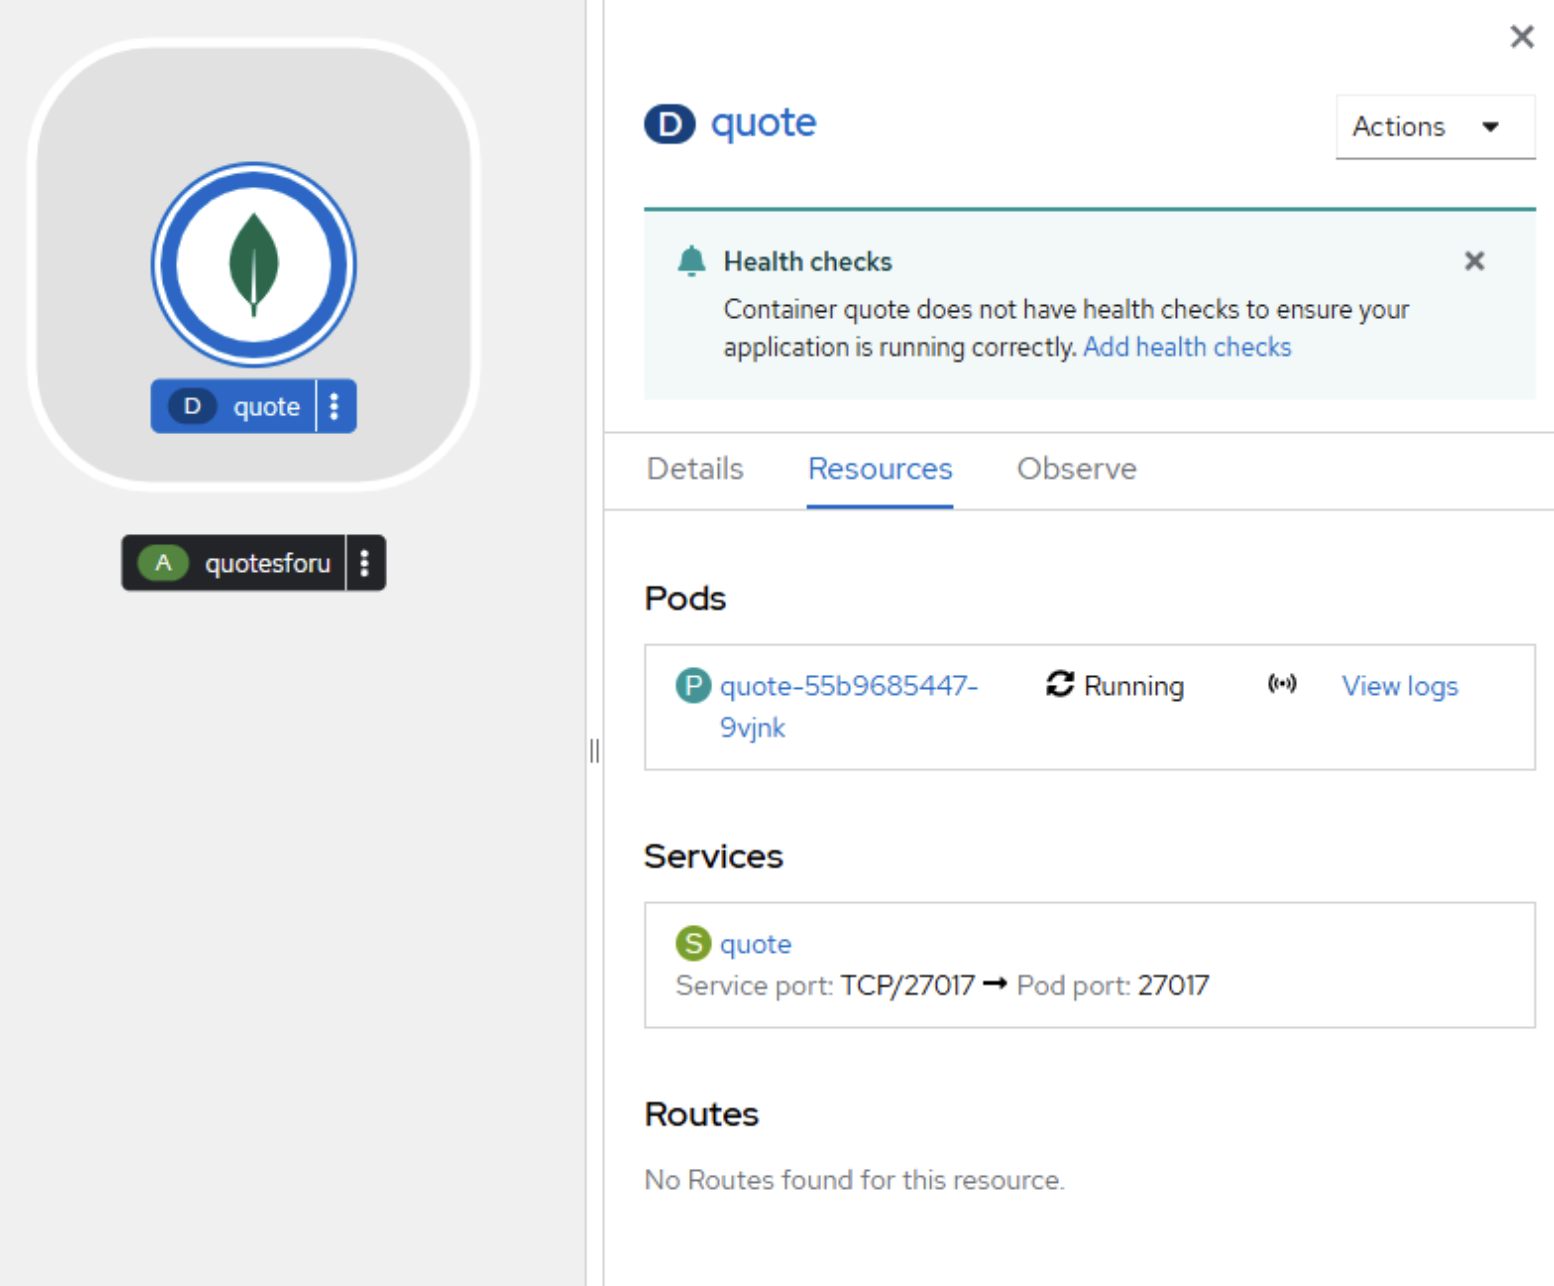
Inside the information panel, click the Resources tab, then click the link to the running pod in the Pods section. In the above example, the pod is quote-55b9685447-9vjnk. That will reveal the pod information details (Figure 10):
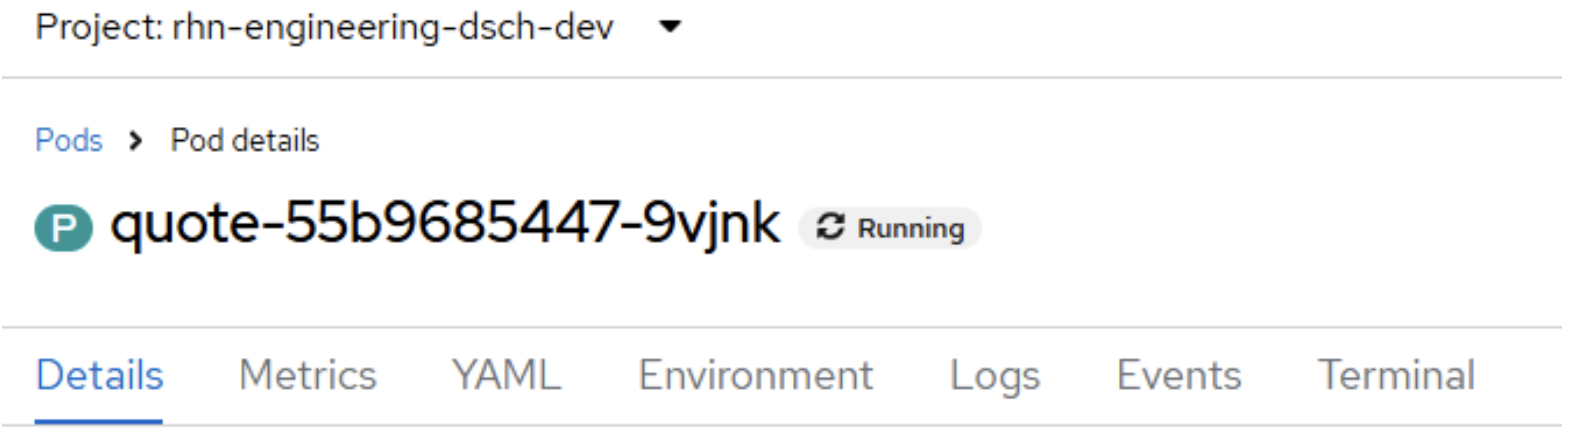
Click on each tab and look around. The Metrics helps you see performance information. The Environment is where you can view environment variables. The Logs tab is the standard output from the application, which is really helpful when debugging. The tab is especially helpful to see the steps to build and deploy the application. In the Terminal tab, you will be given a terminal session inside the pod.
Once you've spent some time in the web interface, move on to the next section.
Cluster performance: Scale applications horizontally with containers
Important
In order to complete this lesson, you will need to download and install the Apache software, which includes the ab utility. It can be found at the Apache Download page.
In this exercise, you will scale and load test a distributed application using a tool called Apache Bench. Apache Bench (ab command) is a tool for benchmarking HTTP servers. It is designed to give you an impression of how your current Apache installation performs. In particular, ab shows you how many requests per second your installation is capable of serving. The ab tool is especially useful with a Kubernetes cluster, where you can scale up web servers with a single command and provide more capacity to handle more requests per second.
Before we test, copy the URL address to connect to for several tests. The easiest way to do this is to open the triviahhh-web application and copy the URL from your browser. You can also run the following command:
oc get routes triviahhh-web -o jsonpath='{"http://"}{.spec.host}{"/\n"}/' Copy the URL into an environment variable so we can use it multiple times.
If you are using Bash:
export SITE=<URL_COPIED>If you are using PowerShell:
$env:SITE=<URL_COPIED>Test with ab before we scale the application to get a baseline. Take note of the Time taken for tests section.
If you are using Bash:
ab -n10 -c 3 -k -H "Accept-Encoding: gzip, deflate" $SITEIf you are using PowerShell:
ab -n10 -c 3 -k -H "Accept-Encoding: gzip, deflate" $env:SITETake note of the following sections in the output:
- Time taken for tests
- Requests per second
- Percentage of the requests served within a certain time (
ms)
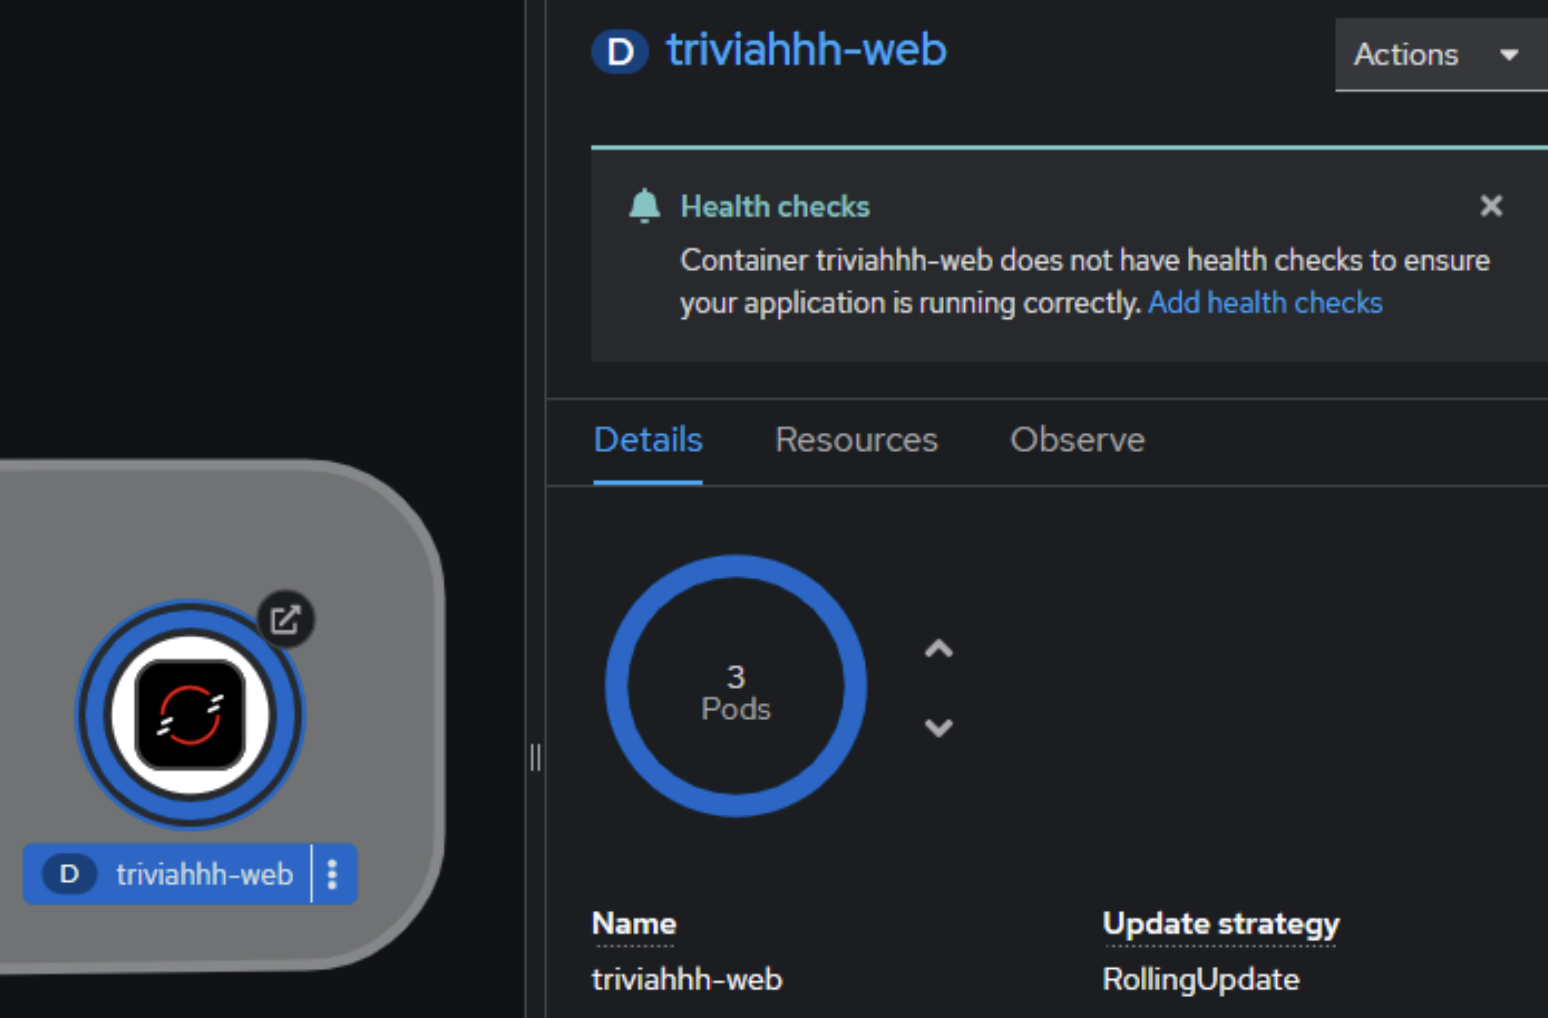
Go to the web interface. Scale the triviahhh-web deployment up to three containers. Click the triviahhh-web icon to reveal the information panel to the right, then click the Details tab. Once there, you can use the up and down arrows to alter the number of pods.
Scale the deployment up to three pods (Figure 11):
Run a command to test with ab again.
If you are using Bash:
ab -n10 -c 3 -k -H "Accept-Encoding: gzip, deflate" $SITEIf you are using PowerShell:
ab -n10 -c 3 -k -H "Accept-Encoding: gzip, deflate" $env:SITEHow did this affect our benchmarking and why? In the terminal session, scale up more with a command line instead of the web interface, and run the following command:
oc scale --replicas=5 deploy/triviahhh-webRun a command to test with ab again.
If you are using Bash:
ab -n10 -c 3 -k -H "Accept-Encoding: gzip, deflate" $SITEIf you are using PowerShell:
ab -n10 -c 3 -k -H "Accept-Encoding: gzip, deflate" $env:SITEAgain, notice the effects on performance.
Finally, scale the application back down to one pod. Run the following command:
oc scale --replicas=1 deploy/triviahhh-webIn a robust and properly-sized OpenShift cluster, scaling up to increase the number of pods will result in performance improvements. This is the result you should see in the Developer Sandbox. Counterintuitively, you may see slower response times when you scale the pods up. This can happen when running Kubernetes on a single node. In that case, the requests are being sent through a reverse proxy and distributed to multiple pods all running on the same server.
Sometimes horizontal scaling can have counterintuitive effects. Sometimes great care must be taken with applications to get the performance characteristics that we need. The world of container orchestration opens up an entirely new kind of performance tuning, and you will need new skills to tackle this challenge.
Distributed debugging: Troubleshoot in a distributed systems environment
The goal of this exercise is to understand the nature of a distributed systems environment with containers. Quickly and easily troubleshooting problems in containers requires distributed systems thinking. You have to think of things programmatically. You can't just SSH into a server and understand the problem. You can execute commands in a single pod, but even that might prevent you from troubleshooting things such as networking or database connection errors, which are specific to only certain nodes. This can happen because of nuanced differences in the locations of your compute nodes in a cloud environment or code that only fails in unforeseen ways at scale or under load.
We are going to simulate one of these problems by using a specially designed test application. In this exercise, we will learn how to figure things out quickly and easily.
To deploy the goodbad application, run the following two commands:
oc new-app --image=quay.io/rhdevelopers/goodbad:latest --name=goodbad --labels=app.kubernetes.io/part-of=goodbad,systemname=goodbad,tier=backend,language=nodejs,sandbox=goodbad
oc expose service/goodbad
This exercise will involve running a loop at the command line that fetches the results from the service goodbad. The first step is to get the URL for the service.
Run the following command:
oc get routes goodbad -o jsonpath='{"http://"}{.spec.host}{"\n"}'This will give you the URL to the root of the service. We need to access the “random” route, so you will need to append /random to the URL. You will end up with something similar to: http://goodbad-rhn-engineering-dsch-dev.apps.rm3.7wse.p1.openshiftapps.com/random
Now it is time to test the application using a loop with the curl command. Run the following command using the URL you obtained.
If using Bash:
for i in {1..200}; do curl http://goodbad-rhn-engineering-dsch-dev.apps.rm3.7wse.p1.openshiftapps.com/random; echo '';sleep 1;doneIf using PowerShell:
$i = 1; while ($i -le 200) {curl http://goodbad-rhn-engineering-dsch-dev.apps.rm3.7wse.p1.openshiftapps.com/random;$i++;echo '';sleep 1;}While the loop is running, you will see results similar to this:
{"success":false,"message":"Internal Server Error"}
{"success":false,"message":"Internal Server Error"}
{"randomNumber":50}
{"success":false,"message":"Internal Server Error"}
{"randomNumber":13}
{"randomNumber":40}
{"success":false,"message":"Internal Server Error"}
{"success":false,"message":"Internal Server Error"}
{"randomNumber":15}
{"randomNumber":37}
{"randomNumber":6}
As you can see, the app will occasionally fail. Why is this?
One way to start your investigation is to look at the logs for the pod. At the command line, this involves two commands: One to get the pod ID, and the other to display the logs for that pod.
To get the pod ID, run the following command:
oc get podsThis will give you a result similar to:
NAME                      READY   STATUS    RESTARTS   AGE
goodbad-998645d89-c88lq   1/1     Running   0          176m
Using the pod name, get the logs. Run the following command, substituting your own pod name:
oc logs goodbad-998645d89-c88lqThis will give you a result similar to this:
Random Number: 74
ERROR: Generated number 74 is greater than threshold of 50

Random Number: 39
Random Number: 1
Random Number: 40
Random Number: 52
ERROR: Generated number 52 is greater than threshold of 50

Random Number: 35
Random Number: 0
Random Number: 12
Random Number: 7
Random Number: 22
Random Number: 5
Random Number: 78
ERROR: Generated number 78 is greater than threshold of 50
You can also view the pod logs in the web-based dashboard. With this information, you can proceed to fix the problem.
Optional
As a final challenge, fix the problem permanently by fixing the logic so that the number is always above the threshold and never causes the application to break. Rebuild and redeploy the application. The source code is located at https://github.com/redhat-developer-demos/goodbad.
Hint
You will need to create an image, push it to an image registry, and use the oc set command to change the image used by the deployment.
Summary
Multi-container applications are the goal of microservices, and you have seen how to deploy, update, and debug these environments.
It is a journey, and we are always happy to help. If you want more options, consider the following learning paths:
- Install Podman Desktop and connect it to your Developer Sandbox
- Download and install the Red Hat OpenShift CLI
- Move your Developer Sandbox objects to another cluster
In the next and final lesson of this six-part Learning Path, you will learn about image specifications.