For an enterprise application to succeed, you need many moving parts to work correctly. If one piece breaks, the system must be able to detect the issue and operate without that component until it is repaired. Ideally, all of this should happen automatically. In this article, you will learn how to use health checks to improve application reliability and uptime in Red Hat OpenShift 4.5. If you want to learn more about what's new and updated in OpenShift 4.5, read What’s new in the OpenShift 4.5 console developer experience.
Health checks
You can use health checks to automatically determine if your application is working. If an instance of your application isn't working, other services should stop accessing it and sending it requests. You will need to re-route those requests to another instance of the app or have them re-tried at a later time. The system should also bring the application back up to a healthy state. OpenShift already restarts pods when they crash, but adding health checks can make your deployments more robust.
OpenShift 4.5 offers three types of health checks to support application reliability and uptime: readiness probes, liveness probes, and startup probes.
Readiness probes
A readiness probe checks whether the container is ready to handle requests. Adding a readiness probe lets you know when a pod is ready to start accepting traffic. A pod is considered ready when all of its containers are ready. One way to use this signal is to control which pods are used as service back ends. When a pod is not ready, it is removed from the service's load balancers. The system stops sending traffic to the pod until it passes the readiness probe. A failed readiness probe means that a container should not receive any traffic from a proxy, even if it is running.
Liveness probes
A liveness probe checks whether the container is still running. Adding a liveness probes lets you know when to restart a container. For example, a liveness probe could catch a deadlock, where an application is running, but unable to make progress. Restarting a container in such a state can help to make the application more available despite bugs. If the liveness probe fails, the container is killed.
Startup probes
A startup probe checks whether the application within the container has started. The system will disable the liveness and readiness checks until the startup probe succeeds. Running the startup probe first ensures that the liveness and readiness probes don't interfere with the application startup. You can also set a startup probe to adopt liveness checks on slow-starting containers, which will help avoid your container being killed by the Kubelet before it is running. If the startup probe fails, then the container is killed.
Probe types
In addition to the three types of health checks, there are three types of probes. They are HTTP, command, and TCP:
- The HTTP probe is the most common type of custom liveness probe. The probe pings a path. If it gets an HTTP response in the 200 or 300 range, it marks the app as healthy. Otherwise, it marks the app as unhealthy.
- The command probe runs a command inside your container. If the command returns with exit code 0, then the probe marks the container as healthy. Otherwise, it marks it as unhealthy.
- The TCP probe attempts a TCP connection on a specified port. If the connection is successful, the container is considered healthy; if the connection fails, it is considered unhealthy. TCP probes could come in handy for an FTP service.
Using health checks in the web console
Application health checks were available in the OpenShift 3 web console, and we've received many requests to bring them back. In OpenShift 4.5, health checks are once again available for developers. You can add health checks using the Advanced Options screen when you create new applications or services, or you can add or edit them afterward. If you have not yet configured health checks, you will see a notification in the side panel of the new Topology view. This navigation makes it easy to discover health checks, and it includes a quick link for remediation.
Default settings
Adding health checks should be easy, so we've used consistent patterns and flows, and provided defaults for ease of use. Three user flows are available for health checks. Regardless of the flow you choose, you can add any (or all) of the three health checks. There are also default settings for the three probe types, so you can easily add these, as well. Here is an example of a default setting for the HTTP probe type:
- Probe type: HTTP
- Port: 8080
- Failure threshold: Three times, indicating the number of times the probe will try starting or restarting before giving up.
- Success threshold: One time, indicating the number of consecutive successes for the probe to be considered successful after having failed.
- Period: 10 seconds, indicating how often to perform the probe.
- Timeout: One second.
Adding health checks
You can add health checks when you create a new application or services, or you can add them later. You can also edit health checks after you've created them.
Adding health checks via Advanced Options
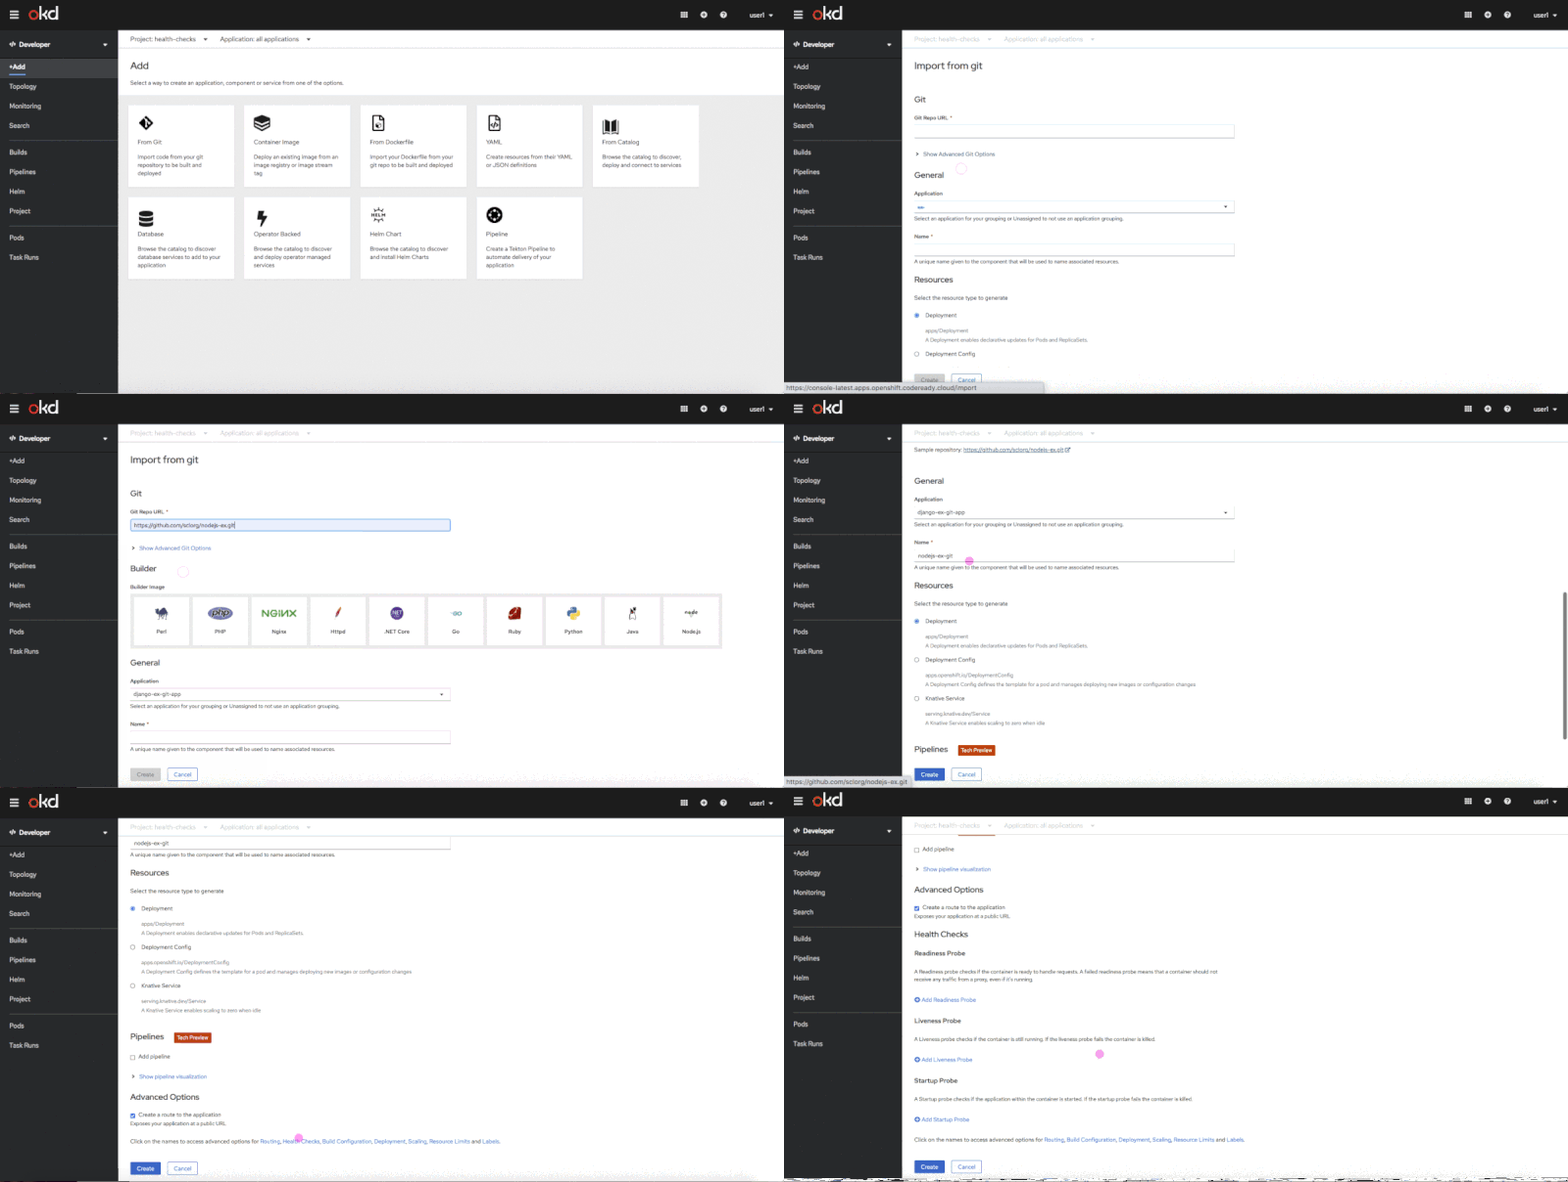
You can use the Advanced Options screen to add health checks when you are importing source code from Git, deploying an image, or importing from a Dockerfile. Figure 1 shows the flow of adding health checks on the Advanced Options screen.

Adding health checks in context
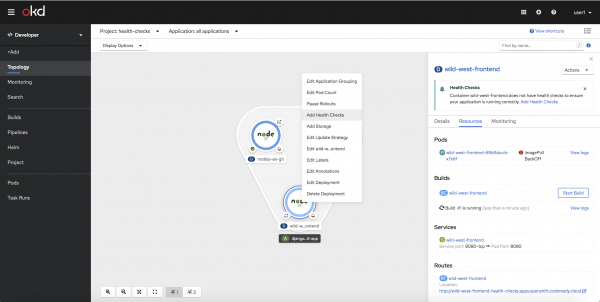
There's no need to worry about forgetting to add health checks when you create a new application or service. When you select an object in the new Topology view, the side panel will reveal a health check notification, stating that health checks haven't been configured. You can then add health checks using either the link in the notification or the in-context menus. Figure 2 shows the screen for adding a health check via an in-context menu.

Editing health checks
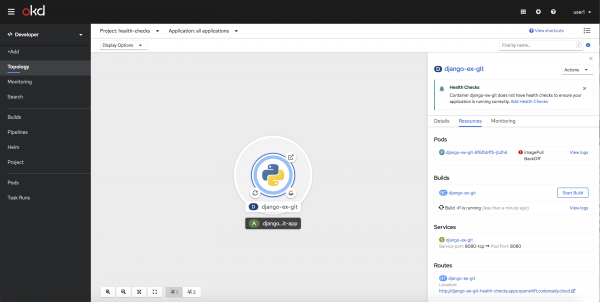
For workloads that have health checks already configured, we've added an Edit Health Checks menu item on the context menu and on the workload's Action Menu. The Edit Health Check form uses patterns and flows consistent with Add Health Checks, as shown in Figure 3.

We hope that you will explore the new health checks feature in OpenShift 4.5. Incorporating health checks into your best practices will improve your application's reliability and uptime.
Give us your feedback!
A huge part of the OpenShift developer experience process is receiving feedback and collaborating with our community and customers. We'd love to hear from you. We hope you will share your thoughts on the OpenShift 4.5 Developer Experience feedback page. You can also join our OpenShift Developer Experience Google Group to participate in discussions and learn about our Office Hours sessions, where you can collaborate with us and provide feedback about your experience using the OpenShift web console.
Get started with OpenShift 4.5
Are you ready to get started with the new OpenShift 4.5 web console? Try OpenShift 4.5 today.
Last updated: February 5, 2024