In just a matter of weeks, the world that we knew changed forever. The COVID-19 pandemic came swiftly and caused massive disruption to our healthcare systems and local businesses, throwing the world's economies into chaos. The coronavirus quickly became a crisis that affected everyone. As researchers and scientists rushed to make sense of it, and find ways to eliminate or slow the rate of infection, countries started gathering statistics such as the number of confirmed cases, reported deaths, and so on. Johns Hopkins University researchers have since aggregated the statistics from many countries and made them available.
In this article, we demonstrate how to build a website that shows a series of COVID-19 graphs. These graphs reflect the accumulated number of cases and deaths over a given time period for each country. We use the Red Hat build of Quarkus, Apache Camel K, and Red Hat AMQ Streams to get the Johns Hopkins University data and populate a MongoDB database with it. The deployment is built on the Red Hat OpenShift Container Platform (OCP).
The two applications developed for this demo would work for many other scenarios, such as reporting on corporate sales numbers, reporting on data from Internet-of-Things (IoT) connected devices, or keeping track of expenses or inventory. Wherever there is a repository with useful data, you could make minor code modifications and use these applications to collect, transform, and present the data to its users in a more meaningful way.
Technologies we'll use
Our focus in this article is the next-generation Kubernetes-native Java framework, Quarkus. We also leverage existing frameworks such as Apache Camel K and Kafka (AMQ Streams) to reduce the amount of code that we need to write.
What is Quarkus?
Quarkus is a Kubernetes-native Java framework crafted from best-of-breed Java libraries and standards. We also sometimes refer to Quarkus as supersonic, subatomic Java, and for a good reason: Quarkus offers fast boot times and low RSS memory (not just heap size) in container-orchestration platforms like Kubernetes. Quarkus lets developers create Java applications that have a similar footprint to Node.js, or smaller.
For this demonstration, we chose to run our Quarkus apps on OCP. Running on OpenShift Container Platform means that our demo applications can run anywhere that OpenShift runs, which includes bare metal, Amazon Web Services (AWS), Azure, Google Cloud, IBM Cloud, vSphere, and more.
What is Red Hat OpenShift?
Red Hat OpenShift offers a consistent hybrid-cloud foundation for building and scaling containerized applications. OpenShift provides an enterprise-grade, container-based platform with no vendor lock-in. Red Hat was one of the first companies to work with Google on Kubernetes, even prior to launch, and has become the second leading contributor to the Kubernetes upstream project. Using OpenShift simplifies application deployment because we can easily create resources (such as the MongoDB database we're using for this demonstration) by entering just a couple of commands in the terminal. OpenShift also provides a common development platform no matter what infrastructure we use to host the application.
What is Red Hat AMQ Streams?
AMQ Streams is an enterprise-grade Apache Kafka (event streaming) solution, which enables systems to exchange data at high throughput and low latency. Using queues is a great way to ensure that our applications are loosely coupled. Kafka is an excellent product, providing a highly scalable, fault-tolerant message queue that is capable of handling large volumes of data with relative ease.
What is Apache Camel K?
Apache Camel K is a lightweight cloud-integration platform that runs natively on Kubernetes and supports automated cloud configurations. Based on the famous Apache Camel, Camel K is designed and optimized for serverless and microservices architectures. Camel offers hundreds of connectors, providing connectivity to many existing applications, frameworks, and platforms.
Prerequisites
For this demonstration, you will need the following technologies set up in your development environment:
- An OpenShift 4.3+ environment with Cluster Admin access
- JDK 11 installed with
JAVA_HOMEappropriately configured - Openshift CLI (
oc) - Apache Maven 3.6.2+
We will build two separate Quarkus applications and deploy them to our OpenShift environment. The first application retrieves all of the data from an online repository (the Johns Hopkins University GitHub repository) and uses that data to populate a MongoDB collection called covid19report. The second application hosts the Quarkusian COVID-19 Tracker website, which dynamically generates charts based on the country that was selected. This application uses REST calls to query the MongoDB collection and returns the relevant data.
Adding resources to the OpenShift environment
Before we can get started with the two applications, we need to add the required resources to an OpenShift cluster. We'll add a MongoDB database first; then, we will add the Kafka cluster and create the Kafka topic to publish to.
Using oc, log into your OpenShift environment, and create a new project called covid-19-tracker. Then, add the MongoDB database to that namespace:
$ oc new project covid-19-tracker
$ oc new-app -n covid-19-tracker --docker-image mongo:4.0 --name=covid19report
Next, log into the OpenShift console, go to the OperatorHub, and search for the AMQ Streams Operator. Figure 1 shows all of the AMQ installations available from the OperatorHub.
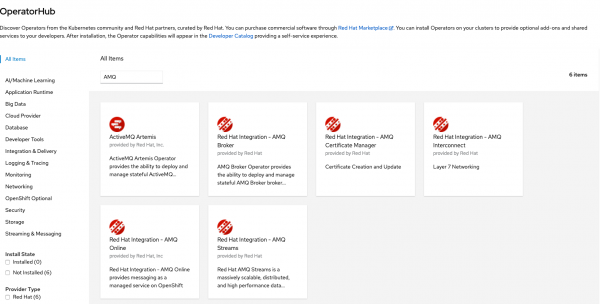
Install the Red Hat Integration - AMQ Streams Operator. After the Operator is successfully installed, go to Installed Operators, and click on it. You should see a screen similar to Figure 2.
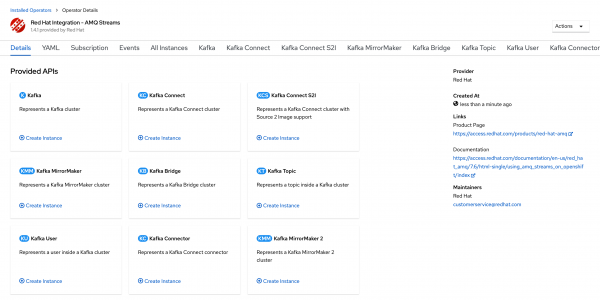
Select the Kafka tile and click Create Instance. Create the Kafka instance with default settings. Creating this instance launches seven pods: One pod is for the Kafka Cluster Entity Operator, and there are three pods each for the Kafka cluster and Zookeeper cluster.
Once all seven pods are running, go back to the Installed Operators page, and again select the Red Hat Integration - AMQ Streams Operator. This time, select the Kafka Topic tile and click Create Instance. You will see the option to create and configure the Kafka topic for our demonstration, as shown in Figure 3.

In this case, we need to make just one change to the YAML file. Change the topic's name (metadata: name) to: jhucsse.
Leave everything else in the file as the default values, then create the topic. Now the Kafka environment is ready to accept the data from our Quarkus applications.
For our Quarkus apps to connect to Kafka and MongoDB, we need to make a note of the cluster IP addresses for those services. Run the following from the command line, and you will be presented with a list of services and their corresponding internal IPs:
$ oc get services
Figure 4 shows the list of available services and each one's internal IP address:

Make a note of the IP address for my-cluster-kafka-bootstrap and covid19report. Later, we'll add these values to the application.properties file for each of our Quarkus applications.
Preparing the Quarkus applications
Before going any further, you should either download and unzip or clone the two demo applications to your local machine. The source code is available at the following URLs:
- Application 1 (
covid-data-fetching): https://github.com/gmccarth/covid-data-fetching - Application 2 (
covid-19-tracker): https://github.com/gmccarth/covid-19-tracker
After you extract the code, you will need to modify the application.properties file for each application to ensure that the Quarkus apps can connect to the MongoDB database and Kafka cluster we set up earlier.
Modify the application.properties for Application 1
In the application.properties for Application 1 (covid-data-fetching), find the two lines that start with quarkus.mongodb. Replace the IP addresses after mongodb:// with the IP address for our MongoDB pod (covid19report), which you noted earlier. Be sure to include the correct port, which is 27017:
quarkus.mongodb.connection-string=mongodb://<the IP for covid19report>:27017
quarkus.mongodb.hosts=mongodb://<the IP for covid19report>:27017

For example:
quarkus.mongodb.connection-string=mongodb://172.30.195.119:27017
quarkus.mongodb.hosts=mongodb://172.30.195.119:27017
Similarly, find the camel.component.kafka.brokers line and replace the IP address with the my-cluster-kafka-bootstrap IP address. Use port 9092 for this service:
camel.component.kafka.brokers=<the IP for my-cluster-kafka-bootstrap>:9092
Modify the application.properties for Application 2
Now open Application 2 (covid-19-tracker) and find the quarkus.mongodb.connection-string. Replace the IP address with the IP address for our MongoDB pod:
quarkus.mongodb.connection-string=mongodb://<the IP for covid19report>:27017
Similarly, find the camel.component.kafka.brokers line and replace the IP address with the my-cluster-kafka-bootstrapIP address. Use port 9092 for this service.
Set up and run the first application
For our first application, we use Apache Camel to retrieve files directly from the Johns Hopkins University GitHub repository URL. Camel transforms the CSV files into individual records, which we place into a Kafka topic. A second Camel route then consumes the messages from the Kafka topic. It transforms each record into a database object and inserts that data into a MongoDB collection. We'll go through each of these phases in detail.
Phase 1: Retrieve the data from the repository, transform it, and publish it to a Kafka topic
Figure 5 shows a flow diagram of the CSV files being retrieved from the GitHub repository and placed in a Kafka topic.

You can find the code for this phase in the JhuCsseExtractor.java file:
- First, we use a Camel route to get the CSV files from the Johns Hopkins University source:
from("timer:jhucsse?repeatCount=1") .setHeader("nextFile", simple("02-01-2020")) .setHeader("version", simple("v1")) .loopDoWhile(method(this, "dateInValidRange(${header.nextFile})")) .setHeader("nextFile", method(this, "computeNextFile(${header.nextFile})")) .setHeader("version", method(this, "getVersion(${header.nextFile})")) .toD("https:{{jhu.csse.baseUrl}}/${header.nextFile}.csv?httpMethod=GET") .log(LoggingLevel.DEBUG,"after setHeader:nextFile=${header.nextFile}") .split().tokenize("\n", 1, true) .log(LoggingLevel.DEBUG,"version=${header.version}") .choice() .when(header("version").isEqualTo("v1")) .unmarshal().bindy(BindyType.Csv, JhuCsseDailyReportCsvRecordv1.class) .marshal().json(JsonLibrary.Jackson) .to("kafka:jhucsse") .otherwise() .unmarshal().bindy(BindyType.Csv, JhuCsseDailyReportCsvRecordv2.class) .marshal().json(JsonLibrary.Jackson) .to("kafka:jhucsse") .end(); - Next, we use a
loopDoWhileto fetch all of the CSV files for the specified date range. - At this point, the CSV format changes to include additional data from
03-22-2020.csvonward. We use achoicemethod to handle the change in data format. Thechoicemethod ensures that all of the data is correctly inserted into the Kafka topic.
Phase 2: Consume the messages in the Kafka topic and write them to the MongoDB collection
Figure 6 shows a flow diagram of the transformed records being placed in the MongoDB collection.

- In a different bean (
MongoDbPopulator.java), we configure another Camel route to consume the messages from the Kafka topic we developed in Phase 1. The Camel route will write those messages to our MongoDB database:fromF("kafka:jhucsse?brokers=%s",brokers) .log("message: ${body}") .toF("mongodb:mongoClient?database=%s&collection=%s&operation=insert", database, collection); - To run the Quarkus app, in our terminal, we need to be in the
../covid-data-fetching/directory. Type the following into the terminal to kick-off building and deploying the Quarkus application:./mvnw clean package -Dquarkus.kubernetes.deploy=true -DskipTests=true -Dquarkus.kubernetes-client.trust-certs=true -Dquarkus.s2i.base-jvm-image=fabric8/s2i-java:latest-java11
- When you see the
BUILD SUCCESSmessage, go to your OpenShift console, where thecovid-data-fetchingapplication should be starting to run. To view the Camel route in action, go to thecovid19reportpod's Logs tab, where you should see something similar to Figure 7, a screenshot of messages flowing into Kafka.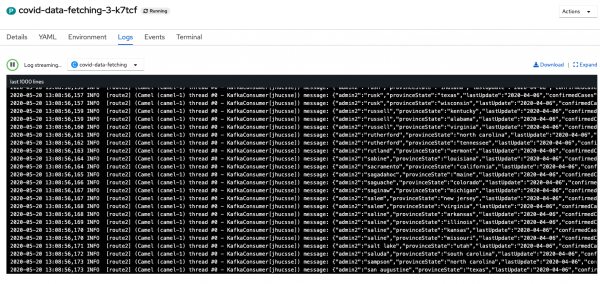
Figure 7. The application logs show a message stream flowing into Kafka. - To confirm that the records are being written to MongoDB, go to the Terminal tab of the
covid19reportpod and typeMongoin the terminal window. This command launches the MongoDB shell. In the shell typeshow dbsto see a list of databases, which should includecovid19report. Figure 8 shows the list of databases.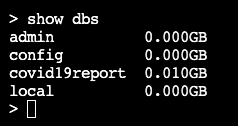
Figure 8. The list of databases should include covid19report.
Set up and run the second application
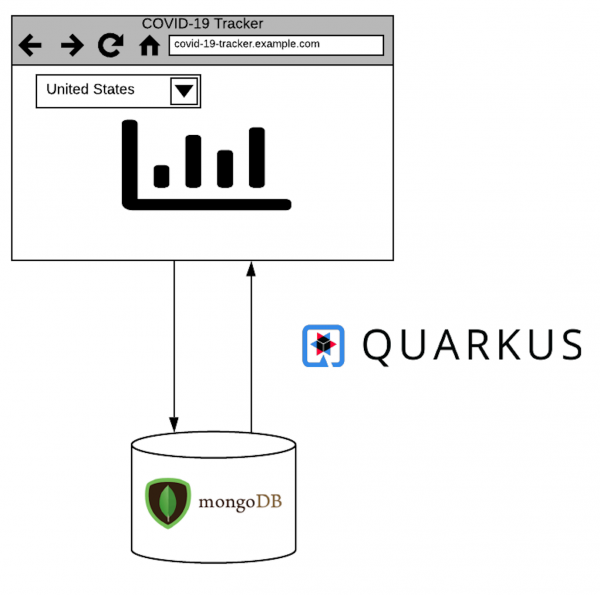
Application 2 is the Quarkusian COVID-19 Tracker web application. It uses REST calls to the MongoDB database to dynamically retrieve a requested data set, then launches the website. Figure 9 shows a flow diagram for the COVID-19 Tracker.
Notes about this application:
- When we run Quarkus, a web server is started and is accessible on port 8080.
- Our Quarkus project included RESTEasy JAX-RS. This allows us to create multiple REST endpoints for the MongoDB queries.
- Quarkus also supports dependency injection, so we can easily inject a companion bean into our main class.
- Our
index.htmlpage (in theresources/META-INFfolder) has a dropdown list to select the specific, country-based data set that we want to use. The dropdown list is populated from a query to the MongoDB database. On submit, the page sends the country code in aGETrequest to theTrackerResourcebean. The bean uses Panache to query the MongoDB database. It then returns the response to the web page, which generates a graph from the received JSON response.
To run the Quarkus app, we need to be in the ../covid-19-tracker/ directory. Type the following into the terminal to kick-off building and deploying this Quarkus application:
$ ./mvnw clean package -Dquarkus.kubernetes.deploy=true -DskipTests=true -Dquarkus.kubernetes-client.trust-certs=true -Dquarkus.s2i.base-jvm-image=fabric8/s2i-java:latest-java11
After you see the BUILD SUCCESS message, go to your OpenShift console and confirm that the covid-19-tracker application is starting to run. Once the pod is running, you need to expose the service, so that you can get a route to it from the internet. In the terminal, type:
$ oc expose svc/covid-19-tracker
In your OpenShift console, in the administrator's perspective, go to Networking -> Routes to get the application URL. Click on the URL, which takes you to the application. Try selecting data sets from different countries. You should see something like the screenshot in Figure 10, with the charts changing to show the COVID-19 data for the country that you have selected.

Conclusion
In this article, we demonstrated how to extract meaningful visualizations from an external repository with relative ease, and with very few lines of code. We used existing, solid frameworks to reduce complexity and the time required to build a reusable application. Deploying the application to OpenShift reduced the time necessary to develop, build, and deploy the demo applications. Additionally, Quarkus requires substantially less memory than a standard Java application. As a result, we built applications with faster launch times and quicker responses, resulting in an improved experience for developers, end-users, and ultimately, the business.
Are you interested in trying out Quarkus? Check out our self-paced Getting Started with Quarkus lab! See the entire catalog for more developer labs.
Note: I would like to thank Mary Cochran, Claus Ibsen, and Josh Reagan, who assisted with troubleshooting and pointed me in the right direction for this article. Special thanks, also, to my fellow Hackfest team members: Jochen Cordes and Bruno Machado, who helped with building the Camel routes and configuring the MongoDB database.
Last updated: March 30, 2023