When you deploy Jaeger in a production configuration, it makes sense to keep an eye on your Jaeger instance to see if it is performing as expected. After all, an outage in Jaeger means that tracing data is being lost, making it challenging to understand possible problems happening within your production applications.
This article guides you in building a monitoring infrastructure for your Jaeger installation. We'll first provide a link to ready-made resources for those who just want a quick way to monitor Jaeger.
In the second part, we'll go deeper and see how we can install all the tools in a Kubernetes cluster, including Prometheus, Grafana, and Jaeger itself, as well as the required tools to customize the alert rules and dashboards using the official Jaeger monitoring mixin.
TL;DR: If you already have a working environment involving Grafana, Prometheus, and Jaeger, you might only need to know where the base dashboards and alert definitions are located. Here they are:
If you are already familiar with mixins, the official Jaeger monitoring mixin is available in our main source repository.
Prerequisites
This guide assumes you have admin access to a Kubernetes cluster. An easy way to get a Kubernetes cluster for testing purposes is running it locally via Minikube.
This guide also requires you to have jsonnet and jb (jsonnet-bundler). They can be installed on your local machine using go get, as follows:
$ go get github.com/google/go-jsonnet/cmd/jsonnet
$ go get github.com/jsonnet-bundler/jsonnet-bundler/cmd/jb
Installing Prometheus, Alertmanager, and Grafana
Installing Prometheus on Kubernetes can be done in several ways. One way to install it is via the project kube-prometheus, but the Prometheus Operator can be directly used instead, as well the community Helm chart for the Prometheus Operator. For this guide, we'll use kube-prometheus to get a Prometheus, Alertmanager, and Grafana instance.
First, let's use jb to generate a base jsonnet file describing our installation, adding kube-prometheus as a dependency:
$ jb init
$ jb install \
  github.com/jaegertracing/jaeger/monitoring/jaeger-mixin@master \
  github.com/grafana/jsonnet-libs/grafana-builder@master \
  github.com/coreos/kube-prometheus/jsonnet/kube-prometheus@master
Once that is done, we should have a manifest file named jsonnetfile.json similar to this one:
{
    "dependencies": [
        {
            "name": "mixin",
            "source": {
                "git": {
                    "remote": "https://github.com/jpkrohling/jaeger",
                    "subdir": "monitoring/mixin"
                }
            },
            "version": "1668-Move-Jaeger-mixing-to-main-repo"
        },
        {
            "name": "grafana-builder",
            "source": {
                "git": {
                    "remote": "https://github.com/grafana/jsonnet-libs",
                    "subdir": "grafana-builder"
                }
            },
            "version": "master"
        },
        {
            "name": "kube-prometheus",
            "source": {
                "git": {
                    "remote": "https://github.com/coreos/kube-prometheus",
                    "subdir": "jsonnet/kube-prometheus"
                }
            },
            "version": "master"
        }
    ]
}
The install command should also have created vendor directory with all the jsonnet dependencies. All we need now is a deployment descriptor: create a file named monitoring-setup.jsonnet, with the following contents.
local kp =
  (import 'kube-prometheus/kube-prometheus.libsonnet') +
  {
    _config+:: {
      namespace: 'monitoring',
    },
  };

{ ['00namespace-' + name + '.json']: kp.kubePrometheus[name] for name in std.objectFields(kp.kubePrometheus) } +
{ ['0prometheus-operator-' + name + '.json']: kp.prometheusOperator[name] for name in std.objectFields(kp.prometheusOperator) } +
{ ['node-exporter-' + name + '.json']: kp.nodeExporter[name] for name in std.objectFields(kp.nodeExporter) } +
{ ['kube-state-metrics-' + name + '.json']: kp.kubeStateMetrics[name] for name in std.objectFields(kp.kubeStateMetrics) } +
{ ['alertmanager-' + name + '.json']: kp.alertmanager[name] for name in std.objectFields(kp.alertmanager) } +
{ ['prometheus-' + name + '.json']: kp.prometheus[name] for name in std.objectFields(kp.prometheus) } +
{ ['prometheus-adapter-' + name + '.json']: kp.prometheusAdapter[name] for name in std.objectFields(kp.prometheusAdapter) } +
{ ['grafana-' + name + '.json']: kp.grafana[name] for name in std.objectFields(kp.grafana) }
With that, we are ready to generate our deployment manifests and apply them:
$ jsonnet -J vendor -cm manifests/ monitoring-setup.jsonnet
$ kubectl apply -f manifests/
It might be the case that the Custom Resource Definitions (CRDs) aren't ready when they are first used, causing messages like:
no matches for kind "ServiceMonitor" in version "monitoring.coreos.com/v1"
In that case, simply apply the manifests again, since they are idempotent.
After a couple of minutes, there should be a few Deployment and Statefulset resources available:
$ kubectl get deployments -n monitoring
NAME                  READY     UP-TO-DATE   AVAILABLE   AGE
grafana               1/1       1            1           56s
kube-state-metrics    1/1       1            1           56s
prometheus-adapter    1/1       1            1           56s
prometheus-operator   1/1       1            1           57s

$ kubectl get statefulsets -n monitoring
NAME                READY     AGE
alertmanager-main   3/3       60s
prometheus-k8s      2/2       50s
Let's check that Prometheus is up by connecting directly to the service's port:
$ kubectl port-forward -n monitoring service/prometheus-k8s 9090:9090
$ firefox http://localhost:9090
Perform the same check for Grafana, where the default credentials are admin for both the username and password.
$ kubectl port-forward -n monitoring service/grafana 3000:3000
$ firefox http://localhost:3000
Installing Jaeger
The Jaeger Operator is installed by default in the "observability" namespace. For this guide, let's keep it together with Prometheus and Grafana in the "monitoring" namespace. To accomplish that, we'll get the manifests with curl and replace observability with monitoring, feeding the outcome to kubectl:
$ kubectl create -f https://raw.githubusercontent.com/jaegertracing/jaeger-operator/v1.13.1/deploy/crds/jaegertracing_v1_jaeger_crd.yaml
$ curl -s https://raw.githubusercontent.com/jaegertracing/jaeger-operator/v1.13.1/deploy/service_account.yaml | sed 's/observability/monitoring/gi' | kubectl apply -f -
$ curl -s https://raw.githubusercontent.com/jaegertracing/jaeger-operator/v1.13.1/deploy/role.yaml | sed 's/observability/monitoring/gi' | kubectl apply -f -
$ curl -s https://raw.githubusercontent.com/jaegertracing/jaeger-operator/v1.13.1/deploy/role_binding.yaml | sed 's/observability/monitoring/gi' | kubectl apply -f -
$ curl -s https://raw.githubusercontent.com/jaegertracing/jaeger-operator/v1.13.1/deploy/operator.yaml | sed 's/observability/monitoring/gi' | kubectl apply -f -
At the time of writing, the latest version was v1.13.1, so change the URLs above to match the desired version. After a few moments, the Jaeger Operator should be up and running:
$ kubectl get deployment/jaeger-operator -n monitoring
NAME              READY     UP-TO-DATE   AVAILABLE   AGE
jaeger-operator   1/1       1            1           23s
Once the Jaeger Operator is ready, it's time to create a Jaeger instance called tracing:
kubectl apply -f - <<EOF
apiVersion: jaegertracing.io/v1
kind: Jaeger
metadata:
  name: tracing
  namespace: monitoring
EOF
And in a few moments, a Jaeger instance should be ready:
$ kubectl get deployment/tracing -n monitoring
NAME      READY     UP-TO-DATE   AVAILABLE   AGE
tracing   1/1       1            1           17s

$ kubectl get ingress -n monitoring
NAME            HOSTS     ADDRESS           PORTS     AGE
tracing-query   *         192.168.122.181   80        26s
We can access the Jaeger UI by opening the given IP address in a web browser. In this example, it's http://192.168.122.181/, but your IP will likely be different.
Now that we have everything running, let's install our business application, instrumented to create spans for each HTTP request it receives:
$ kubectl apply -n default -f https://raw.githubusercontent.com/jaegertracing/jaeger-operator/v1.13.1/deploy/examples/business-application-injected-sidecar.yaml
Once the deployment is ready, we can open a direct connection to the Pod and start sending requests to it:
$ kubectl get -n default deployment/myapp
NAME      READY     UP-TO-DATE   AVAILABLE   AGE
myapp     1/1       1            1           26s

$ kubectl port-forward deployment/myapp 8080:8080
$ watch -n 0.5 curl localhost:8080
This will generate two HTTP requests per second, and we should see one new trace in the Jaeger UI for every HTTP request.
Create a PodMonitor
At this point, we have a fully functional set of monitoring services: Prometheus, Grafana, Alertmanager, and Jaeger. However, the metrics generated from our Jaeger deployment aren't being scraped by Prometheus: we need to create a ServiceMonitor or a PodMonitor telling Prometheus where to get our data.
Depending on the component, the metrics are served in different ports:
| Component | Port |
|---|---|
| Agent | 14271 |
| Collector | 14269 |
| Query | 16687 |
| All in one | 14269 |
As the Jaeger instance we created didn't specify a strategy, the default strategy allInOne was selected. Our PodMonitor will then tell Prometheus to get the metrics from the port 14269:
$ kubectl apply -f - <<EOF
apiVersion: monitoring.coreos.com/v1
kind: PodMonitor
metadata:
  name: tracing
  namespace: monitoring
spec:
  podMetricsEndpoints:
  - interval: 5s
    targetPort: 14269
  selector:
    matchLabels:
      app: jaeger
EOF
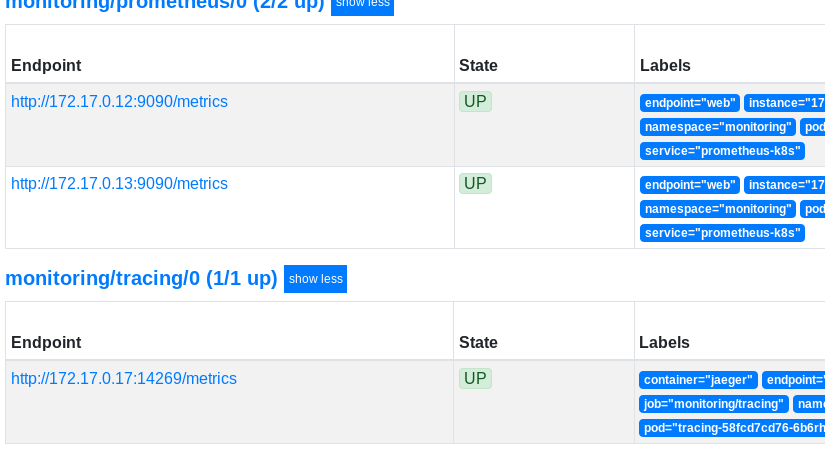
It might take a couple of minutes for Prometheus to see this new target. Check the Targets page, looking for the target monitoring/tracing/0. Once Prometheus scrapes Jaeger's metrics endpoint, we can see Jaeger-specific metrics in the Prometheus Graph view. For instance, enter jaeger_collector_traces_saved_by_svc_total and click Execute. The number of traces shown in the graph should be increasing over time, reflecting the number of HTTP requests that we are running against the business application from the previous steps.
Adapt the mixin
We now have the metrics from our Jaeger instance available in Prometheus, but which metrics should be seen on a dashboard and which alerts should be generated under which circumstances?
While it's hard to come up with a generic, one-size-fits-all answer to those questions, our friends at Grafana Labs came up with a mixin for Jaeger, providing a starting point for your own dashboards and alerts. The mixin has since been contributed to the Jaeger project and is available under the main repository.
Let's go back to our original monitoring-setup.jsonnet and add the Jaeger-specific dashboard and alert rules:
local jaegerAlerts = (import 'jaeger-mixin/alerts.libsonnet').prometheusAlerts;
local jaegerDashboard = (import 'jaeger-mixin/mixin.libsonnet').grafanaDashboards;

local kp =
  (import 'kube-prometheus/kube-prometheus.libsonnet') +
  {
    _config+:: {
      namespace: 'monitoring',
    },
    grafanaDashboards+:: {
      'jaeger.json': jaegerDashboard['jaeger.json'],
    },
    prometheusAlerts+:: jaegerAlerts,
  };

{ ['00namespace-' + name + '.json']: kp.kubePrometheus[name] for name in std.objectFields(kp.kubePrometheus) } +
{ ['0prometheus-operator-' + name + '.json']: kp.prometheusOperator[name] for name in std.objectFields(kp.prometheusOperator) } +
{ ['node-exporter-' + name + '.json']: kp.nodeExporter[name] for name in std.objectFields(kp.nodeExporter) } +
{ ['kube-state-metrics-' + name + '.json']: kp.kubeStateMetrics[name] for name in std.objectFields(kp.kubeStateMetrics) } +
{ ['alertmanager-' + name + '.json']: kp.alertmanager[name] for name in std.objectFields(kp.alertmanager) } +
{ ['prometheus-' + name + '.json']: kp.prometheus[name] for name in std.objectFields(kp.prometheus) } +
{ ['prometheus-adapter-' + name + '.json']: kp.prometheusAdapter[name] for name in std.objectFields(kp.prometheusAdapter) } +
{ ['grafana-' + name + '.json']: kp.grafana[name] for name in std.objectFields(kp.grafana) }
And let's generate the new manifests:
$ jsonnet -J vendor -cm manifests/ monitoring-setup.jsonnet
Only a few manifests should have been changed, but it's safe to apply all the manifests again:
$ kubectl apply -f manifests/
After a few moments, a new pod for Grafana should replace the previous one:
$ kubectl get pods -n monitoring -l app=grafana
NAME                       READY     STATUS    RESTARTS   AGE
grafana-558647b59-fkmr4    1/1       Running   0          11m
grafana-7bcb7f5b9b-6rv2w   0/1       Pending   0          8s
Tip: When using Minikube, your new pod might get stuck in the Pending state due to Insufficient cpu. You can check the cause by running kubectl describe -n monitoring pod POD_NAME, and manually kill the old pod with kubectl delete -n monitoring pod POD_NAME, or start minikube with a higher value for the flag --cpus.
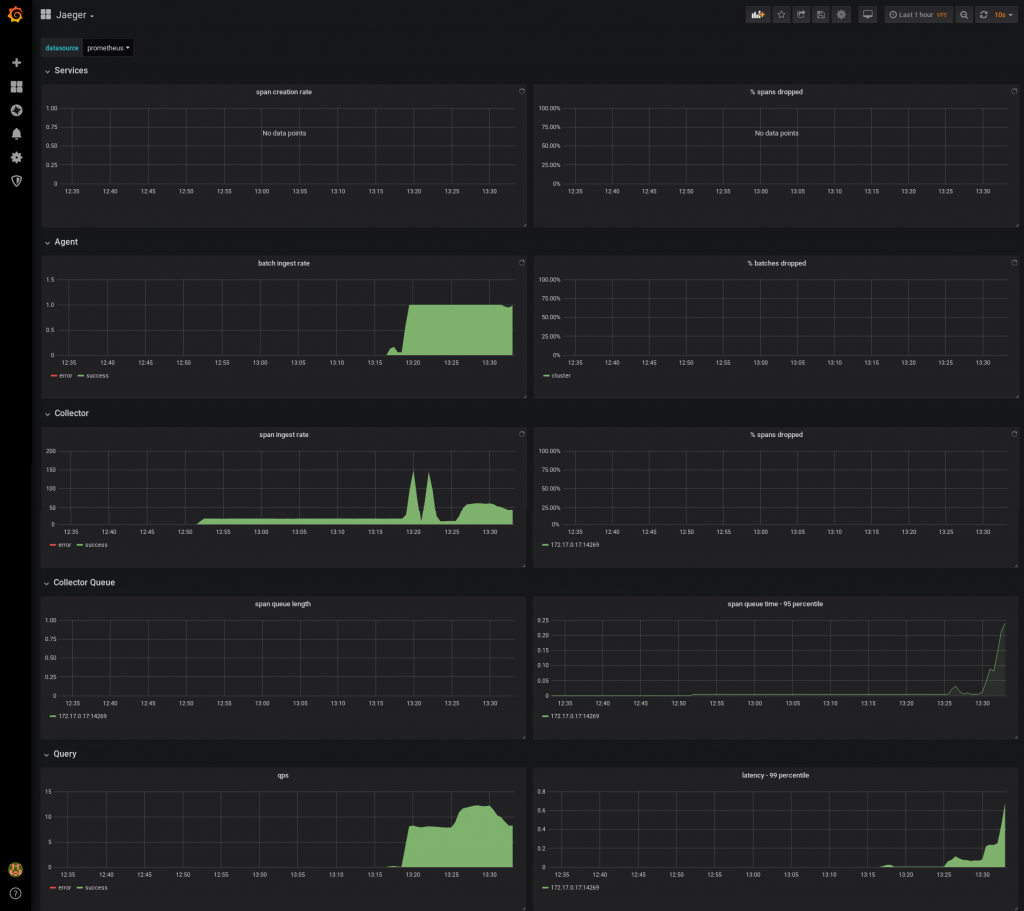
Once the new Grafana pod is up and running, you should see that Grafana has a new Jaeger dashboard available, displaying the data provided by Prometheus. Similarly, new alert rules should be available in Prometheus: look for the ones with "Jaeger" in the name, such as JaegerCollectorQueueNotDraining.
Wrapping up
Deploying observability tools to bring insights to your business application is a necessity in the world of cloud-native microservices, and it's essential to be able to monitor how these tools are behaving. This blog post shows one way to get a complete stack up and running in Kubernetes, with the final goal of monitoring Jaeger using its own internal metrics. The same setup can be extended to get Prometheus to scrape the metrics from your business application, and Grafana as the dashboard tool to visualize the data.
Are you using Grafana already to visualize the metrics scraped from Jaeger? Share your dashboards with us, we might have a place for them in the official Jaeger monitoring mixin!
Upcoming
Juraci Paixão Kröhling will present “What are my microservices doing?” at the Red Hat "Develop. Deploy. Deliver continuously." virtual event, Thursday, October 10, 2019.
Last updated: February 6, 2024