JBoss BRMS provides a sophisticated and powerful business rules engine. The BRMS rules engine allows an organization, among other things, to:
- define rules in single, governed, environment.
- define rules in the domain language (or syntax) of the problem domain.
- declaratively define rules. It allows to define what to do, not how to do it
- individually test rules, outside of any application logic.
- (incrementally) update rules without the need to update and/or restart the application that uses the rules.
- have better performance on rule execution than in traditional application code.
An often asked question is how to effectively and efficiently debug a rule or a set of rules in a declarative rules engine. Because the rules engine uses sophisticated and complex algorithms like ReteOO and PHREAK, one can no longer simply rely on setting a breakpoint on a left-hand-side (LHS) constraint. When someone is used to imperative programming languages, like Java, declarative languages and runtimes need a bit of practice to debug.
In this article we will provide five ways to make debugging of JBoss BRMS rules applications more efficient and effective.
1. Logging
The first approach to debugging rule execution is to provide logging statements in the right-hand-side (RHS) of your rule. By adding some simple logging statements to your rules, for example on DEBUG or TRACE level, one can easily identify which rules have fired and which have not. The logger itself can be inserted into the rules and KieSession using a Drools global.
Logger rulesLogger = LoggerFactory.getLogger("RulesLogger");
kieSession.setGlobal("logger", rulesLogger);
And we can configure the global in our drl as such:
global org.slf4j.Logger logger;
Finally, we can use the logger in the RHS of our rule like this:
//Credit too low
rule "Rule 1 LoanApproval"
when
   f1 : Applicant( creditScore = 0 )
then
   if (logger.isDebugEnabled()) {
      logger.info("Rule 1 fired");
   }
   f2.setApproved(false);
end
2. Drools Audit Logging and Eclipse/JBoss Developer Studio
The second approach is to utilise the Drools KieRuntimeLogger to track the audit events in the runtime during rule execution. The file created by this logger can then be passed to the Drools Audit viewer in Eclipse for analysis. The KieRuntimeLogger can be configured like this:
KieRuntimeLogger kieLogger = kieServices.getLoggers().newFileLogger(kieSession, "audit");
And needs to be closed when the session is disposed :
kieLogger.close();
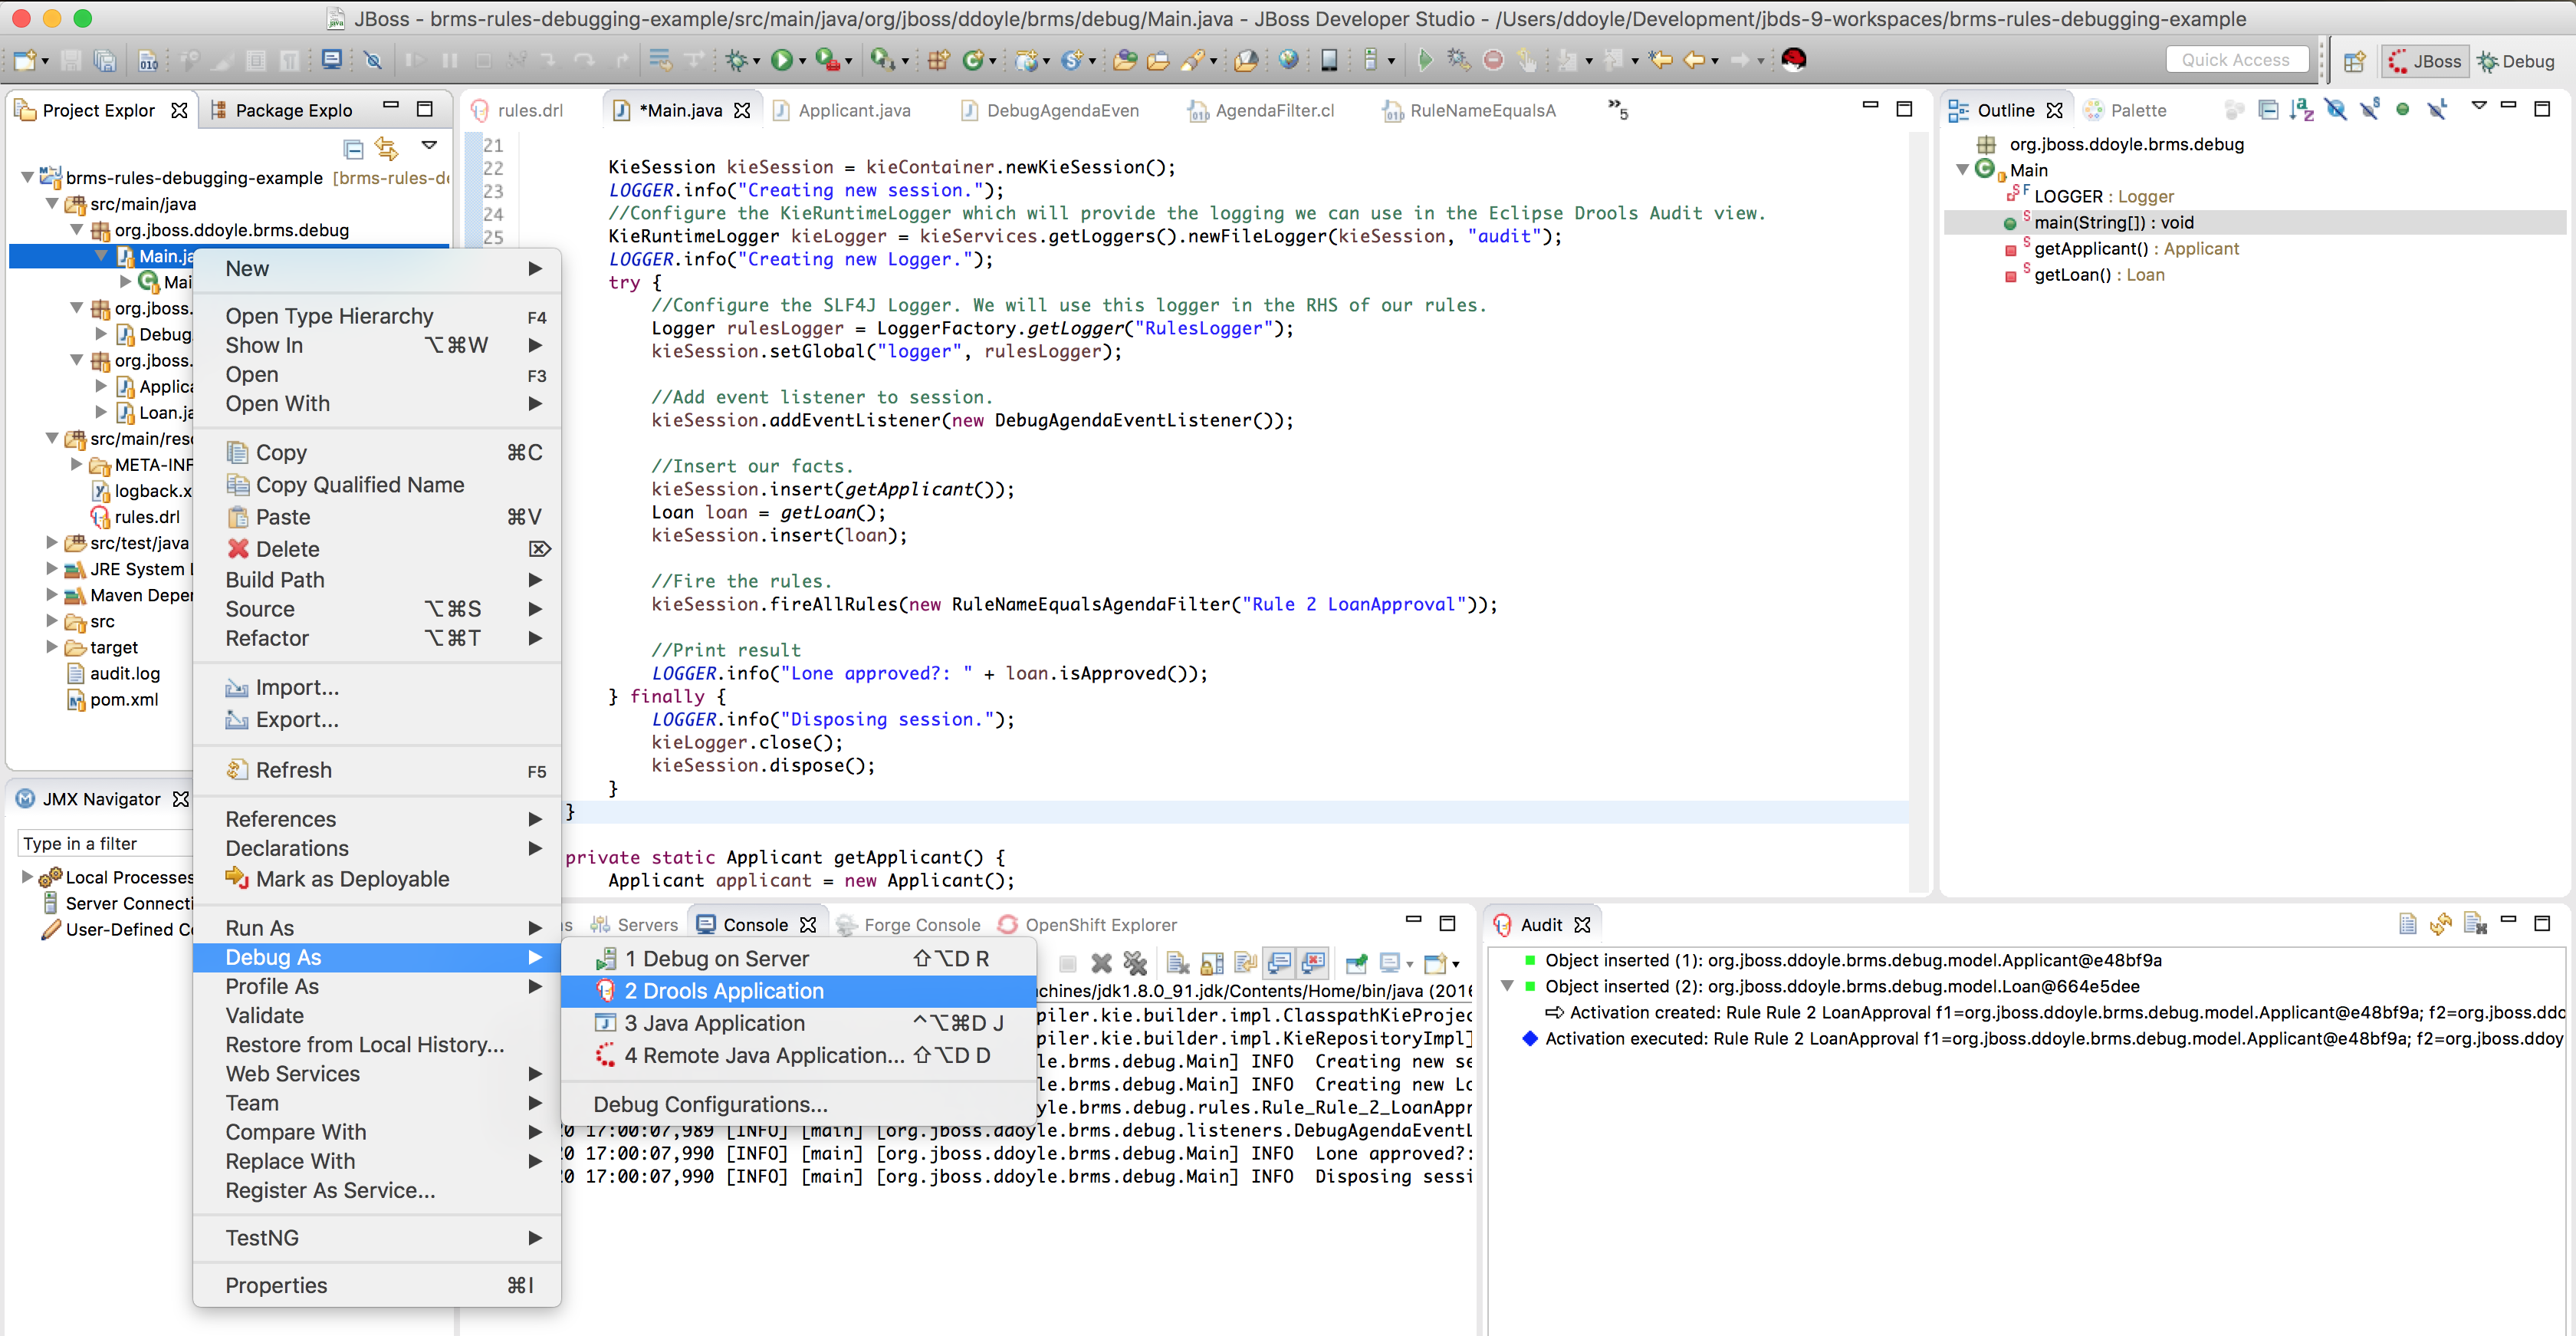
This will create a file called audit.log when we run our application. This file can then be dragged and dropped on the Drools Audit view in Eclipse (provided the Drools plugins have been installed), which will show the audit information of which objects (facts) have been inserted and which rules have fired:

3. Event Listeners
A powerful concept in Drools is EventListeners. The rules engine emits all sorts of events: when facts are inserted into the engine, when rules are matched, when rules are fired, etc. Custom EventListeners can be used to log and debug rule execution by listening for these events and build debug logging output based on the event data. For example, we can implement an EventListener that logs the firing of a rule by implementing its afterMatchFired method, like this:
package org.jboss.ddoyle.brms.debug.listeners;

import org.kie.api.definition.rule.Rule;
import org.kie.api.event.rule.AfterMatchFiredEvent;
import org.kie.api.event.rule.DefaultAgendaEventListener;
import org.slf4j.Logger;
import org.slf4j.LoggerFactory;

public class DebugAgendaEventListener extends DefaultAgendaEventListener {

   private static final Logger LOGGER = LoggerFactory.getLogger(DebugAgendaEventListener.class);

   @Override
   public void afterMatchFired(AfterMatchFiredEvent event) {
      Rule rule = event.getMatch().getRule();
      LOGGER.info("Rule fired: " + rule.getName());
   }
}
And we can register our DebugAgendaEventListener on the session using the following code snippet:
kieSession.addEventListener(new DebugAgendaEventListener());
When running the rules, our DebugAgendaEventListener will log the rule-name of the rules being fired. Note that the event provides a lot more data than just the rule name. For example, the event also contains the tuple of facts that caused the rule to match and fire.
4. AgendaFilter
An AgendaFilter is a Drools component that we can pass to the KieSession's fireAllRules method which allows to programmatically define which rules can be activated and which rules can not be activated (and thus fired). This makes it possible to isolate a single rule-firing within a rules session.
Say we have a suspicion that within a set of rules, one specific rule is giving issues. Debugging this single rule when a full rule-base can potentially fire can be problematic. In this case, we can decide to use an AgendaFilter to isolate this single rule. Drools comes with some pre-defined filters out-of-the-box, one of which is the RuleNameEqualsAgendaFilter, which, as the name implies, matches rules that have a name that is equal to the name set on the filter. By passing this filter to the fireAllRules method, we can filter which rules will be able to be put on the agenda and which rules can thus potentially fire. Hence, when we pass this filter to Drools, we can isolate the rule-firing of this single rule and thus better analyse the behaviour of this single on a given set of facts.
This is an example of how we can pass an AgendaFilter that only allows rules with the name Rule 2 LoanApproval to fire:
kieSession.fireAllRules(new RuleNameEqualsAgendaFilter("Rule 2 LoanApproval"));
This approach is also very effective when unit-testing rules, as it allows to test a single rule in isolation.
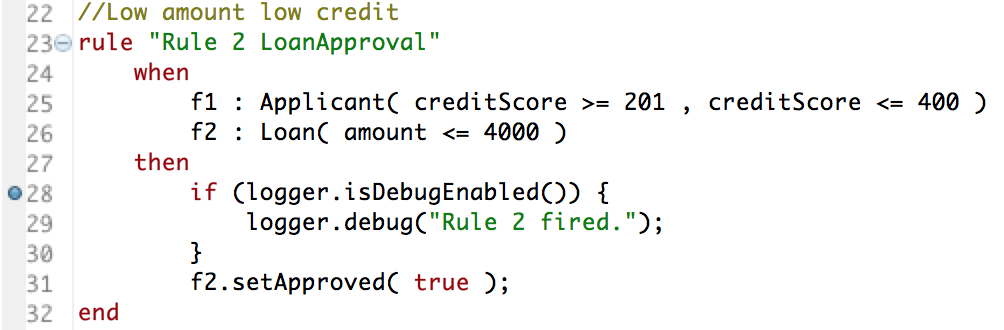
5. Drools Eclipse Tooling and breakpoints
The Drools tooling for Eclipse allows one to set breakpoints in the DRL rule definition file. More particular, it allows to set breakpoints in the RHS of a rule. Second, within Eclipse, an application can be debugged as a Drools Application. This makes it possible to set breakpoints in the RHS of specific rules that we want to debug and use the standard Eclipse debugger to step through the code of the RHS of rule.
Note that it is not possible to set breakpoints in the LHS of a rule.
Here we show how a breakpoint is set in the RHS of rule:
Next, we can debug the application as a Drools application:
Conclusion
Debugging rule-based applications can sometimes be perceived as difficult. This is most of the times due to the declarative nature of rules engines and the sophisticated algorithms on which they're based.
In this article we have shown five common practices to debug rule applications. These techniques can both be used at design-time, as well as runtime. This allows us to more easily analyse and inspect our rule-based applications and systems, and gives us a systematic approach to to troubleshoot potential problems in our applications.
The sample application code used in this article can be found here. To test the application, simply run the org.jboss.ddoyle.brms.debug.Main class from your favourite IDE, or run mvn clean install exec:java from a terminal in the project directory.

About the author:
Duncan Doyle is the Technical Marketing Manager for the JBoss BRMS and BPMSuite platforms at Red Hat. With a background in Red Hat Consulting and Services, Duncan has worked extensively with large Red Hat customers to build advanced, open-source, business-rules and business process management solutions.
He has a strong background in technologies and concepts like Service Oriented Architecture, Continuous Integration & Delivery, rules engines and BPM platforms and is a subject matter expert (SME) on multiple JBoss Middleware technologies, including, but not limited to, JBoss EAP, HornetQ, Fuse, DataGrid, BRMS and BPMSuite. When he's not working on open-source solutions and technology, he is building Lego with his son and daughter or jamming along some 90's rock-music on his Fender Stratocaster.