As the number of Ansible playbooks increases, and each playbook includes many individual tasks, both the overall log volume and the number of errors rise significantly.
To resolve these errors, analysts identify the failed playbook run and route the issue to an authorized specialist. That specialist then determines the best resolution based on business criteria.
This manual process is slow, error-prone, and fundamentally does not scale as automation grows.
This blog explores Ansible log monitoring, an AI quickstart designed to speed up the resolution process. Red Hat AI quickstarts are demo applications that show real-world AI use cases.
How this solution automates the Ansible error resolution workflow
This solution provides an automated pipeline that eliminates the manual steps described earlier. The system provides the following capabilities:
- Continuous log ingestion: Ingests and parses Ansible playbook logs in real time.
- Error detection and alerting: Detects failed tasks and generates alerts.
- Role-based error routing: Routes errors to the correct specialist based on their authorization level.
- Automated solution generation: Generates step-by-step solutions using cluster logs and a private knowledge base.
- Continuous improvement and observability: An evaluation system and observability tools to understand and improve the entire process.
- User interface: Displays the suggested solution and other relevant metrics in an intuitive way.
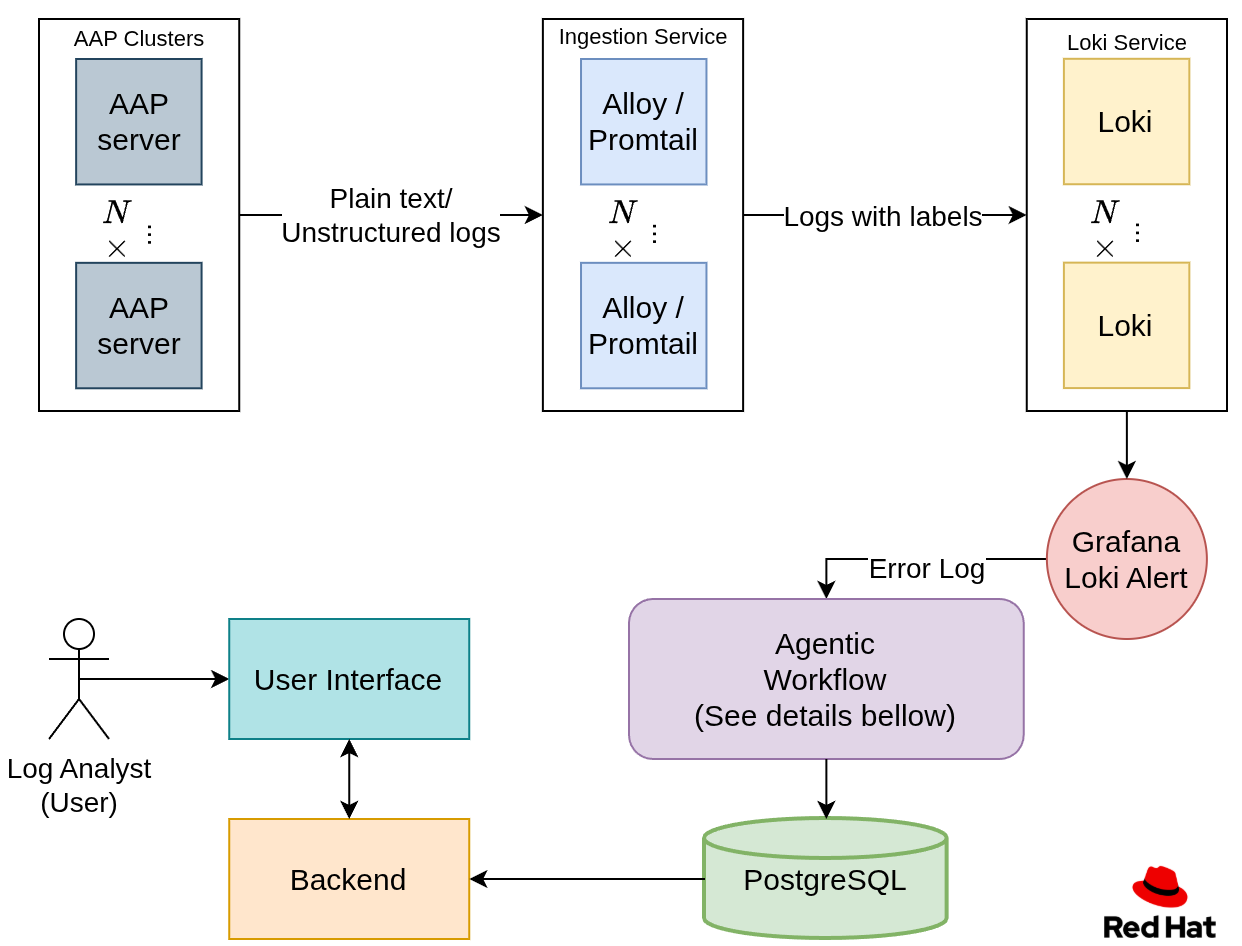
Ansible log ingestion
To ingest the logs, you need the following items:
- A location to store the executed Ansible playbook logs
- A service that ingests the logs and transforms them into a specific format
- A log database
This post uses Red Hat Ansible Automation Platform to store playbook executions. Ansible Automation Platform helps define, manage, and execute Ansible automation.
To ingest these logs in real time, we use Alloy, an ingestion and aggregation tool. You can point Alloy to the Ansible Automation Platform service to ingest each job's stdout.
During ingestion, regular expressions (regex) are used to define each entry and label.
This following example shows an Ansible playbook execution:
TASK [<task_name> : <task_description>]
Monday 04 August 2025  07:52:22 +0000 (0:00:01.388)       1:12:32.151 *********
ok: [host_name]
TASK [<task_name> : <task_description>]
Monday 04 August 2025  07:52:22 +0000 (0:00:00.019)       1:12:32.170 *********
failed: [host_name] <error message>
First, split each playbook into separate task entries. You can do this using the regex \n\n.
Next, assign metadata labels to each log entry. For example, you can label tasks based on their status (ok, failed, or fatal) using a regular expression like this:
"(?P<status>ok|failed|fatal):\\s+\\[(?P<host>[^\\]]+)\\]"After ingesting and labeling the logs, the next step is to store them and make them queryable. For this, we use Loki: a database designed for storing logs and querying them by labels. For example, you can filter with the status = ‘failed’label using LogQL or apply regex in the query as an additional search mechanism.
After parsing the log file into individual TASK entries, labeling them, and storing them, let’s look at how to handle those error logs.
Agentic workflow
Once the error logs are stored in the Loki database. Let's have a look at Figure 2 and dive in step by step.
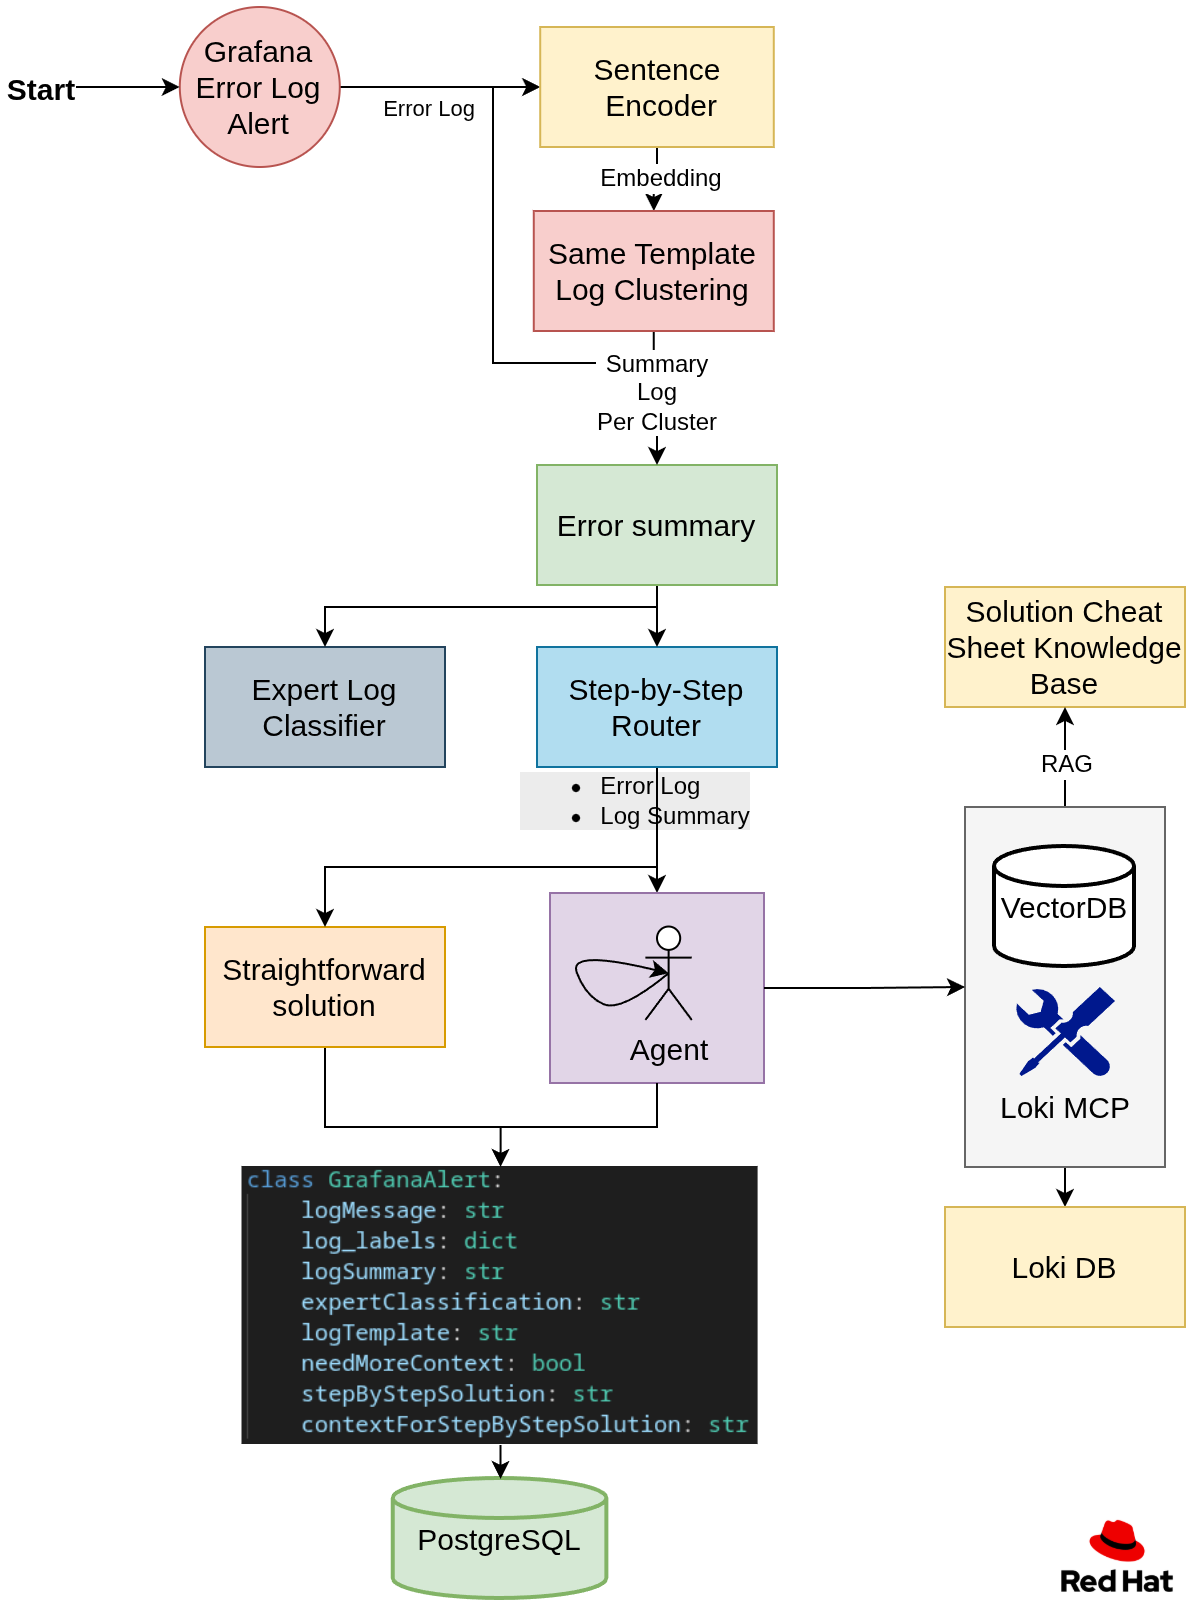
Step 1: Define the error template
Many logs are generated from the same log template. To group them, each log was embedded using a pre-trained sentence encoder. The resulting embeddings were then clustered by training a clustering model from scratch. Each cluster represents a log template.
For example, consider the following three logs:
1. error: user id 10 already exists.
2. error: user id 15 already exists.
3. error: password of user itayk is wrong.
Looking at the logs above, logs 1 and 2 are generated from the log template:
error: user id <user_id> already exists.Grouping by template prevents the system from generating duplicate solutions for the same error.
Step 2: Summary and expert classification
The user interface includes a summary and classification by authorization for each log template. Users can filter errors based on their authorization level. For example, an analyst with AWS authentication can filter by their authorization to view only error summaries related to AWS.
Step 3: Creating a step-by-step solution
We use a router to determine if we need more context to solve the problem or whether the log error alone is enough to generate the step-by-step solution. If the system requires more context, we will spin up an agent that collects context using the following tools:
Loki Model Context Protocol (MCP)
The Loki MCP server enriches log analysis by querying the Loki log database to fetch additional log context. The available MCP tools include:
get_play_recap: Returns the play recap and profile tasks for the executed job, providing a high-level summary of the TASKs executed by the playbook.PLAY RECAP ********************************************************************* <host_name> : ok=<ok_count> changed=<changed_count> unreachable=<unreachable_count> failed=<failed_count> skipped=<skipped_count> rescued=<rescued_count> ignored=<ignored_count> =============================================================================== <role_or_task_group> : <task_description> ------------------------------- <duration> <role_or_task_group> : <task_description> ------------------------------- <duration> ...get_lines_above: Retrieves a set number of lines that occurred before a specific log line.get_logs_by_file_name: Retrieves logs from a particular file with time ranges relative to a reference timestamp.search_logs_by_text: Searches for logs containing specific text within a file.This project uses an enhanced fork with additional query capabilities.
Knowledge base retrieval
To ensure the agent uses historical expertise when generating solutions, we maintain a knowledge base of recurring problems and their solutions. Analysts create and annotate these, and the agent can retrieve them using retrieval-augmented generation (RAG) as needed.
Analysts can add recurring problems and solutions over time. This solution includes a basic knowledge base you can easily extend.
Step 4: Store
Store the generated results for each log in a PostgreSQL database as a payload.
Training and inference stages
Our algorithm uses a batch training approach, retraining the clustering model to determine the templates at set intervals, such as every night.
At inference time, the system uses the latest trained clustering algorithm.
Observability and user interfaces
So we generated suggestions for solving errors, but how can we tell when the agent is failing? Identifying where the agent fails will help you adjust its behavior to meet expectations.
Phoenix tracing observability
To view each agentic step, we can use a tracing mechanism that shows all the agent's intermediate inputs and outputs. We chose Phoenix, an open source solution for monitoring and tracing (Figure 3).
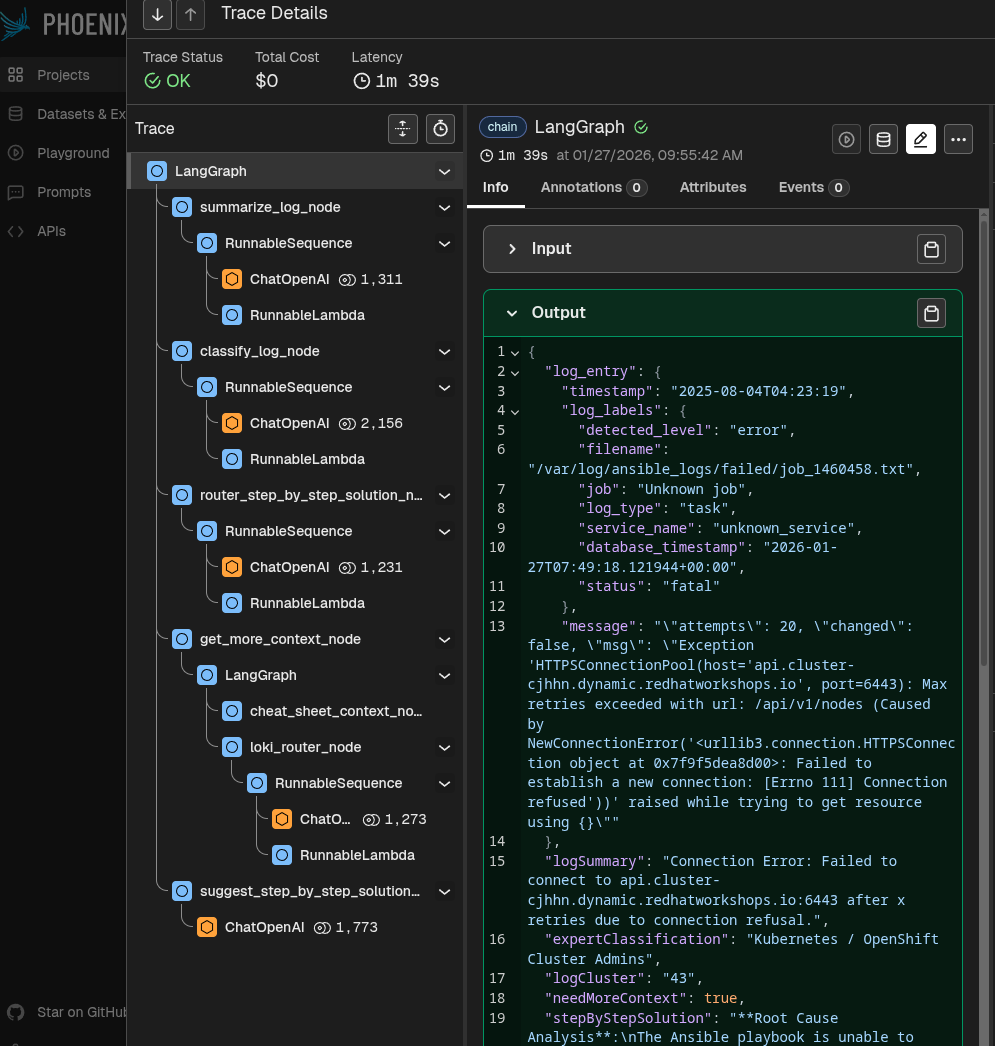
This way, you can see the input and output of each step, understand exactly where the agent is failing in a specific case.
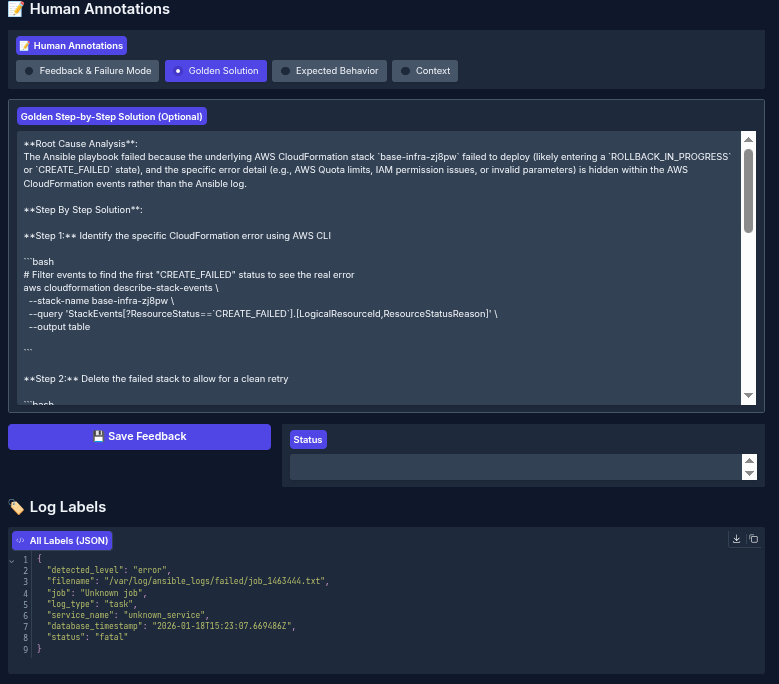
Annotation interface: Annotation and evaluation
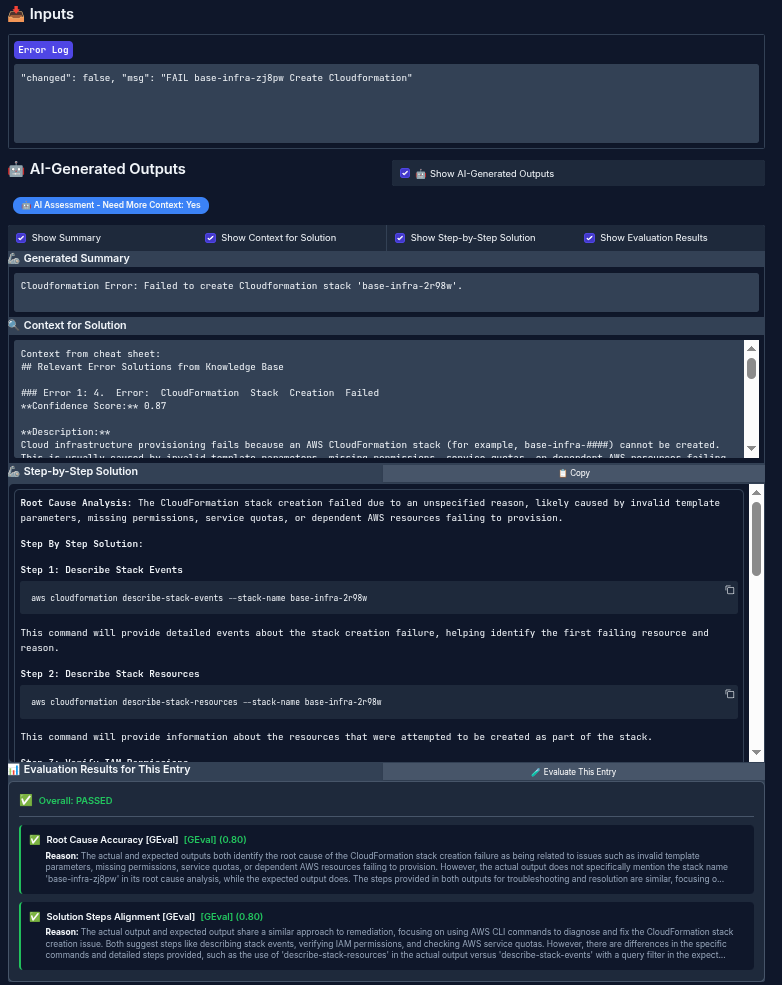
The annotation interface provides a dedicated workspace designed for reviewing and assessing the system's log-processing results. It presents the original input log entry, the system's generated outputs, and the evaluation results side-by-side. This layout enables domain experts to thoroughly evaluate the system's behavior.
Through this interface, specialists can:
- Define the correct (golden) expected output for each error log
- Provide detailed feedback on the system's generated result
- Assess if the agent needed additional context
- Indicate whether any important context was missing and/or suggest better/more appropriate context that should have been retrieved
See Figure 4 for an example of the human interface in action.
After defining the expected output, run an evaluation to see how the agentic output aligns with the specialist golden output (Figure 5).
This process lets you define expectations for the system, run evaluations, identify failures, and improve the workflow to get better results.
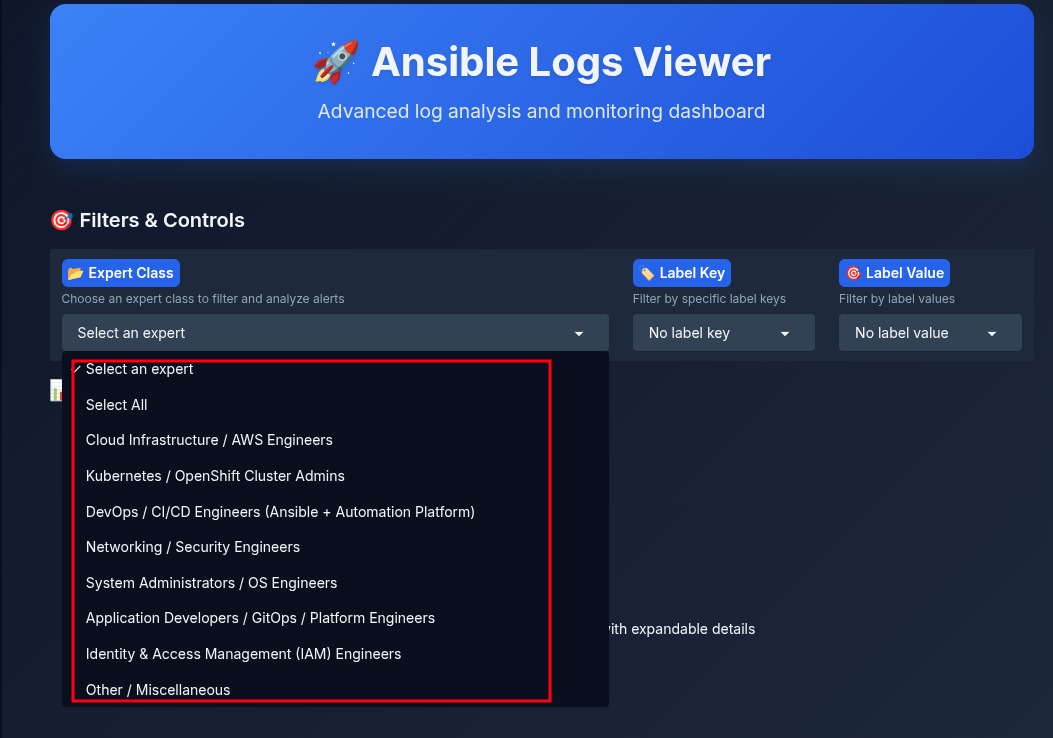
Analyst interface
Analysts no longer need to manually check Ansible job logs. By connecting this agent to the Ansible Automation Platform cluster, you can use the Analyst interface instead. In the interface, the analyst selects a specialty/expertise, as shown in Figure 6.
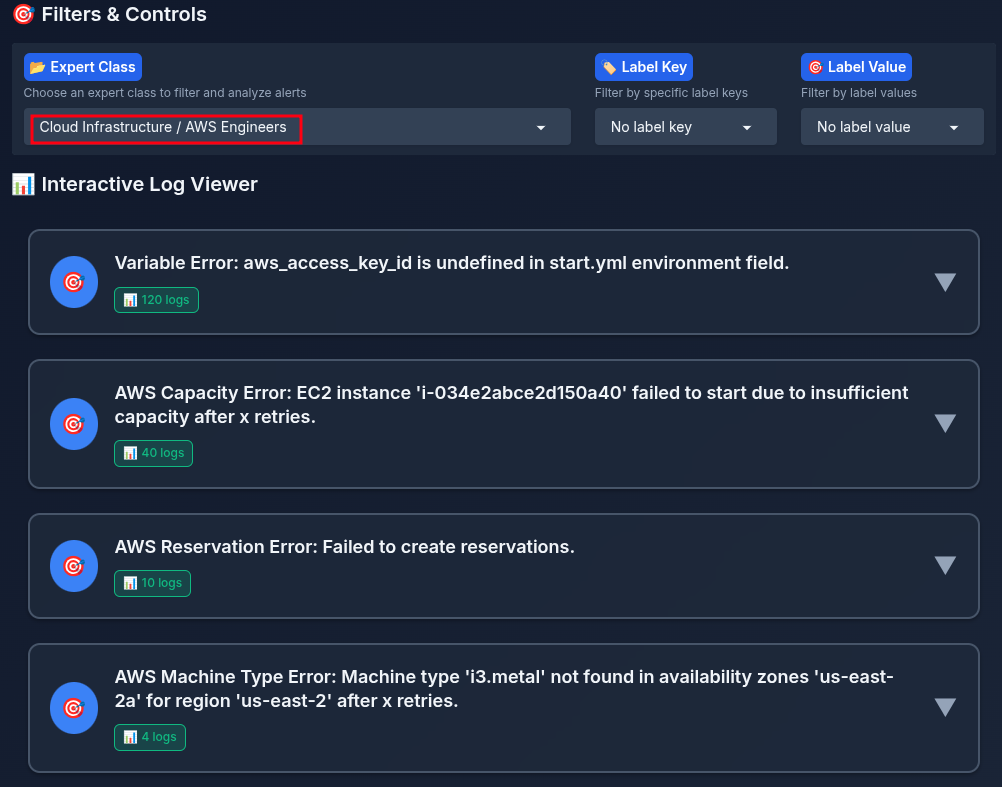
After selecting a specialty, the analyst can view error summaries they are authorized to resolve (Figure 7).
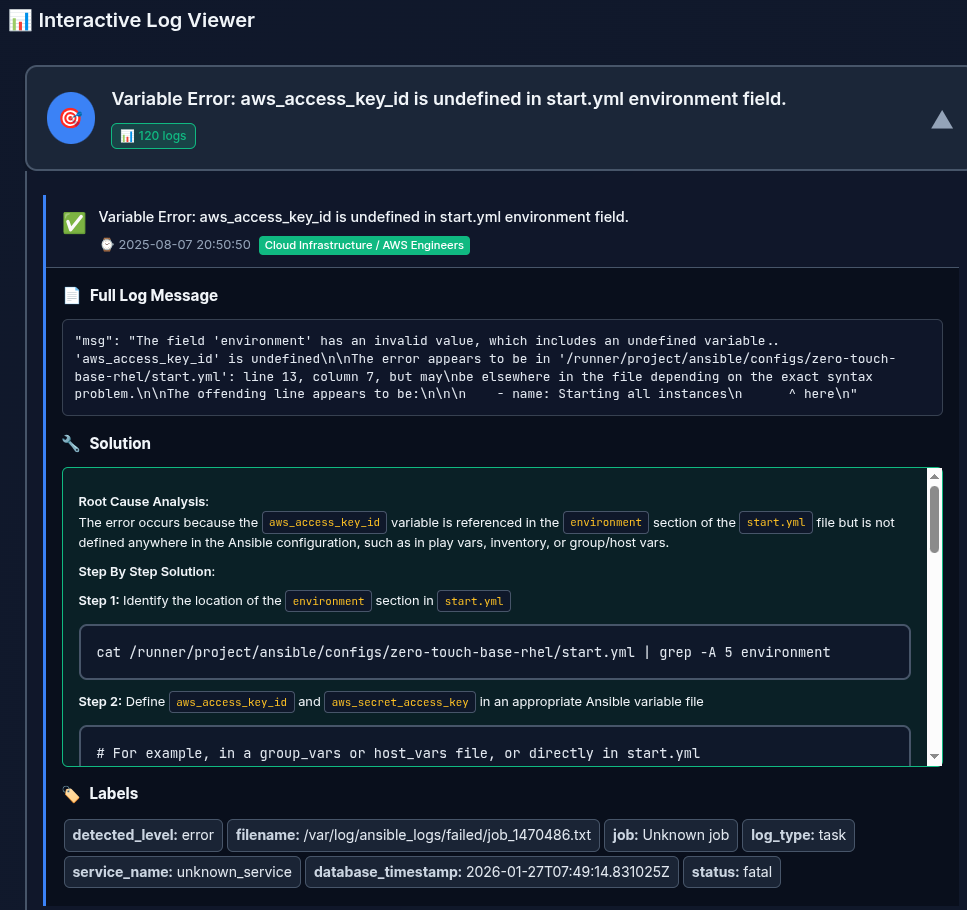
When you click a summary, the UI shows the generated step-by-step solution, timestamps, and labels (Figure 8).
Wrap up
This article explored the Ansible log monitoring agent AI quickstart, which helps you resolve Ansible execution errors faster.
We covered how the agentic system creates contextual, step-by-step solutions for Ansible errors. We also explained how to use an annotation interface to define expected (golden) outputs and an evaluation mechanism to measure agent performance against those standards.
Try it yourself: Accelerate Ansible troubleshooting with intelligent log analysis