Managing AI infrastructure in production can often feel overwhelming. A single vLLM model deployment can generate hundreds of metrics across GPU utilization, token throughput, cache efficiency, and latency measurements. Add OpenShift cluster metrics, and you're looking at thousands of data points that need constant monitoring.
As a result, most teams either ignore metrics entirely (dangerous), get lost in dashboards full of technical jargon (ineffective), or spend hours manually correlating data across systems (inefficient). What if you could just ask "How is my GPU performing?" or "Why is my model slow?" and get clear, actionable answers?
A team of Red Hatters, including Sandip Gahlot, Jianrong Zhang, Abdul Hameed, Manna Kong, and myself, created an AI quickstart to transform complex infrastructure monitoring into an intelligent, conversational experience. Built specifically for Red Hat OpenShift AI environments, this quickstart provides true root-cause visibility into your AI workloads and the underlying Red Hat OpenShift cluster. It goes beyond basic metrics by leveraging an LLM-powered analysis engine, which uses Korelt8r to seamlessly correlate the four pillars of observability: real-time metrics, logs, traces, and alerts. This integrated approach ensures you get clear, actionable insights through natural language interactions.
Learn more: Introducing AI quickstarts
Introducing the AI Observability Metric Summarizer
Traditional monitoring tools weren't designed for this complexity. They show you what is happening, but not why it matters or what to do about it. Our AI-powered approach provides:
- Context-aware analysis: Understands AI-specific performance patterns
- Intelligent correlation: Connects GPU metrics to business impact
- Actionable recommendations: Specific steps to improve performance
- Predictive insights: Early warning before problems impact users
Why AI observability matters for your organization
As AI adoption accelerates, the complexity increases. There are more models, more clusters, more metrics, more dashboards. Without the right tools, it quickly becomes impossible to see the full picture, let alone act on it. That's where the AI Observability Metric Summarizer changes the game. Organizations need tools that:
- Scale with AI workloads: Go beyond a few models in one cluster. You need visibility across hundreds of models, namespaces, and clusters, with summaries that stay clear even as your architecture grows more complex.
- Accessible insights: Observability shouldn't be locked in the heads of SREs. Product managers, data scientists, platform engineers, and leadership should all be able to ask, "How are things going?" and get a plain-language answer they can act on.
- Provide business value: Metrics alone don't move the needle. You need a narrative that connects GPU utilization, latency, and error rates to customer experience, cost efficiency, and SLAs so you can make better business decisions, not just better dashboards.
- Enable proactive optimization: Get early warnings and clear recommendations: where to right-size, which models are at risk, and where performance or cost issues are likely to appear next.
The AI Observability Metric Summarizer turns raw telemetry into stories, recommendations, and next steps, helping your teams run AI workloads with confidence, speed, and control.
Key features of AI Observability Metric Summarizer
The user interface of AI Observability Metric Summarizer features the multi-page Streamlit dashboard, with three specialized interfaces for a comprehensive analysis:
- vLLM dashboard: Real-time GPU and model performance metrics
- OpenShift dashboard: Cluster-wide and namespace-specific infrastructure monitoring
- Chat interface: Conversational interaction with Prometheus, Alertmanager, Tempo, and Loki
Plus, there's seamless integration for AI assistant support for Claude Desktop and Cursor IDE, through the Model Context Protocol (MCP). The integrated MCP server provides more than 20 specialized tools, including:
- Metric discovery and search with semantic understanding
- PromQL query generation and execution
- Natural language result explanation
- AI-powered analysis for vLLM and OpenShift metrics
- Report generation in HTML, PDF, and Markdown formats
Multi-model AI support provides flexible summarization using either your choice of external models, such as OpenAI GPT-4, Anthropic Claude, Google Gemini, or local models such as Llama 3.1-8B and Llama 3.2 (1B/3B/70B variants).
Intelligent query processing transforms your questions, written in natural language, into precise PromQL queries with context-aware metric selection.
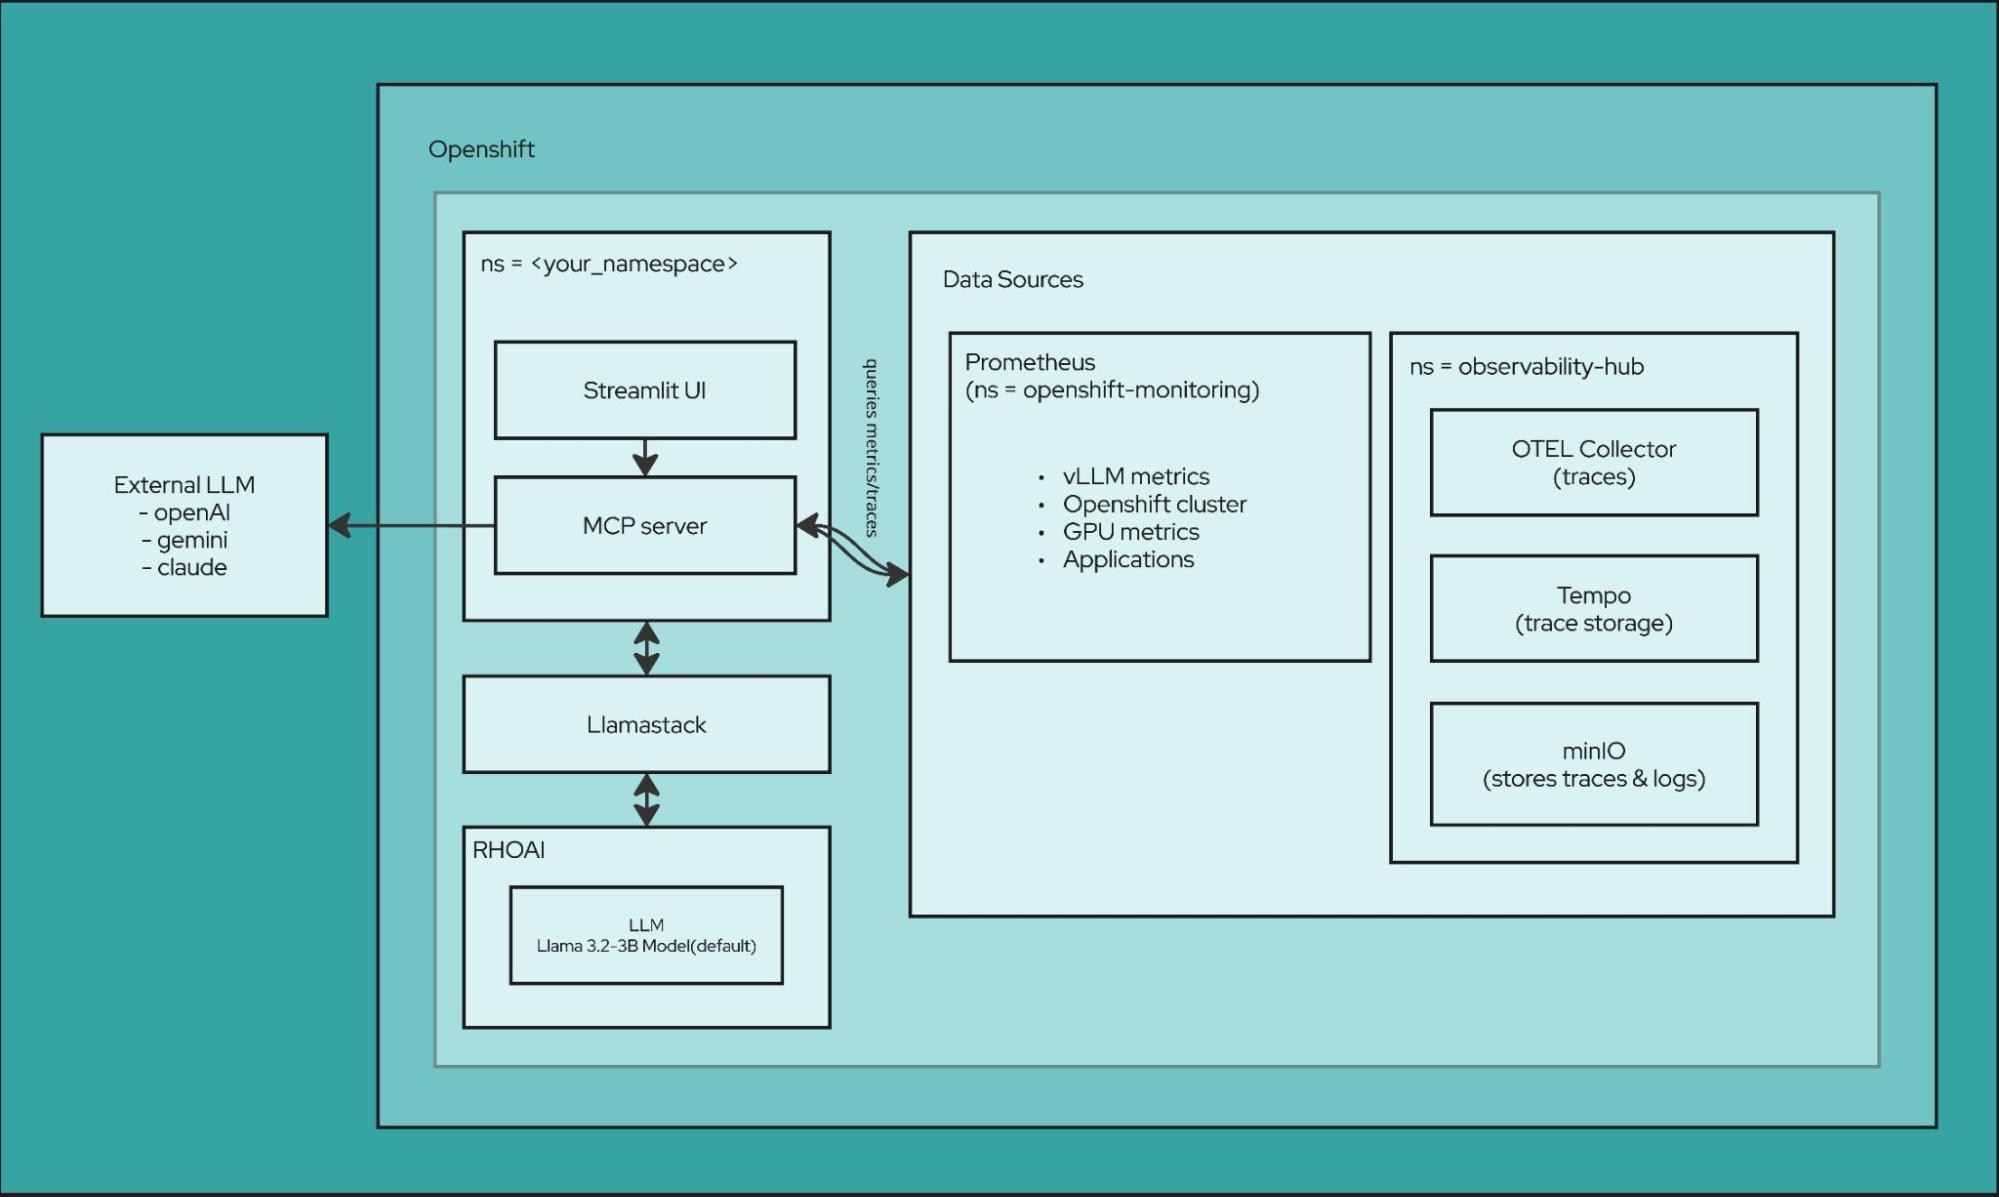
Observability stack
Of course, first and foremost this is all about observability. There are lots of tools at work in this space, and AI Observability Metric Summarizer can interface with each of them:
- Prometheus/Thanos: Metrics collection and long-term storage with multi-cluster aggregation
- Tempo: Distributed tracing for end-to-end request flow analysis
- Loki: Centralized log aggregation and querying for correlated troubleshooting
- OpenTelemetry Collector: Automatic instrumentation for Python applications with trace and metrics export
- MinIO: Object storage backend for traces and logs For monitoring and alerting:
- vLLM Metrics: GPU temperature, utilization, memory usage, request throughput, and token statistics
- DCGM Integration: Deep GPU diagnostics including power consumption and error tracking
- AI-Powered Alerting: Slack notifications with intelligent metric summaries and trend analysis
- Custom Alert Rules: CronJob-based monitoring with configurable thresholds
- Openshift Metrics: System level metrics about the infrastructure For backend services:
- llama-stack: Backend API powering LLM inference and metric analysis
- llm-service: Model serving layer handling inference requests
- metric-ui-svc: Streamlit application service
- mcp-server: MCP server exposing observability tools
Our Streamlit UI
Figure 2 shows the main dashboard of the AI Observability Metric Summarizer. At the top is the vLLM Metric Summarizer view, which generates a natural-language model insights summary, alongside a metric dashboard with key vLLM GPU and latency statistics and trends over time. On the left, you can choose the namespace, model, and time range. At the bottom of the window is a space to chat with Prometheus, where you can ask questions, written in natural language, about your metrics and get AI-generated insights.
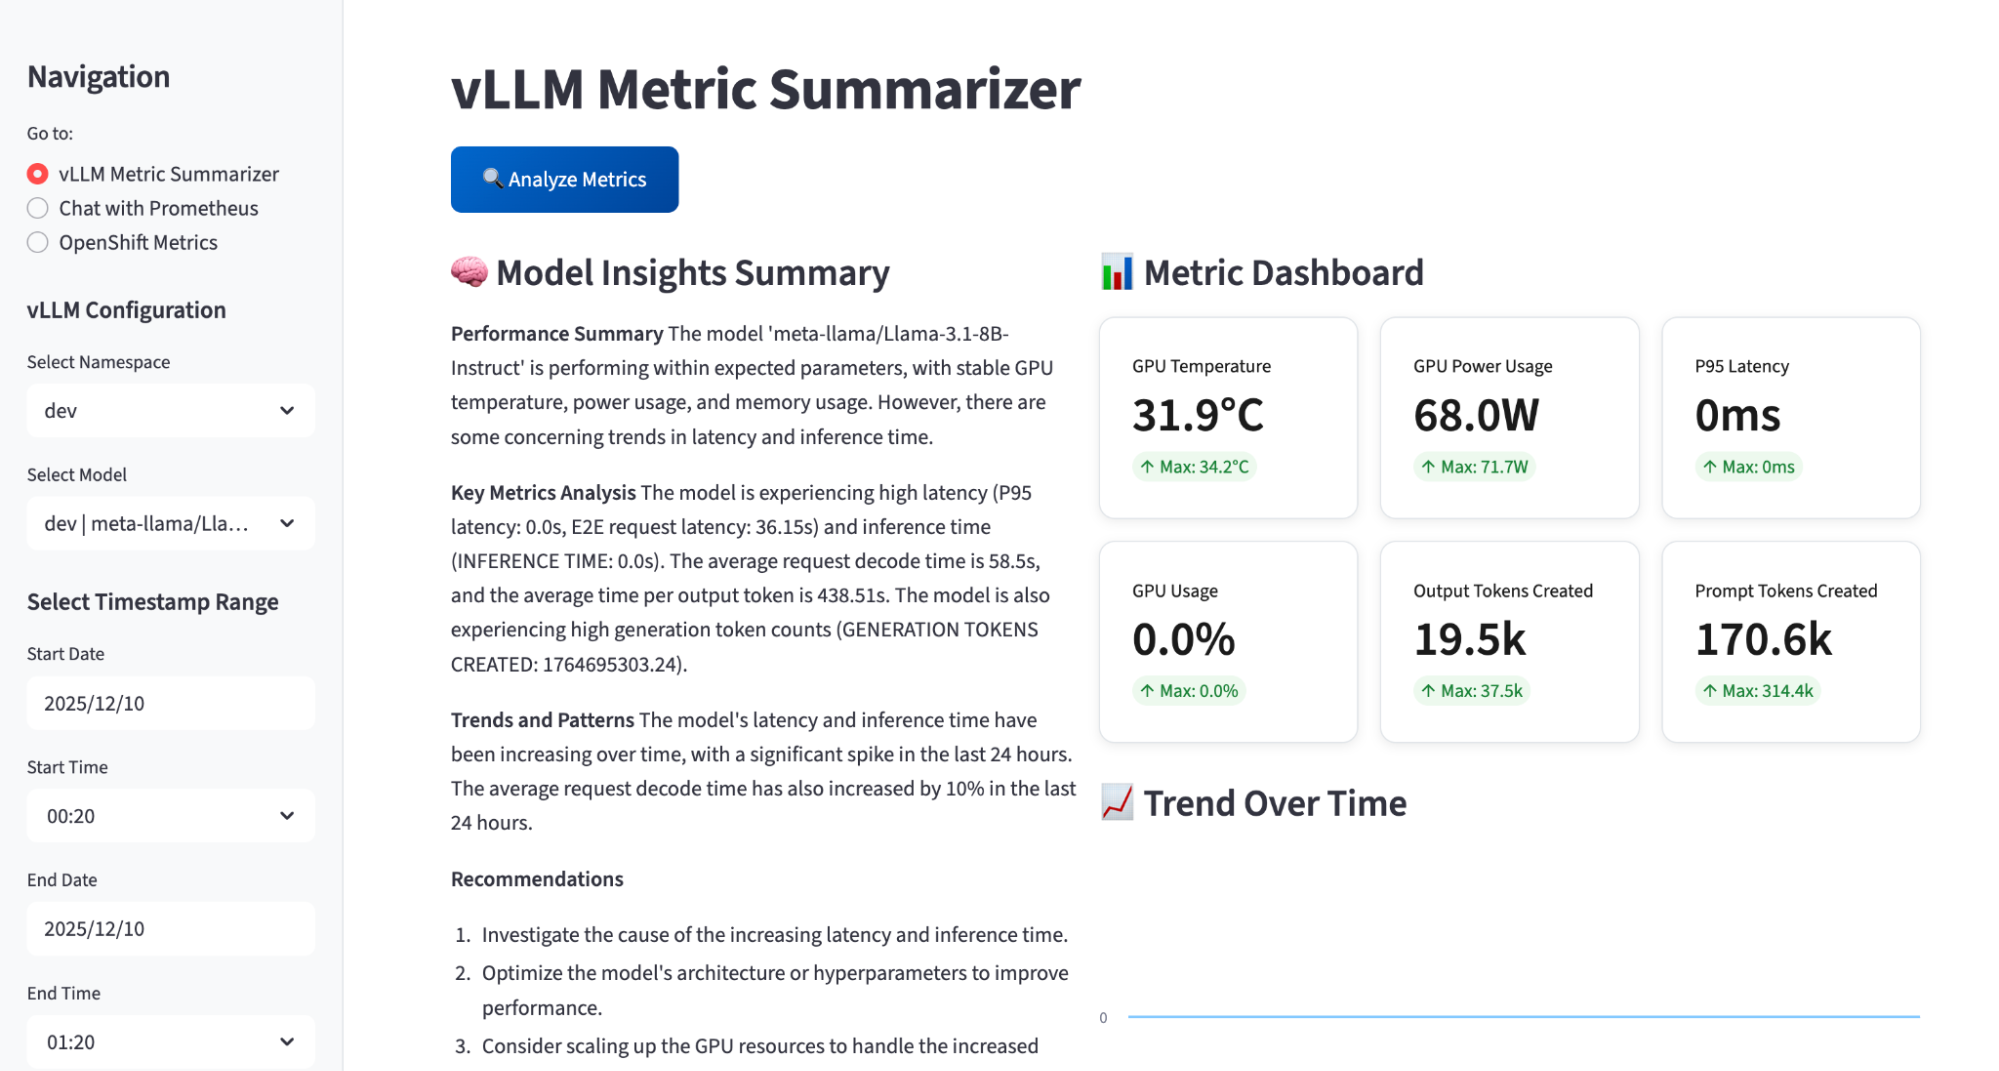
Figure 3 highlights the Chat with Prometheus view. In this tab, you can ask questions about any Prometheus metric across the cluster, pick the AI model to power the analysis, and verify that MCP tools are connected. The app also pulls data points from logs and traces coming from Loki and Tempo, and uses Korel8r to correlate metrics, logs, and traces so the AI can return richer, end-to-end insights about the system.
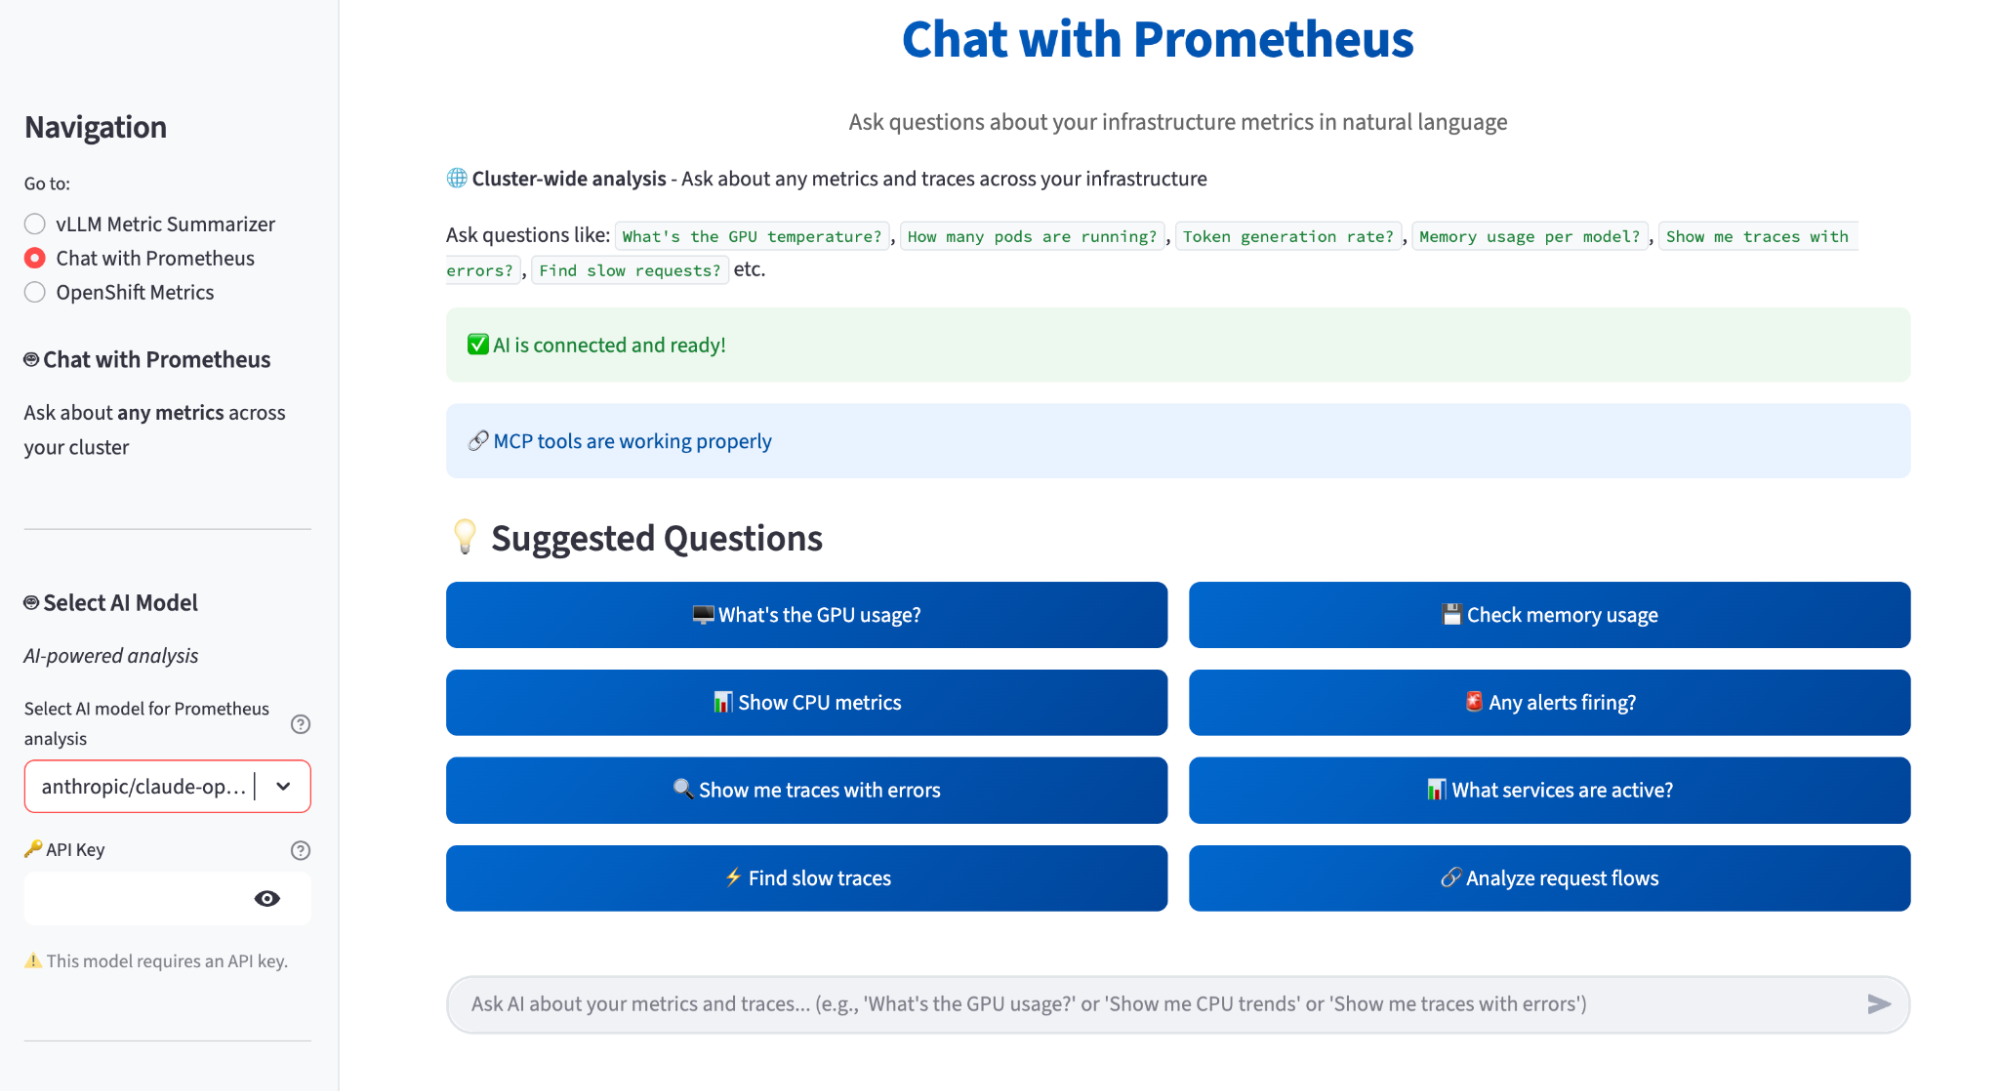
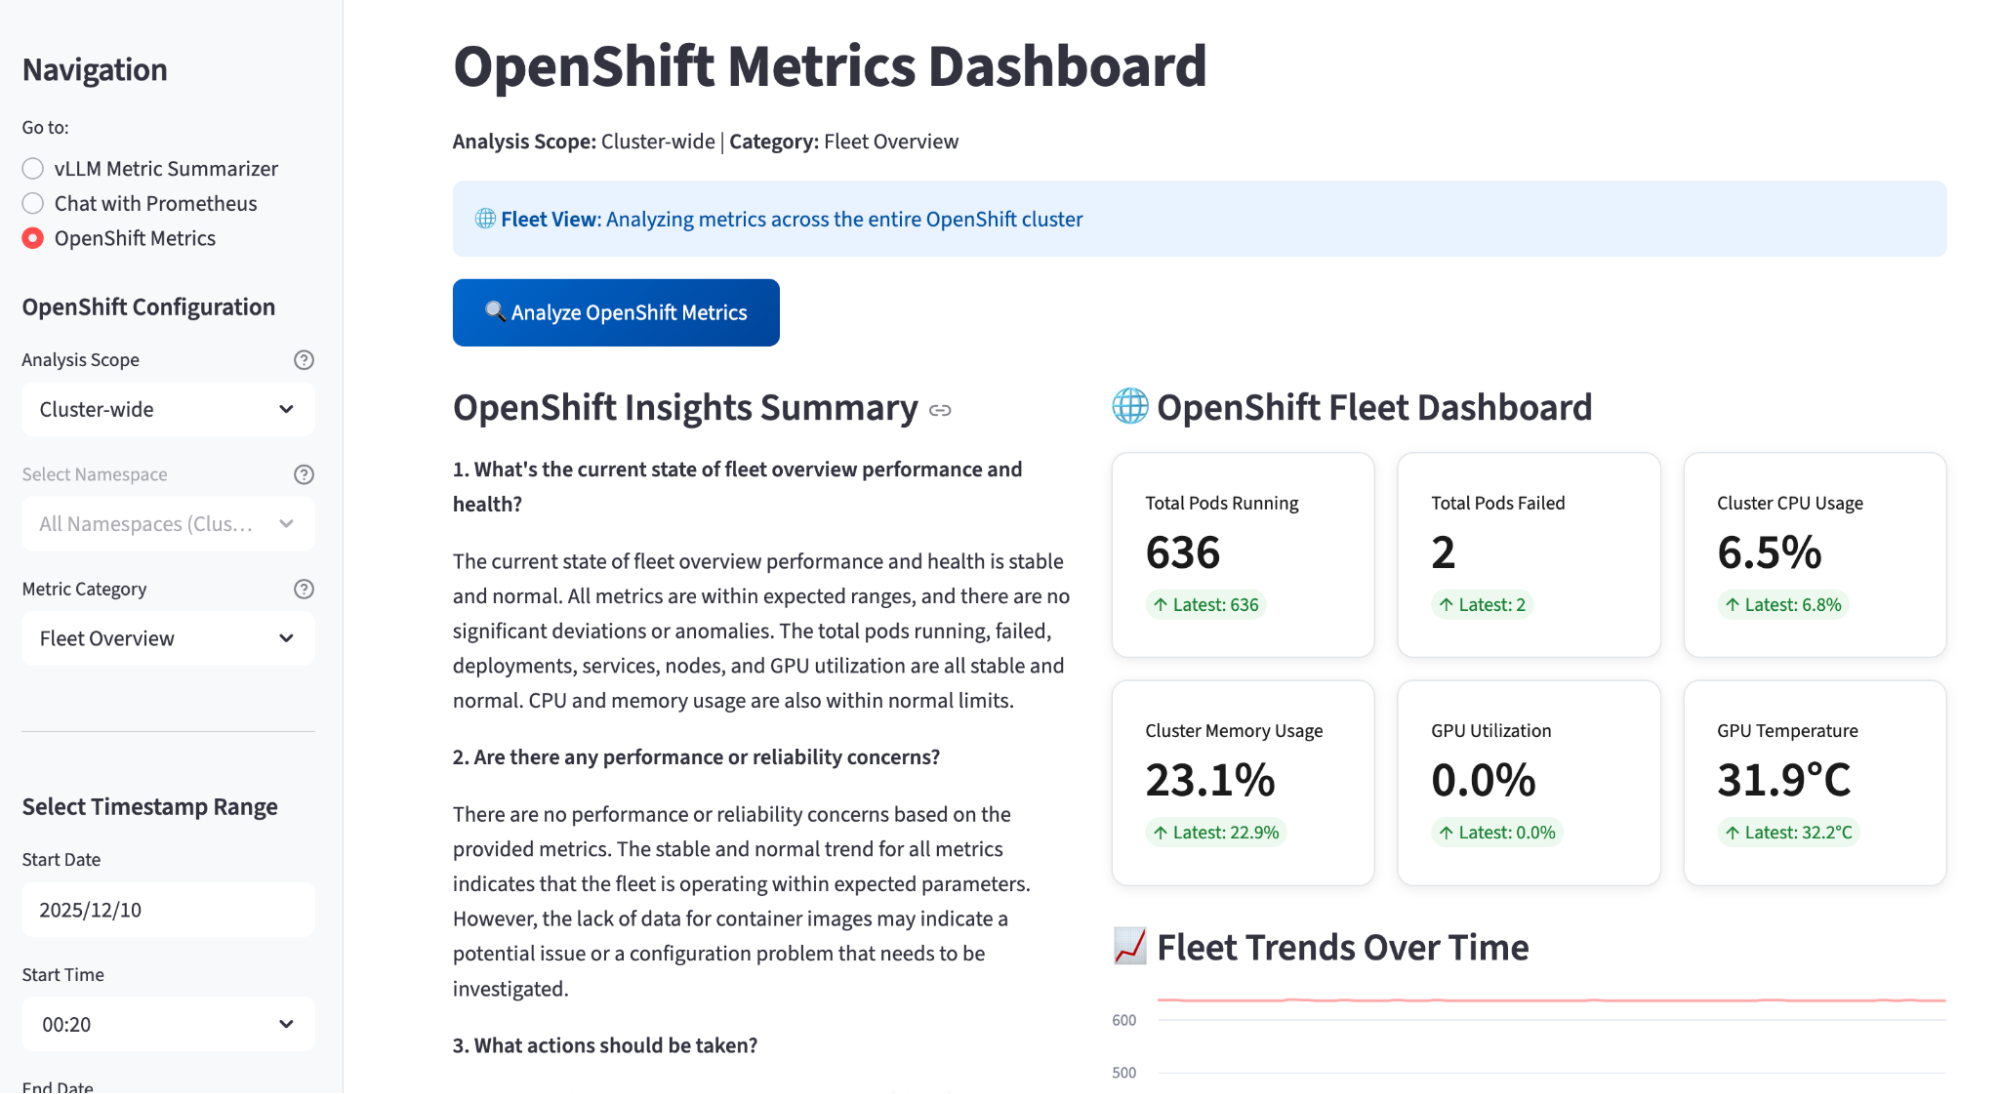
Figure 4 shows the OpenShift Metrics Dashboard view. In this tab, the app analyzes cluster-wide OpenShift metrics and generates an OpenShift insights summary that answers questions like overall fleet health, reliability concerns, and recommended actions. On the right, the OpenShift Fleet Dashboard presents key KPIs, such as total pods running and failed, cluster CPU and memory usage, GPU utilization, and GPU temperature, with trend charts over time. On the left, you can choose the analysis scope, metric category (for example, Fleet Overview), and a timestamp range for the AI-powered summary.
Installation in one command
It's easy to install the AI Observability Metric Summarizer. First, log in to your OpenShift cluster on terminal with oc login as usual.
Download the source code from our repository, change directory to it, and deploy a complete AI observability stack:
$ git clone git@github.com:rh-ai-quickstart/ai-observability-summarizer.git
$ cd ai-observability-summarizer
$ make install NAMESPACE=your-namespace
After the installation is complete, open OpenShift Console in a web browser and navigate to Networking > Routes > Streamlit UI. Try asking your first question, such as "How is my model performing?" Then use it to get instant insights about GPU utilization, token throughput, and latency, or to generate reports to share with your team!
Ready to transform your AI monitoring?
Stop drowning in dashboards and metrics. Start having real conversations with your infrastructure.
Whether you're running a single proof-of-concept model or operating a full-scale enterprise AI platform, this intelligent observability layer helps you:
- Slash MTTR: Turn "What's going on?" from a multi-hour war room into a few minutes of targeted insight.
- Cut costs with confidence: Get AI-powered recommendations on where to right-size, consolidate, or optimize GPU and cloud spend.
- Prevent outages, not just react: Use predictive analysis to spot unhealthy trends before they become incidents.
- Scale without blind spots: Maintain clear, end-to-end visibility as you add more models, clusters, and teams.
To get started, be sure to read the docs, and we'd love to see you join our community!
Also, watch this video about it from KubeCon North America 2025: