Red Hat Advanced Cluster Security for Kubernetes is constantly expanding its capabilities to give you better security visibility and operational control across your Red Hat OpenShift clusters. We are pleased to announce an update that allows your organization to seamlessly integrate key Red Hat Advanced Cluster Security component health and performance into your existing, custom monitoring infrastructure, providing centralized observability and proactive alerting.
New metrics
The new metrics are served on the API endpoint. You'll need to configure a Prometheus server that will scrape the metrics. The Red Hat Advanced Cluster Security API backend will authenticated and authorized proper credentials.
The exposed metrics will include only the resources included in the access scope, configured for the credentials. You can configure different Prometheus servers with differently scoped credentials to provide teams with limited visibility of clusters and namespaces.
Red Hat Advanced Cluster Security allows you to enable or disable a few predefined metrics via the console (Figure 1).
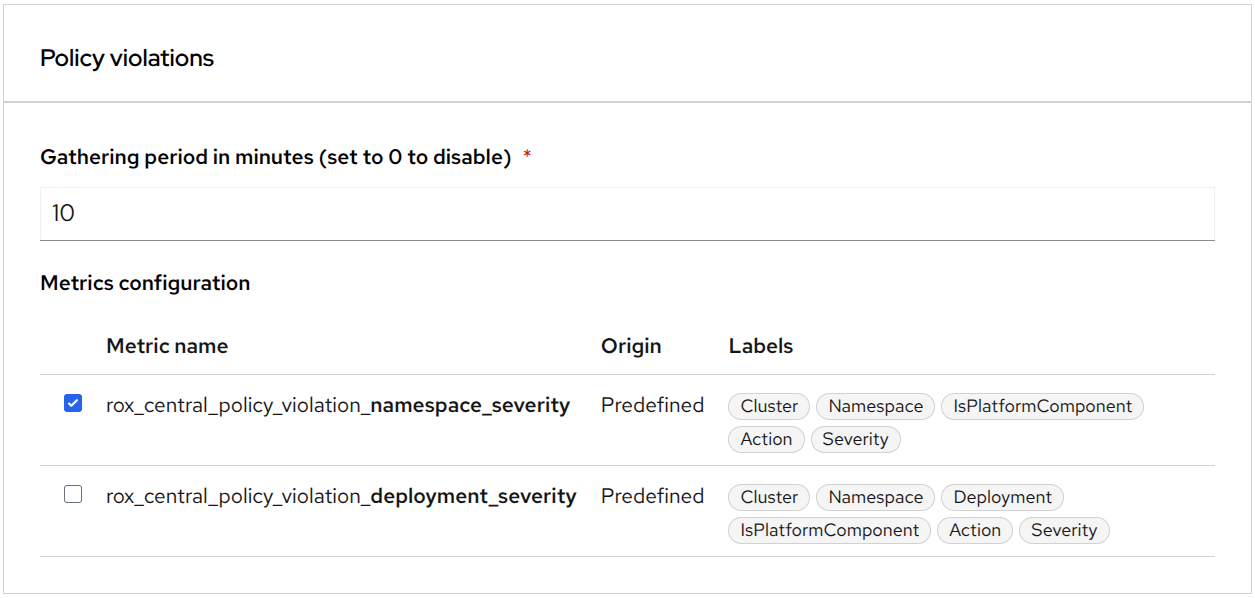
You can define custom metrics with different sets of labels via API. You can learn how to configure them in Chapter 15. Monitoring RHACS | Configuring | Red Hat Advanced Cluster Security for Kubernetes | 4.9.
Visualizing security posture
The enhanced custom monitoring capabilities allow you to pull critical security posture data for visualization in tools like Grafana and Perses, and to integrate it directly into the OpenShift console. Comprehensive security dashboards should break down security data by severity, environment, and trend to provide actionable intelligence to developers, security analysts, and compliance officers.
Identifying the 10 most vulnerable images
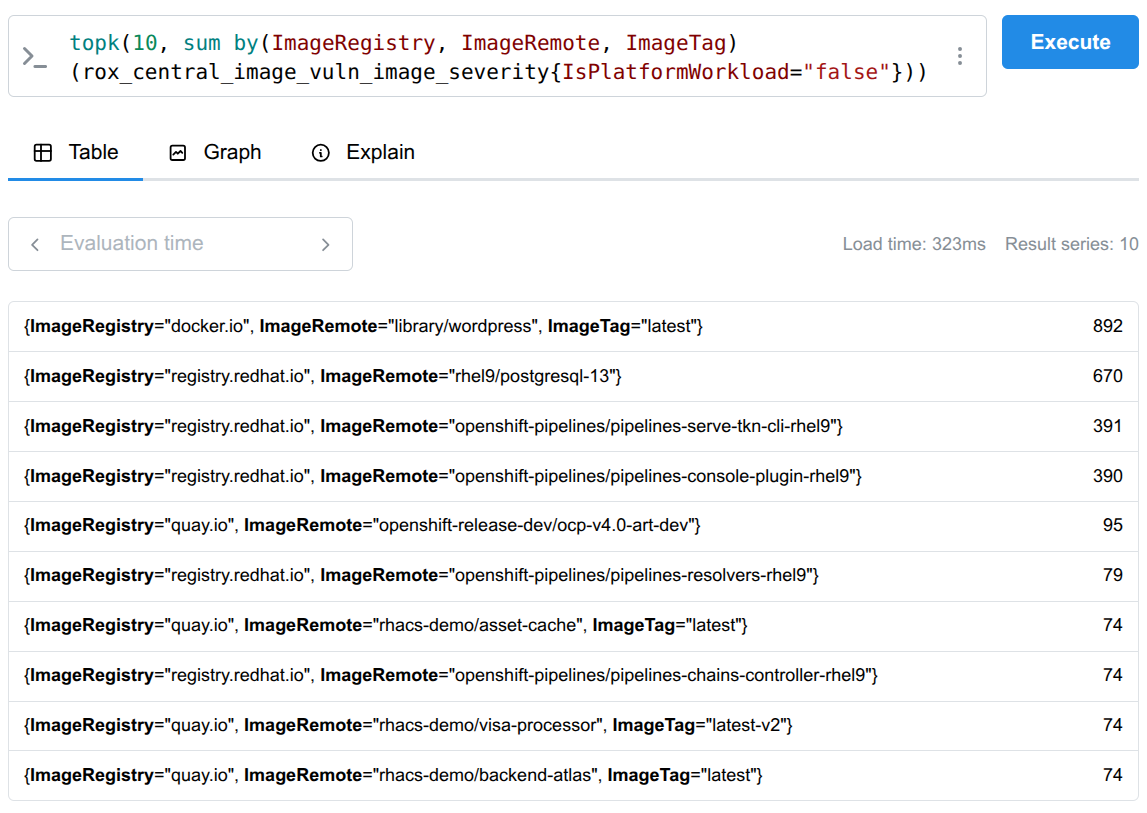
To generate this high-impact list, configure a custom metric to gather the necessary security data. By adding the following configuration, you ensure that Red Hat Advanced Cluster Security collects image vulnerability data with key labels like ImageRegistry, ImageRemote, ImageTag, and Severity:
"metrics": {
  "imageVulnerabilities": {
    "gatheringPeriodMinutes": 60,
    "descriptors": {
      "image_severity": {
        "labels": [
          "ImageRegistry", "ImageRemote", "ImageTag",
          "IsPlatformWorkload", "Severity", "IsFixable"
        ]
      }
    }
  }
}
The resulting records will look like this:
rox_central_image_vuln_image_severity{ImageRegistry="docker.io",ImageRemote="library/wordpress",ImageTag="latest",IsFixable="true",IsPlatformWorkload="false",Severity="MODERATE_VULNERABILITY_SEVERITY"} 6Once the data is collected, you can query your Prometheus server using the topk function to instantly identify the worst offenders. This allows you to prioritize images with the highest number of critical or fixable vulnerabilities (Figure 2).
Prioritizing top node CVEs
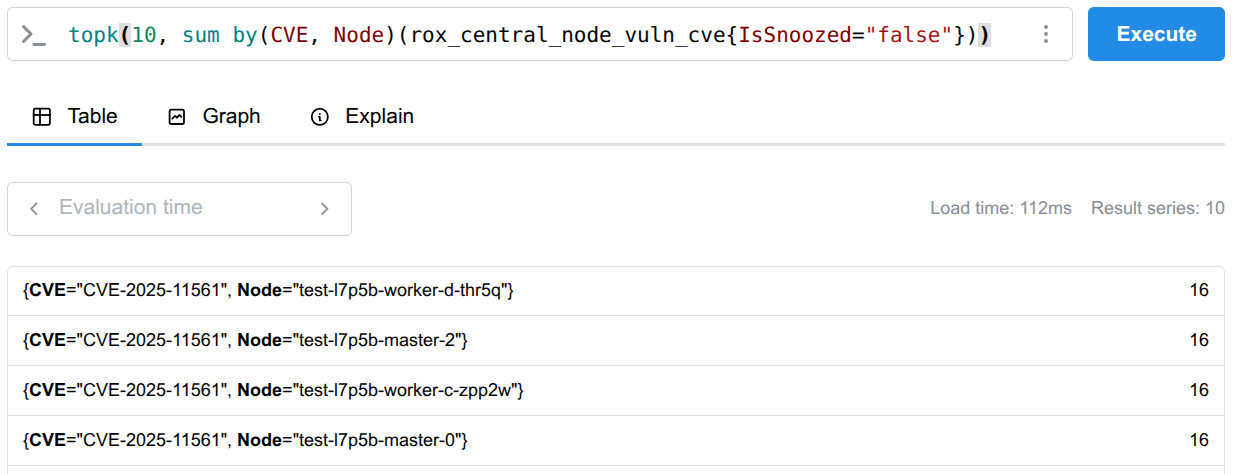
Similar to how you identify top image offenders, you can use Prometheus and the topk function to query and display the top node CVEs. This process allows you to quickly pinpoint the most severe or prevalent common vulnerabilities and exposures (CVEs) affecting your nodes (Figure 3).
Violation count by policy
To get this precise view where violations are broken down by the specific policy name, you need to create a custom metric. Define a new metric configuration to include the necessary context labels as follows:
"policyViolations": {
"gatheringPeriodMinutes": 60,
"descriptors": {
"severity": {
"labels": ["Policy", "Severity", "Deployment", "State"]
}
}
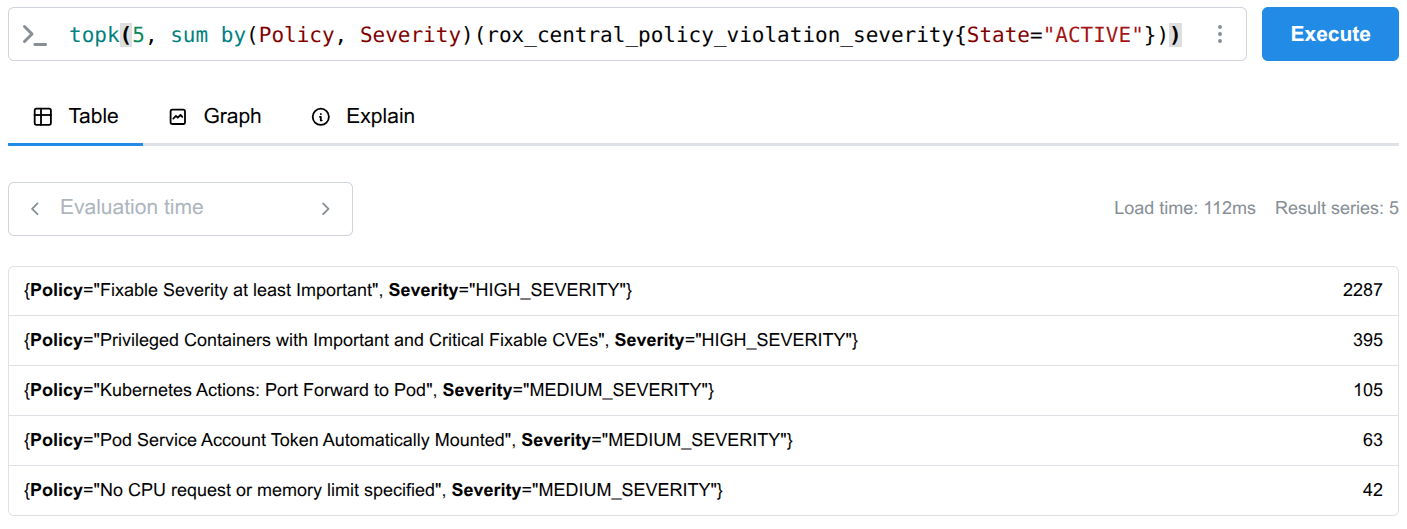
}Once this data is collected, you can use the topk function to instantly see which policies are violated most frequently, allowing you to prioritize enforcement and focus your compliance efforts (Figure 4):
You can also track the number of policy violations over time (Figure 5). Use predefined metrics like rox_central_policy_violation_namespace_severity to define a chart that tracks risk trends.
sum by (Severity)(rox_central_policy_violation_namespace_severity)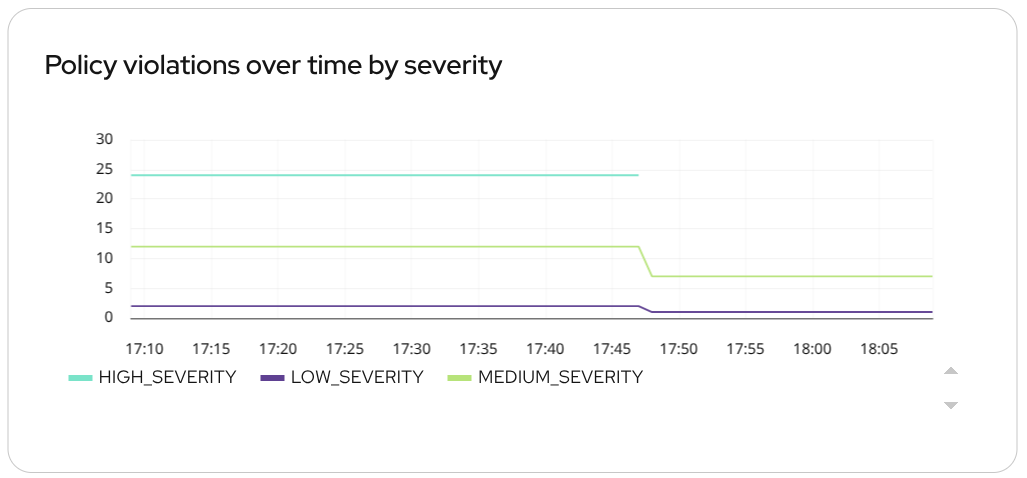
Metrics from this category can also include Cluster and Namespace labels, allowing you to parameterize your charts and see exactly where violations are occurring, enabling teams to target specific development teams or environments.
Using cluster health for alerting
The Red Hat Advanced Cluster Security Central pod already exposes a limited set of basic health metrics on an internal metrics port. Access to those existing metrics does not require authentication and the data is not scoped. For more details on these metrics, refer to the documentation on monitoring Red Hat Advanced Cluster Security.
The new Prometheus metrics offer more value and control. These new metrics expose more sensitive data, such as cluster and namespace names, and also allow you to build rich, flexible dashboards using tools like Grafana and Perses. It is also about establishing proactive alerts that ensure your Red Hat Advanced Cluster Security platform is operational.
By scraping the standard Red Hat Advanced Cluster Security component health metrics, you can configure granular, highly actionable alerts within your Prometheus Alertmanager.
Integrating alerts directly into your existing Alertmanager pipelines means the security team receives critical notifications through familiar channels (i.e., Slack and email), minimizing mean time to recovery (MTTR) for the security platform.
Secured cluster health check
The new rox_central_health_cluster_info metric provides the current state of every secured cluster, enabling timely, actionable data and proactive visibility into its operational pulse.
The real power of this metric is its ability to establish alerts that guarantee the continuous operation of your security platform directly within your Prometheus Alertmanager.
Metric example:
rox_central_health_cluster_info{Cluster="production",Status="HEALTHY",Type="OPENSHIFT4_CLUSTER",Upgradability="MANUAL_UPGRADE_REQUIRED"} 1Configure the following Prometheus rule to fire an alert the moment a cluster becomes unhealthy. Integrating these alerts into your existing notification pipelines means your team receives critical notifications through familiar channels, minimizing the mean time to recovery (MTTR) for your security platform.
apiVersion: monitoring.rhobs/v1
kind: PrometheusRule
metadata:
  name: stackrox-health-alerts
  namespace: stackrox
  labels:
    app: central
spec:
  groups:
    - name: secured-cluster-health
      interval: 30s
      rules:
        - alert: SecuredClusterStatusNotHealthy
          expr: rox_central_health_cluster_info{Status!="HEALTHY"}
          for: 90m
          labels:
            severity: warning
          annotations:
            summary: "{{ $labels.Cluster }} secured cluster status is {{ $labels.Status }}"
            description: "The rox_central_health_cluster_info metric for cluster {{ $labels.Cluster }} has Status={{ $labels.Status }}, expected HEALTHY."
Note: The metric is updated every hour, meaning the alert may remain in a firing state for up to an hour after the cluster status has been restored to HEALTHY.
Certificate expiry
The rox_central_cert_exp_hours metric delivers an early warning system for certificate lifecycle management by indicating the number of hours remaining before each component's certificate expires.
Here's an example:
rox_central_cert_exp_hours{Component="SCANNER_V4"} 8640
Learn more
Keep on learning how to simplify and accelerate your security visibility journey to a modern, scalable platform with Red Hat Advanced Cluster Security. For more information, check out Monitoring RHACS with Custom Prometheus product documentation and the article, Red Hat Advanced Cluster Security 4.9: Security built with your workflows in mind.
Last updated: February 9, 2026