Visibility is no longer a luxury in cloud-native development, it is a requirement. As you transition from monolithic architectures to distributed microservices on Red Hat OpenShift, the complexity of tracking requests across service boundaries increases exponentially. Implementing observability can often feel like assembling a puzzle with missing pieces. On Red Hat OpenShift, OpenTelemetry (OTel) is the gold standard for collecting traces, metrics, and logs. The OpenTelemetry (OTel) project has emerged as the industry standard for this challenge, providing a unified framework for collecting traces, metrics, and logs. However, the traditional manual instrumentation of every service is time-consuming and prone to error.
This guide explores how to use the Red Hat build of OpenTelemetry and its comprehensive auto-instrumentation capabilities to achieve full-stack observability without touching your application's source code. We will install the Red Hat build of OpenTelemetry using the operator, an efficient way to manage it on OpenShift. While this guide focuses on the magic of zero-code injection, the architectural principles and collector configurations detailed here serve as a universal blueprint for any OpenTelemetry use case on OpenShift, including manual SDK integration or custom telemetry pipelines.
Auto-instrumentation is a game changer
Traditional manual instrumentation requires developers to import libraries, initialize providers, and manually create spans for every function they wish to track. This is not feasible for a large-scale organization with hundreds of microservices. Auto-instrumentation provides the following benefits:
- Lifecycle management: Automates updates and collector configuration.
- Auto-instrumentation: Automatically injects OTel libraries into your Go, Java, Node.js, Python, .NET, and the Apache HTTP server (httpd) applications without manual code changes.
- Sidecar injection: Transparently adds collector sidecars to your pods.
- Standardization: Ensuring that every team across the organization uses the same semantic conventions and export protocols.
Step 1: Install the operator
The Red Hat build of OpenTelemetry Operator isn't just an installer; it's a management engine. The easiest way to get started is via the OpenShift web console. Follow these steps to install the operator:
- Log in to your OpenShift web console with administrator privileges.
- Navigate to Operators > OperatorHub.
- Search for the Red Hat build of OpenTelemetry.
- Select Install.
- On the installation page:
- Update channel: Select stable.
- Installation mode: Choose All namespaces on the cluster.
- Approval strategy: Automatic
- Select Install and wait for the status to show "Succeeded."
Tip: You also need the cert-manager operator installed since the OpenTelemetry operator uses it to manage admission webhooks.
Step 2: Create a collector instance
Once the operator is active, you must define an OpenTelemetryCollector Custom Resource (CR). This acts as the central hub for your telemetry data.
For a standard starting point, we recommend the deployment mode. This creates a centralized service to receive, process, and export data. Use the following configuration to set up a receiver that logs data for debug:
- Create a new project:
oc new-project otel-demo. - Go to Operators > Installed Operators > Red Hat build of OpenTelemetry.
- Select the OpenTelemetry collector tab and select Create OpenTelemetryCollector.
- Switch to the YAML view and use this basic deployment mode configuration:
apiVersion: opentelemetry.io/v1beta1
kind: OpenTelemetryCollector
metadata:
  name: otel
  namespace: otel-demo
spec:
  mode: deployment
  config:
    receivers:
      otlp:
        protocols:
          grpc: {}
          http: {}
    processors:
      batch: {}
    exporters:
      debug:
        verbosity: detailed
    service:
      pipelines:
        traces:
          receivers: [otlp]
          processors: [batch]
          exporters: [debug]
This configuration ensures your collector is ready to ingest data via the OpenTelemetry protocol (OTLP). Use oc logs to see your traces appearing in real time during the testing phase.
Step 3: Auto-instrumentation (the magic part)
One of the key features of the OpenShift implementation is the Instrumentation CR.
The Instrumentation CR is the brain behind auto-instrumentation. It tells the operator where to send the data and how to configure the agents it injects. Instead of configuring these settings in every application, you will define them once as follows:
apiVersion: opentelemetry.io/v1alpha1
kind: Instrumentation
metadata:
  name: my-instrumentation
  namespace: otel-demo
spec:
  exporter:
    env:
      - name: OTEL_SEMCONV_STABILITY_OPT_IN
        value: http
    endpoint: http://otel-collector:4317
  propagators:
    - tracecontext
    - baggage
  sampler:
    type: parentbased_traceidratio
    argument: "1"
  dotnet:
    env:
      - name: OTEL_EXPORTER_OTLP_ENDPOINT
        value: 'http://otel-collector:4318'
  java:
    resources:
      limits: {}
      requests: {}
  nodejs:
    env:
      - name: OTEL_EXPORTER_OTLP_ENDPOINT
        value: 'http://otel-collector:4318'
      - name: OTEL_METRICS_EXPORTER
        value: otlp
  python:
    env:
      # Python auto-instrumentation uses http/proto by default
      - name: OTEL_EXPORTER_OTLP_ENDPOINT
        value: http://otel-collector:4318
Note: We use the OTEL_SEMCONV_STABILITY_OPT_IN environment variable to ensure all instrumentations follow the latest HTTP stable semantic conventions. This prevents separated data where different languages name their attributes differently.
For version 2 of the Java auto-instrumentation library, use the following:
  java:
    env:
      - name: OTEL_EXPORTER_OTLP_ENDPOINT
        value: 'http://otel-collector:4318'
    image: 'ghcr.io/open-telemetry/opentelemetry-operator/autoinstrumentation-java:2.23.0'
Step 4: Multi-language deployment & auto-instrumentation
The true advantage of OTel on OpenShift is revealed when you deploy polyglot microservices. By simply adding a single annotation to your Deployment YAML, the operator injects the necessary agents at runtime.
Java applications
For Java, the operator injects a Java agent via an initContainer. This agent uses bytecode manipulation to instrument popular frameworks like Spring Boot, Quarkus, and Hibernate.
Annotation: instrumentation.opentelemetry.io/inject-java: "true"
You may patch an existing deployment like this:
oc patch deployment java-demo --type='json' -p='[{"op": "add", "path": "/spec/template/metadata/annotations", "value": {"instrumentation.opentelemetry.io/inject-java": "true"} }]'Python applications
Python instrumentation wraps your execution command (e.g., python app.py) to include OTel tracking for libraries like Flask, Django, and FastAPI.
Annotation: instrumentation.opentelemetry.io/inject-python: "true"
Node.js applications
For Node.js, the operator uses the --require flag to load the OTel SDK before your application code, capturing database calls (PostgreSQL, MongoDB), and HTTP requests automatically.
Annotation: instrumentation.opentelemetry.io/inject-nodejs: "true"
If you do not have a sample Java application, you may use the OpenShift Java sample. You can find more samples here.
Step 5: Verify the flow
To ensure everything is working:
- Check the Collector logs:
oc logs deployment/otel-collector -n otel-demo- If you see traces or metrics being printed in the logs, your pipeline is active.
Troubleshooting tips
If you just want to test your Collector is working now without a whole microservice architecture, use a simple curl loop against the collector's OTLP endpoint as follows:
# Send a test span manually via OTLP/HTTP
curl -X POST http://otel-collector:4318/v1/traces \
-H "Content-Type: application/json" \
-d '{"resourceSpans": [{"resource": {"attributes": [{"key": "service.name", "value": {"stringValue": "test-app"}}]}, "scopeSpans": [{"spans": [{"traceId": "4bf92f3577b34da6a3ce929d0e0e4736", "spanId": "00f067aa0ba902b7", "name": "test-span", "kind": 1, "startTimeUnixNano": "1625083652123456789", "endTimeUnixNano": "1625083652223456789"}]}]}]}'
Integrate OpenTelemetry with Tempo
While the debug exporter is helpful for setup, production environments require a reliable backend. Tempo is the Red Hat-supported, high-scale distributed tracing backend (the successor to Jaeger).
To bridge OTel to Tempo, update your collector CR to include an otlp/tempo exporter:
Before starting, ensure you have the following prerequisites:
- The Tempo operator installed.
- A TempoStack instance already running in your cluster.
- Object storage (like S3, MinIO, or Garage) configured for Tempo.
Identify your Tempo endpoint
TempoStack exposes an OTLP (gRPC) endpoint that the collector needs to target. Usually, the internal service URL follows this pattern: http://<tempostack-name>-distributor.<namespace>.svc:4317
Note: If you have enabled mTLS or OpenShift's internal authentication (RBAC), you may need to provide a service account token or certificates in the collector config.
Update the collector configuration
Follow these steps to modify your OpenTelemetryCollector YAML to replace the debug exporter with an otlp exporter pointing to Tempo.
- Navigate to Operators > Installed Operators > Red Hat build of OpenTelemetry.
- Select your otel-collector instance and select Edit OpenTelemetryCollector.
- Update the YAML to look like this:
apiVersion: opentelemetry.io/v1beta1
kind: OpenTelemetryCollector
metadata:
  name: otel
  namespace: otel-demo
spec:
  mode: deployment
  config:
      extensions:
        # create extension
        bearertokenauth:
          filename: "/var/run/secrets/kubernetes.io/serviceaccount/token"
    receivers:
      otlp:
        protocols:
          grpc: {}
          http: {}
    processors:
      batch:
        # Batching is business-critical for performance when sending to Tempo
        send_batch_size: 1000
        timeout: 10s
    exporters:
      otlp/tempo:
        # Replace with your actual TempoStack service name and namespace
        endpoint: "tempo-simplest-gateway.tempo-demo.svc:8090"
        tls:
          insecure: false
          ca_file: "/var/run/secrets/kubernetes.io/serviceaccount/service-ca.crt"
        auth:
          authenticator: bearertokenauth
        headers:
          X-Scope-OrgID: "dev"
    service:
      # enable extension
      extensions: [bearertokenauth]
      pipelines:
        traces:
          receivers: [otlp]
          processors: [batch]
          exporters: [otlp/tempo] # Now sending to Tempo
In this example configuration, the Tempo instance is called simplest running in the namespace tempo-demo.
Grant permissions (if using RBAC)
If your TempoStack is secured (which is the default in many OpenShift environments), your collector's ServiceAccount needs permission to write to Tempo.
You may create a ClusterRoleBinding to allow the otel-collector service account to act as a tempostack-traces-write:
oc adm policy add-cluster-role-to-user tempostack-traces-write -z otel-collectorVisualize in the OpenShift console
Once the data is flowing, you can view your traces directly within the OpenShift user interface (UI) as shown in Figure 1:
- In the Administrator perspective, go to Observe > Traces.
- Select your TempoStack as the data source.
- Search for your service name (e.g., your Java or Python application) to see the distributed spans.
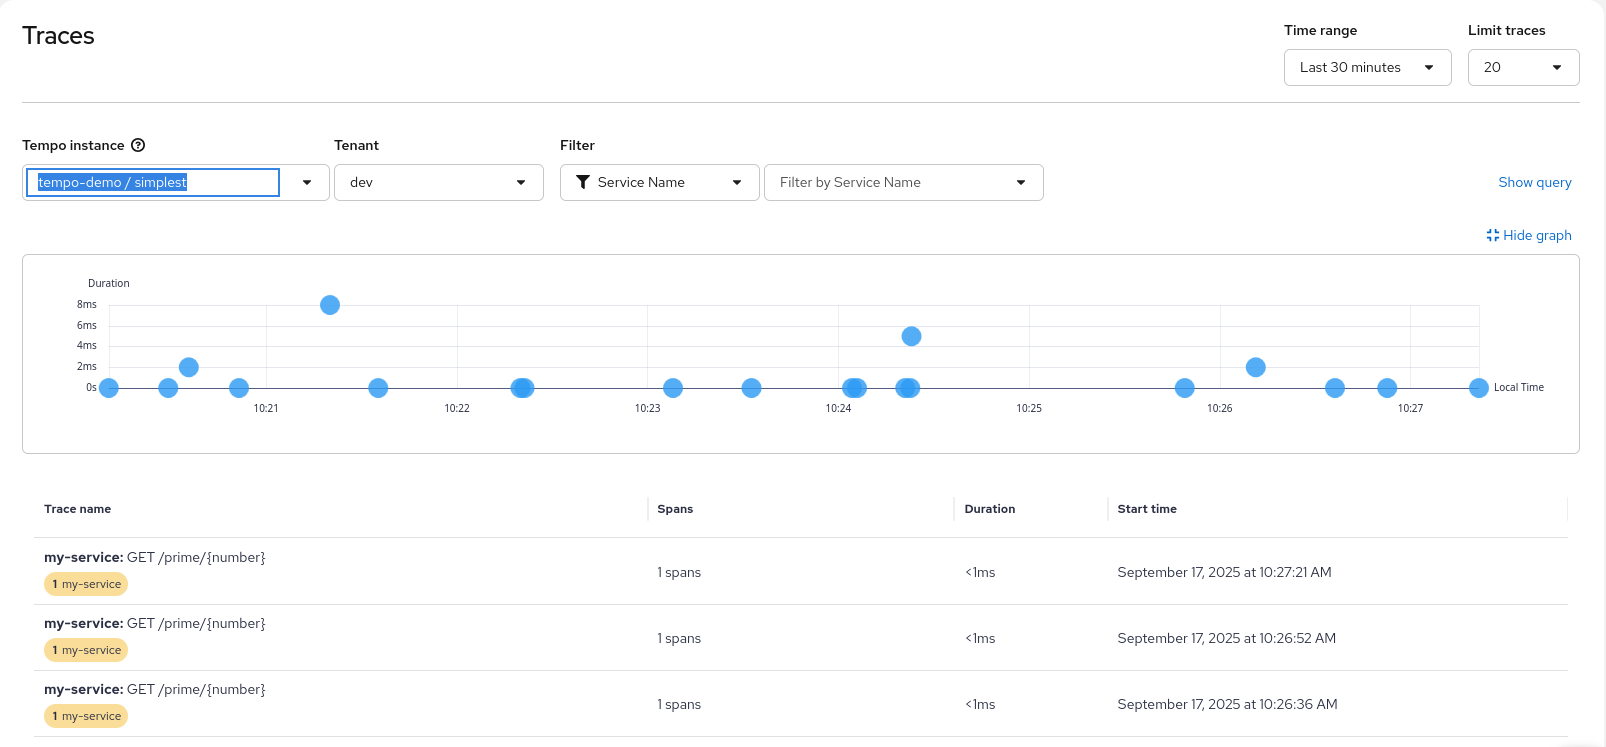
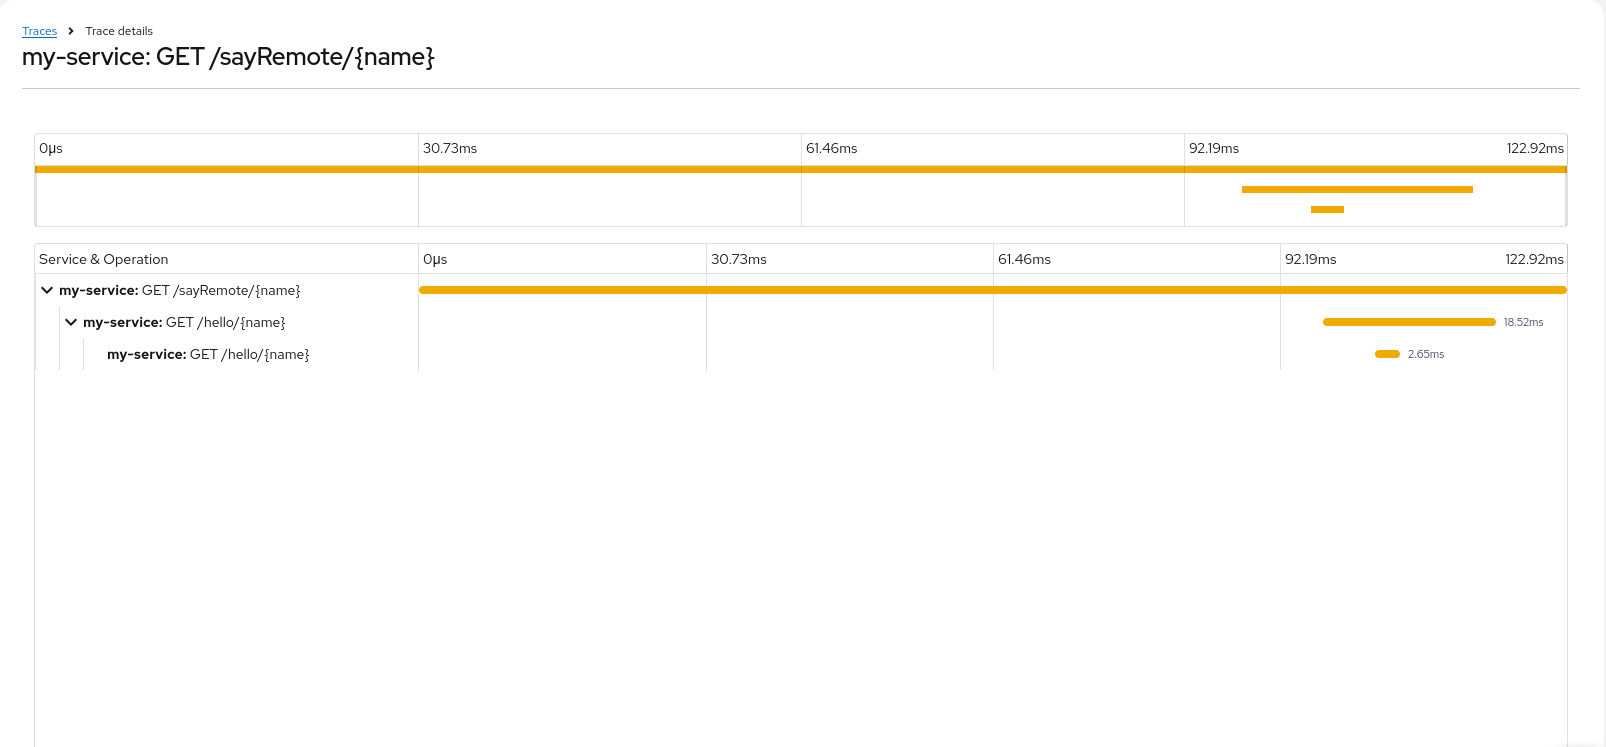
When you select a specific trace entry in the overview list you will get the detail view shown in Figure 2.
Integrate OpenTelemetry with User-Workload-Monitoring
Tracing tells you why a request was slow. Metrics tell you how many requests are failing. By integrating OTel with the OpenShift User-Workload Monitoring (UWM), you get a single pane of glass for both infrastructure and application health.
Enable user-workload monitoring
First, ensure your cluster is configured to monitor user-defined projects.
Check if the configuration exists:
oc get configmap cluster-monitoring-config -n openshift-monitoringIf it doesn't, or if enableUserWorkload is not true, create/edit the ConfigMap:
apiVersion: v1
kind: ConfigMap
metadata:
  name: cluster-monitoring-config
  namespace: openshift-monitoring
data:
  config.yaml: |
    enableUserWorkload: true
Configure the collector to expose metrics
You must configure the collector to act as a Prometheus target. This involves adding a prometheus exporter and enabling the operator to create a ServiceMonitor.
Update your OpenTelemetryCollector CR:
apiVersion: opentelemetry.io/v1beta1
kind: OpenTelemetryCollector
metadata:
  name: otel
  namespace: otel-demo
spec:
  observability:
    metrics:
      # This tells the Operator to automatically create a ServiceMonitor
      enableMetrics: true
  config:
    receivers:
      otlp:
        protocols:
          grpc: {}
          http: {}
    exporters:
      prometheus:
        endpoint: "0.0.0.0:8889"
        # Optional: Add resource attributes as Prometheus labels
        resource_to_telemetry_conversion:
          enabled: true
    service:
      pipelines:
        metrics:
          receivers: [otlp]
          exporters: [prometheus]
        traces:
          receivers: [otlp]
          processors: [batch]
          exporters: [otlp/tempo]
Verify the ServiceMonitor
The OpenTelemetry operator will automatically detect enableMetrics: true and create a ServiceMonitor in your namespace. This resource tells OpenShift's Prometheus instance exactly where to find your OTel metrics.
Verify it was created:
oc get servicemonitor -n otel-demoView metrics in the console
Once configured, your application metrics (sent via OTLP to the collector) are converted to Prometheus format and scraped by the platform.
Because you enabled User-Workload Monitoring, OpenShift already provides a place to query and view these metrics without installing extra tools. Follow these steps to view metrics in the OpenShift web console:
- Switch to the Developer perspective in the OpenShift web console.
- Go to Observe > Metrics.
- Use PromQL in the Observe > Metrics dashboard to calculate complex KPIs (Figure 3):
Requests per application: sum(rate(http_server_request_duration_seconds_count[5m])) by (service_name, http_route)
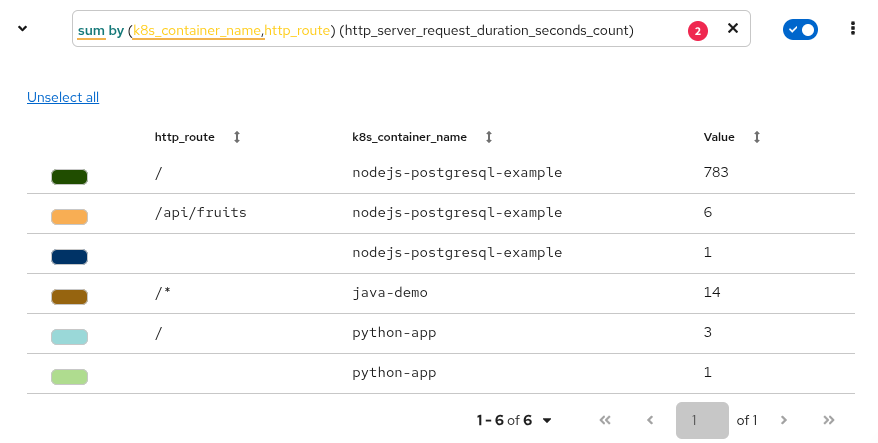
P90 latency: histogram_quantile(0.90, sum by (k8s_container_name,http_route,le) (rate(http_server_request_duration_seconds_bucket[5m])))
Throughput: sum(rate(http_server_request_duration_seconds_count[5m])) by (service_name)
OTel metric: otelcol_process_uptime_seconds_total
Note: It may take 1-2 minutes for the first data points to appear after the ServiceMonitor is created.
Modern dashboards with Perses
Perses has become the primary engine for dashboarding in OpenShift, slowly replacing the read-only Grafana instance. Perses is Kubernetes-native, meaning your dashboards are stored as YAML files (custom resources). This makes it perfect for GitOps workflow using ArgoCD.
Locate the Thanos querier endpoint
OpenShift’s User-Workload Monitoring stores metrics in Prometheus. But to query them with platform metrics, target the Thanos Querier.
Find the Thanos Querier route:
oc get route thanos-querier -n openshift-monitoring -o jsonpath='{.spec.host}'
Use this internal URL if Perses is running inside the cluster: https://thanos-querier.openshift-monitoring.svc:9091.
Configure the Perses datasource
Perses uses datasources to define where to pull data. For OpenShift UWM, you will define a Prometheus-compatible datasource pointing to Thanos.
If you are using the Perses operator, you may create a PersesDatasource CR:
apiVersion: perses.dev/v1alpha1
kind: PersesDatasource
metadata:
  name: prometheus-datasource
  namespace: otel-demo
spec:
  config:
    display:
      name: "Thanos Querier Datasource"
    default: true
    plugin:
      kind: "PrometheusDatasource"
      spec:
        proxy:
          kind: HTTPProxy
          spec:
            url: https://thanos-querier.openshift-monitoring.svc.cluster.local:9091
            secret: prometheus-datasource-secret
  client:
    tls:
      enable: true
      caCert:
        type: file
        certPath: /ca/service-ca.crt
Important: Because OpenShift RBAC secures the Thanos Querier, your Perses service account must have the cluster-monitoring-view role, and you must configure Perses to pass an authentication token (usually via a secret or a sidecar proxy).
Create a Perses dashboard
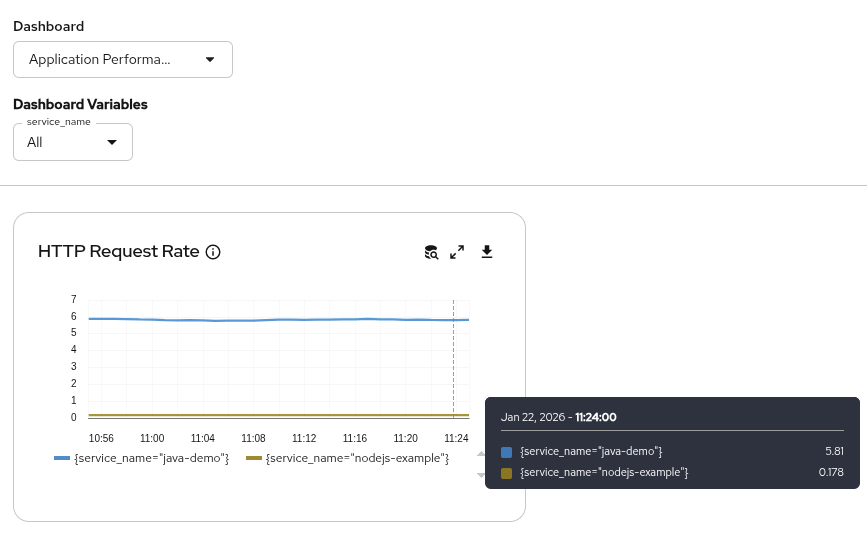
The following is a simplified example of a Perses dashboard CR that displays a "Request rate" graph using the metrics your OpenTelemetry collector sends.
apiVersion: perses.dev/v1alpha1
kind: PersesDashboard
metadata:
  name: app-performance-dashboard
  namespace: otel-demo
spec:
  display:
    name: Application Performance
  duration: 1h
  layouts:
    - kind: Grid
      spec:
        items:
          - content:
              $ref: '#/spec/panels/request_rate'
            height: 8
            width: 8
            x: 0
            'y': 0
  panels:
    request_rate:
      kind: Panel
      spec:
        display:
          description: Rate of incoming requests from OTel instrumentation
          name: HTTP Request Rate
        plugin:
          kind: TimeSeriesChart
          spec:
            legend:
              mode: list
              position: bottom
              values:
                - last
            yAxis:
              format:
                unit: decimal
        queries:
          - kind: TimeSeriesQuery
            spec:
              plugin:
                kind: PrometheusTimeSeriesQuery
                spec:
                  datasource:
                    kind: PrometheusDatasource
                    name: prometheus-datasource
                  query: |-
                    sum by (service_name) (
                      rate(http_server_request_duration_seconds_count{service_name=~"$service_name"}[5m])
                    )
  variables:
    - kind: ListVariable
      spec:
        allowAllValue: true
        allowMultiple: false
        name: service_name
        plugin:
          kind: PrometheusPromQLVariable
          spec:
            datasource:
              kind: PrometheusDatasource
              name: prometheus-datasource
            expr: 'group by (service_name) ({__name__=~''http_server_request_duration.*''})'
            labelName: service_name
Access the dashboard
If you have the cluster observability operator installed, Perses panels are often embedded directly into the Observe > Dashboards(Perses) menu.
If you run Perses as a standalone service, navigate to its Route URL, log in, and you will see your app-performance-dashboard listed under the project you created.
A non-cluster-admin user requires the following ClusterRole:
kind: ClusterRole
apiVersion: rbac.authorization.k8s.io/v1
metadata:
  name: perses-prometheus-api-editor
rules:
  - verbs:
      - get
      - list
      - watch
      - create
      - update
    apiGroups:
      - monitoring.coreos.com
    resources:
      - prometheuses/api
You can add this with the following ClusterRoleBinding (e.g., for user demo):
kind: ClusterRoleBinding
apiVersion: rbac.authorization.k8s.io/v1
metadata:
  name: demo-perses-prometheus-api-editor
subjects:
  - kind: User
    apiGroup: rbac.authorization.k8s.io
    name: demo
roleRef:
  apiGroup: rbac.authorization.k8s.io
  kind: ClusterRole
  name: perses-prometheus-api-editor
Figure 4 shows an example in the Perses dashboard.
What’s next
The transition from blind microservices to a fully observable stack on OpenShift is complete! By using the Red Hat build of OpenTelemetry, you move away from the black box of microservices and into a world of clear, useful data. Auto-instrumentation removes the barrier to entry, allowing developers to focus on code while the platform handles the observability.
To fully leverage the capabilities of the Red Hat build of OpenTelemetry and enhance your monitoring strategy, explore the official documentation, community resources, and visit the GitHub repository. Try Red Hat OpenShift if you don’t have it yet.