Large language model deployments are moving beyond simple single-turn prompts into richer, multi-turn conversational experiences, code assistants, document analysis workflows, long-context chatbots, and more. These workloads place new strains on inference servers, especially around prefix reuse, KV cache locality, and tail latency experienced by end users.
In this blog post, we walk through a hands-on demonstration comparing llm-d, Red Hat’s distributed LLM inference solution, with a traditional deployment of vLLM using naive load balancing. The goal is to show how llm-d’s prefix-aware intelligent routing delivers smoother performance, lower P95/P99 latency, and more efficient use of GPU resources.
Why this matters
vLLM has earned its reputation as one of the fastest LLM inference engines available. It’s easy to deploy, fast, and optimizes throughput through kernel fusion and prefix caching.
But users don’t just send isolated prompts, they engage in multi-turn conversations, where later requests depend on the KV cache built during the decode phase of earlier turns.
In multi-replica deployments, something subtle but important happens: Round-robin routing scatters requests across replicas, destroying KV cache locality and causing severe tail latency spikes.
llm-d addresses this problem directly with KV-cache-aware routing, ensuring follow-up turns land on replicas that already contain the relevant context.
Let’s walk through the benchmark.
The multi-turn benchmarking tool
Throughout this exercise, we’ll use a benchmarking tool designed for conversational workloads. The tool uses real-world documents as seeds and automatically classifies them as CODE or TEXT. To mimic real usage, it simulates multi-turn conversation flows by running parallel workers with random delays and reusing model responses as input. This approach generates realistic KV cache access patterns that expose the limitations of naive routing.
This structure is exactly what exposes the limitations of naive routing, and the advantages of llm-d.
We'll keep a Grafana dashboard open throughout the process to monitor TTFT, KV cache hit rate, GPU utilization, and throughput.
Prerequisites
- An OpenShift 4.20 cluster with GPU-enabled worker nodes
- OpenShift AI 3.0 installed and configured
- NVIDIA GPU Operator installed and functional
- At least four NVIDIA L4 or A10 GPUs (or similar) for multi-replica testing
Note
The benchmarking figures produced for this article were generated on a single node OpenShift cluster with 4 x NVIDIA L4 GPUs. While these results are typical for this specific configuration, they are intended for demonstration purposes and do not represent production-grade infrastructure or enterprise-level averages. Performance outcomes depend on specific variables, such as input types and replica counts.
Step 0: Deploy monitoring stack
Enter the following:
git clone https://github.com/rh-aiservices-bu/rhaoi3-llm-dDeploy the monitoring stack, Prometheus and Grafana:
oc apply -k monitoring
# Wait for Grafana to be ready
oc wait --for=condition=ready pod -l app=grafana -n llm-d-monitoring --timeout=300s
# Get Grafana URL
export GRAFANA_URL=$(oc get route grafana-secure -n llm-d-monitoring -o jsonpath='{.spec.host}')
echo "Grafana URL: https://$GRAFANA_URL"
Step 1: Establish the baseline: vLLM performance with GuideLLM
Before we compare routing strategies, it’s important to note that vLLM is an outstanding inference engine. It is fast, efficient, simple to configure, and delivers excellent throughput.
Deploy vLLM (4 replicas):
oc apply -k vllm
oc wait --for=condition=ready pod \
  -l serving.kserve.io/inferenceservice=qwen-vllm \
  -n demo-llm --timeout=300s
Run the GuideLLM micro-benchmark:
oc apply -k guidellm/overlays/vllm
oc logs -f job/vllm-guidellm-benchmark -n demo-llm
In Grafana, monitor for stable TTFT, high throughput, and efficient tensor-parallel use across multiple GPUs.
Key takeaways
- vLLM excels at inference.
- Prefix caching works extremely well, within a single replica.
- Configuration is simple and predictable.
But now we ask the critical question: How does vLLM behave when scaled horizontally, when real-world multi-turn conversations route requests randomly across replicas?
To answer this question, we will use a different benchmarking tool that replicates multi-turn chat conversations.
Step 2: Identifying naive load balancing scaling limitations in multi-turn chat
With multiple replicas behind a naive round-robin strategy, each user conversation will land on different pods. This breaks cache locality and causes frequent KV cache misses.
Run the multi-turn benchmark:
oc apply -k benchmark-job/overlays/vllm
oc logs -f job/vllm-multi-turn-benchmark -n demo-llm
Once the benchmarking tool is complete, you will get a summary of results similar to:
================================================================================
BENCHMARK SUMMARY
================================================================================

Total time: 210.48s
Total requests: 110
Completed conversations: 11/11
Requests per second: 0.52

Time to First Token (TTFT):
  Min:         44.47 ms
  Max:        881.38 ms
  Mean:       208.96 ms
  P50:        119.00 ms
  P95:        727.26 ms
  P99:        814.92 ms

Total Request Time:
  Min:       2347.15 ms
  Max:      10874.38 ms
  Mean:      6323.26 ms
  P50:       6138.65 ms
  P95:       9769.03 ms

TTFT by Turn Number:
  Turn  1:     332.52 ms avg (11 requests)
  Turn  2:     305.08 ms avg (11 requests)
  Turn  3:     270.26 ms avg (11 requests)
  Turn  4:     203.46 ms avg (11 requests)
  Turn  5:     276.70 ms avg (11 requests)
  Turn  6:      95.63 ms avg (11 requests)
  Turn  7:     138.93 ms avg (11 requests)
  Turn  8:     152.36 ms avg (11 requests)
  Turn  9:     180.47 ms avg (11 requests)
  Turn 10:     134.21 ms avg (11 requests)

TTFT by Document Type:
  CODE:       241.15 ms avg (50 requests)
  TEXT:       182.14 ms avg (60 requests)

First Turn vs Subsequent Turns (Prefix Caching Indicator):
  First turn avg:      332.52 ms
  Later turns avg:     195.23 ms
  Speedup ratio:         1.70x
Expected vLLM results (from our tests):
| Metric | Value | Meaning |
| P50 TTFT | 123 ms | Good median performance |
| P95 TTFT | 727 ms | High tail latency, frustrated users |
| P99 TTFT | 814 ms | Spikes caused by KV cache misses |
| Prefix cache speedup | 1.70× | Inefficient cache re-use |
What these results tell us:
- Tail latency increases dramatically. P95 TTFT is approximately 727 ms and P99 TTFT is approximately 814 ms.
- Median latency remains acceptable (P50 is approximately 123 ms), but the variance makes the system feel unpredictable.
- Prefix caching provides only a modest benefit across replicas, with a cache speedup of just 1.70×. This indicates poor reuse of previously processed prompts.
Grafana observations (see Figure 1):
- KV cache hit rate is approximately 62% (2/3 of requests).
- TTFT shows jagged spikes, correlating with KV cache misses.
- GPUs show imbalanced utilization across replicas.
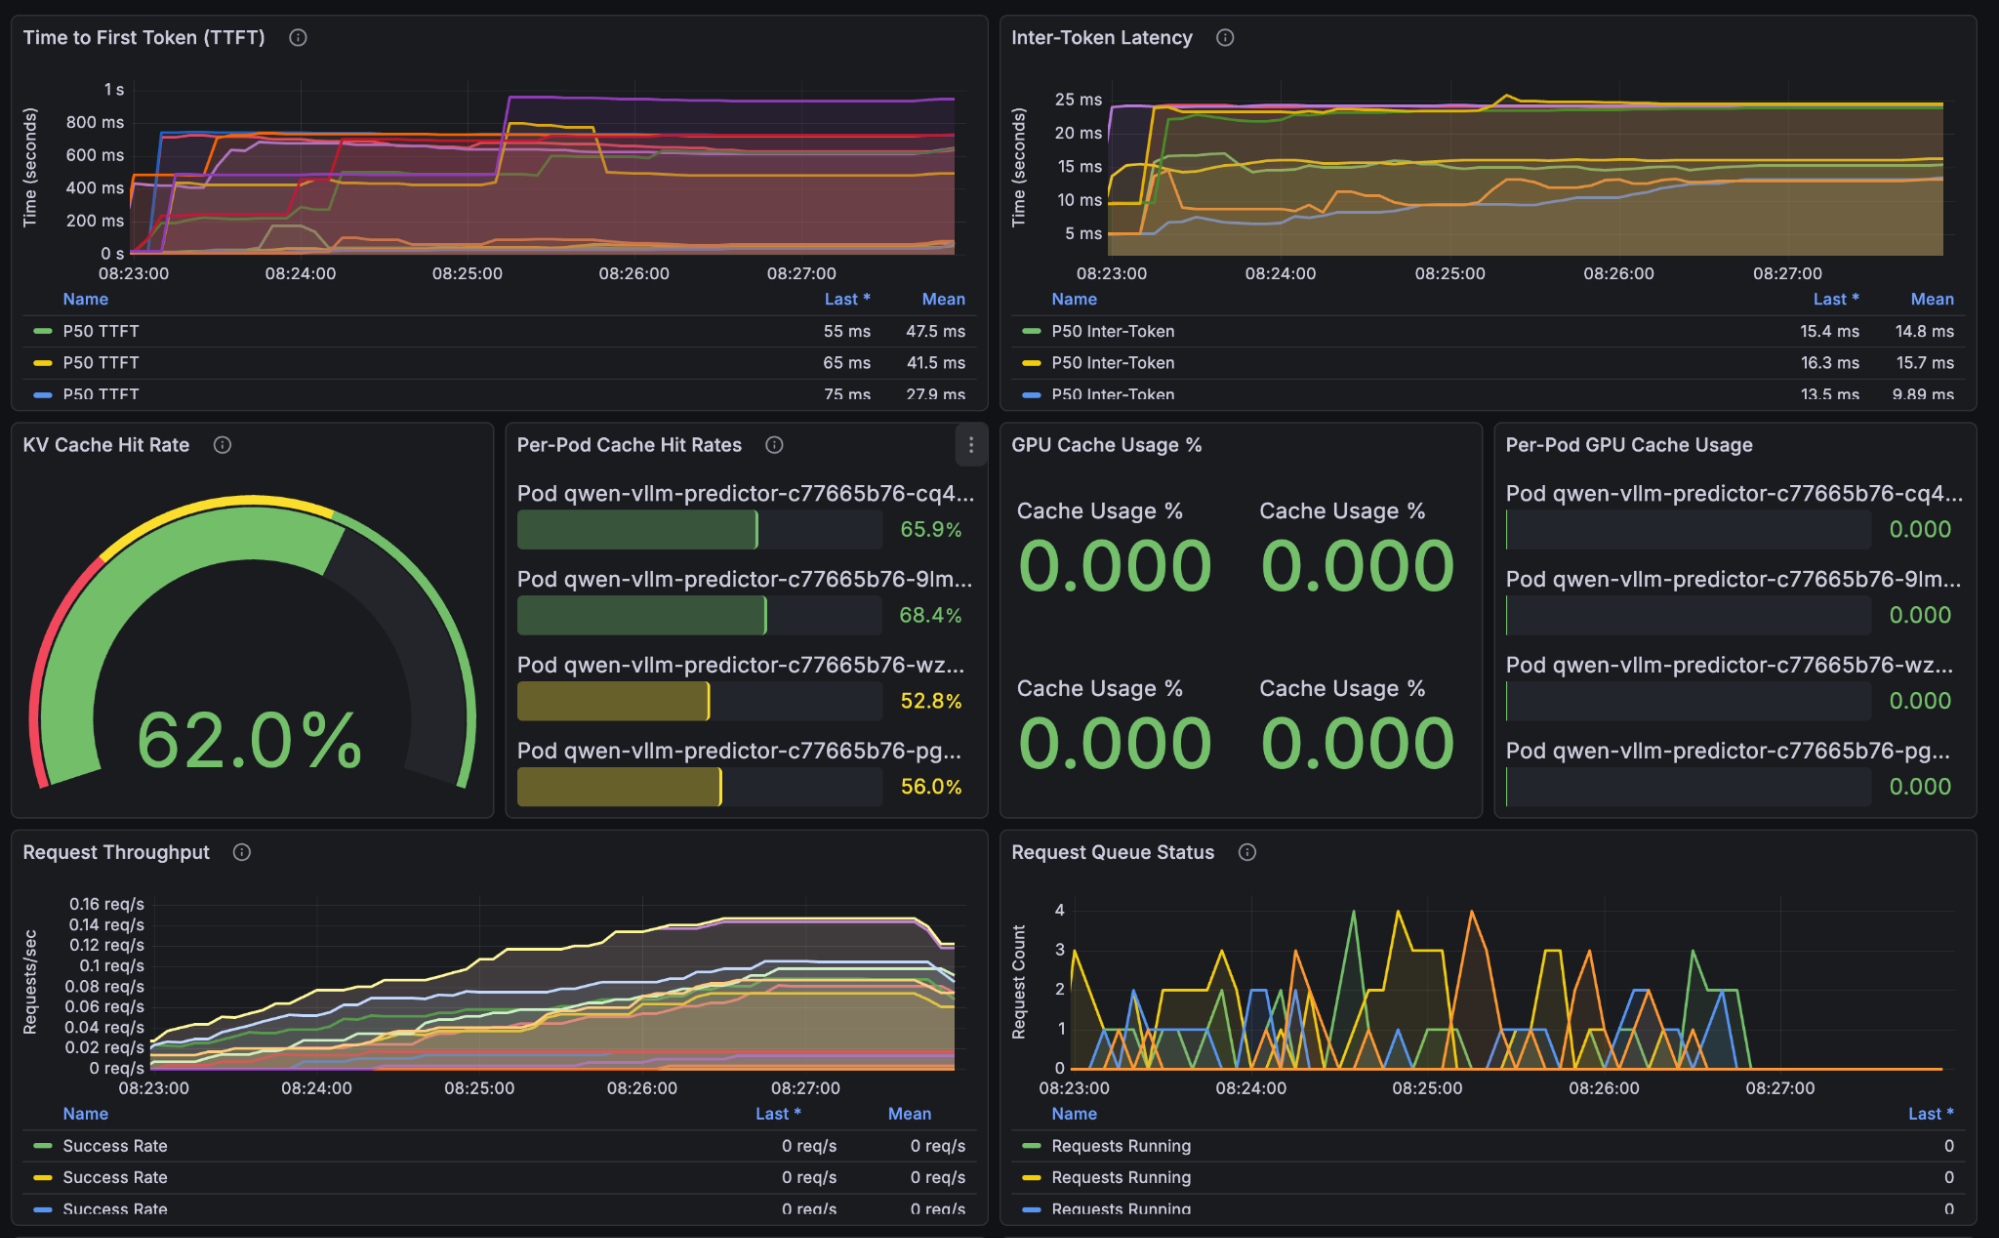
This is not a vLLM flaw; it’s an architecture problem in multi-replica deployments without routing intelligence.
Clean up vLLM:
oc delete job vllm-guidellm-benchmark vllm-multi-turn-benchmark -n demo-llm
oc delete -k vllm
Reset monitoring:
oc delete pod -l app=prometheus -n llm-d-monitoring
oc wait --for=condition=ready pod -l app=prometheus -n llm-d-monitoring --timeout=120s
Step 3: Deploy llm-d and enable intelligent routing
Now we redeploy using llm-d, which introduces prefix-aware scheduling: every request is routed to the replica most likely to contain relevant KV cache entries.
This improves cache locality, reduces recompute, and stabilizes tail latency.
Deploy llm-d
oc apply -k llm-d
oc wait --for=condition=ready pod \
  -l app.kubernetes.io/name=qwen \
  -n demo-llm --timeout=300s
Run the same benchmark:
oc apply -k benchmark-job/overlays/llm-d
oc logs -f job/llm-d-multi-turn-benchmark -n demo-llm
Once the benchmarking tool is complete, you will get a summary of results similar to:
================================================================================
BENCHMARK SUMMARY
================================================================================

Total time: 224.37s
Total requests: 110
Completed conversations: 11/11
Requests per second: 0.49

Time to First Token (TTFT):
  Min:         51.86 ms
  Max:        767.41 ms
  Mean:       112.54 ms
  P50:         89.17 ms
  P95:        237.96 ms
  P99:        700.76 ms

Total Request Time:
  Min:       2873.23 ms
  Max:       9567.29 ms
  Mean:      6768.38 ms
  P50:       6727.68 ms
  P95:       9126.74 ms

TTFT by Turn Number:
  Turn  1:     343.35 ms avg (11 requests)
  Turn  2:      80.83 ms avg (11 requests)
  Turn  3:      77.98 ms avg (11 requests)
  Turn  4:      86.33 ms avg (11 requests)
  Turn  5:      77.61 ms avg (11 requests)
  Turn  6:      83.59 ms avg (11 requests)
  Turn  7:      86.99 ms avg (11 requests)
  Turn  8:      93.45 ms avg (11 requests)
  Turn  9:      91.43 ms avg (11 requests)
  Turn 10:     103.83 ms avg (11 requests)

TTFT by Document Type:
  CODE:       116.38 ms avg (50 requests)
  TEXT:       109.34 ms avg (60 requests)

First Turn vs Subsequent Turns (Prefix Caching Indicator):
  First turn avg:      343.35 ms
  Later turns avg:      86.89 ms
  Speedup ratio:         3.95x
Expected llm-d results:
| Metric | Value | Interpretation |
| P50 TTFT | 92 ms | 25% faster than vLLM |
| P95 TTFT | 237 ms | 63% faster, huge tail latency win |
| P99 TTFT | 700 ms | Much more stable high-percentile behavior |
| Cache speedup | 3.95× | Extremely efficient cache reuse |
What these results tell us:
- P50 TTFT of 92 ms (25% faster than vLLM) shows that llm-d improves everyday responsiveness for most users.
- P95 TTFT of 237 ms (63% faster) is the most important result: This means the slowest reasonable responses—the ones users actually notice—are more than 2× faster.
- P99 TTFT of approximately 700 ms shows llm-d keeps even extreme edge cases stable, preventing rare unpredictable stalls.
Grafana observations (see Figure 2):
- KV cache hit rate jumps to approximately 90% (45% improvement over vLLM).
- TTFT curve is smooth with no latency spikes.
- GPU utilization across replicas is balanced and predictable.
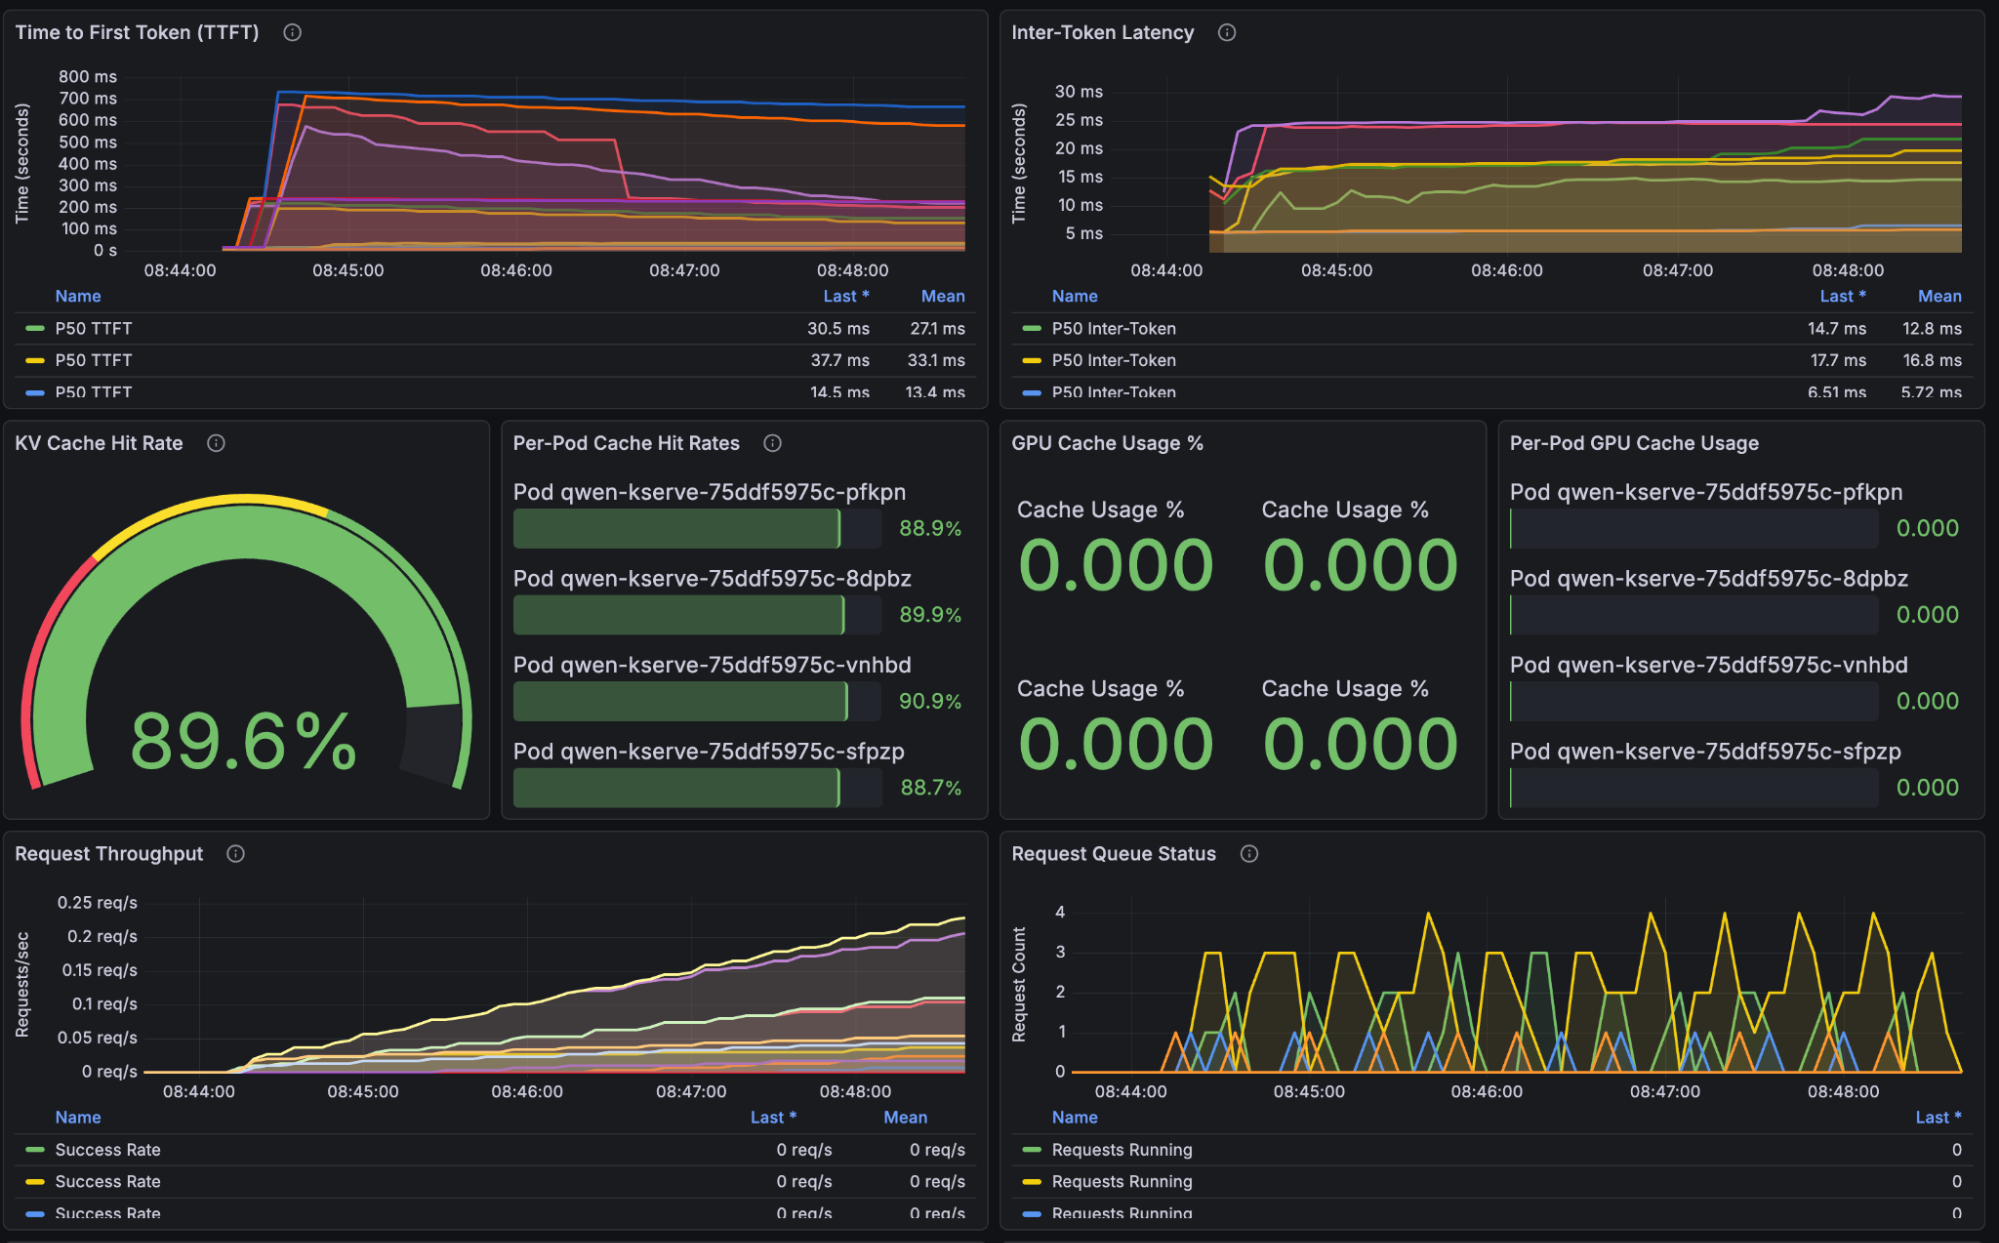
This demonstrates the core advantage of llm-d: routing is based on cached prefixes, not randomness.
The following table provides a results comparison.
| Metric | vLLM | llm-d | Improvement |
| P50 TTFT | 123 ms | 92 ms | 25% faster |
| P95 TTFT | 745 ms | 272 ms | 63% faster |
| P99 TTFT | 841 ms | 674 ms | 20% faster |
| Cache speedup | 1.79× | 3.84× | 2.1× better |
Figure 3 illustrates the tail latency improvements.
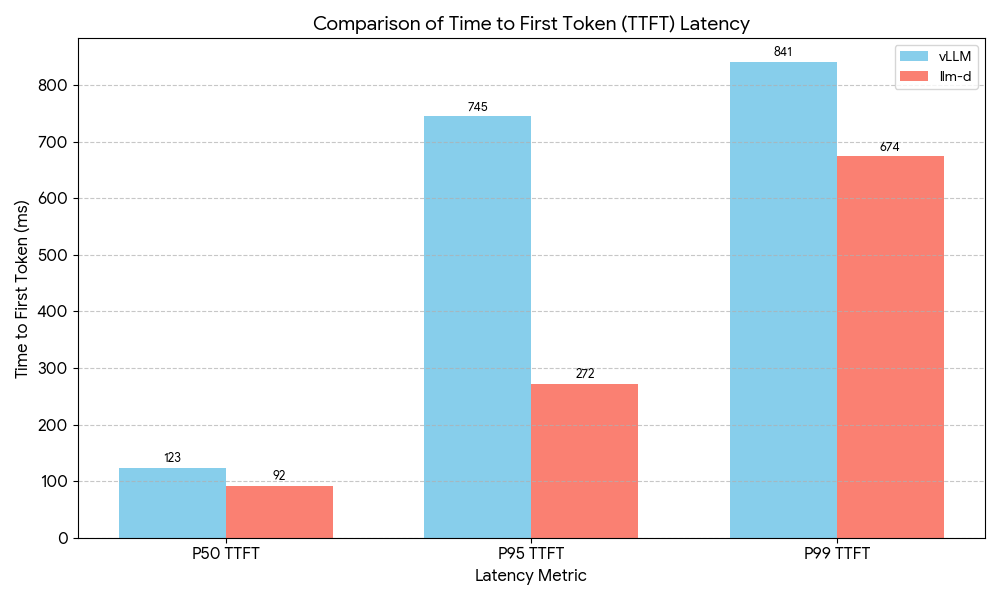
For users, these results lead to fewer slow responses and more consistent performance during interactive sessions. You get better throughput for every dollar spent on GPUs, and the system stays responsive throughout multi-turn conversations. This is not marginal optimization, it is the difference between a smooth product experience and a frustrating one.
Why llm-d performs better
The following comparison highlights the architectural factors that help llm-d deliver more consistent performance.
| Feature | vLLM (round robin) | llm-d (intelligent routing) |
| Routing | Random | Prefix-aware scoring |
| Cache hits | ~25% per replica | ~90%+ |
| P95 latency | High variance | Consistent, predictable |
| GPU utilization | Imbalanced | Balanced via cache locality |
| Multi-turn performance | Cache frequently missed | Cache reused efficiently |
The summary is simple: llm-d ensures the right request lands on the right GPU at the right time.
Key takeaways
- Tail latency matters. P95/P99 represents your most frustrated users.
- Cache locality is critical. Single-instance caching means little when routing is random.
- Prefix-aware routing is required for large-context, multi-turn assistants.
- No changes to your application. llm-d uses the same API, same model, and same OpenShift AI foundations.
Conclusion
vLLM remains an exceptional inference engine, and this benchmark validates that. But as soon as you scale horizontally and run multi-turn workloads, naive routing becomes the bottleneck.
llm-d addresses these challenges through intelligent, KV-cache-aware routing. This approach increases cache hit rates, lowers tail latency, and ensures smoother performance under load. By using GPU resources more efficiently, the system provides a better experience for every user.
If you're deploying multi-turn LLM workloads, code assistants, enterprise chatbots, document analysis applications, llm-d provides the performance foundation required for production at scale. Learn more on how to scale inference with llm-d.
