Red Hat Quay access logs help you gain visibility into the images pulled or pushed in Red Hat Quay. You can also see the time of deletion or creation of an organization or repository. These are provided by default within the Red Hat Quay UI at both an organization and repository level and are available globally within the super user admin panel. However, these logs are only stored for 30 days. If users want to gain long term visibility, they can forward these logs to Splunk.
This article demonstrates how to forward Red Hat Quay access logs to Splunk using a Splunk HEC token. Additionally, you’ll learn how we use Splunk queries to build out a dashboard to track all the activity happening within Red Hat Quay. We’ll configure the forwarding using the Red Hat Quay operator within Red Hat OpenShift.
Configuring the log forwarding
This section outlines how to configure the forwarding of the Red Hat Quay access logs to Splunk. Note that when forwarding the access logs, you will no longer be able to view them in the Red Hat Quay UI.
To enable forwarding, you must have the following prerequisites:
- OpenShift cluster with the Red Hat Quay operator installed.
- An available Splunk instance with an HTTP Event Collector (HEC) token and index for forwarding.
Prior to configuring this, you need to know which index you'll be forwarding to in Splunk as well as the splunk_host and splunk_sourcetype fields you’d like to utilize. In my example, I will specify splunk_host as quay-sno and splunk_sourcetype and quay_logs. However, if you have multiple Red Hat Quay environments, we recommend utilizing environment-specific values for each of these to decipher the actions performed in each environment.
To configure the forwarding of the access logs to Splunk, we’ll need to modify the config.yaml for Red Hat Quay. Generally, this is stored in the config-bundle-secret secret. You can verify the exact secret for this configuration by viewing the spec.configBundleSecret value of your QuayRegistry custom resource.
Export the config.yaml from the Quay config-bundle-secret secret.
oc get secret config-bundle-secret -n quay-enterprise -o jsonpath='{.data.config\.yaml}' | base64 --decode > config.yamlModify the config.yaml to forward the usage logs to Splunk and replace the following necessary values.
LOGS_MODEL: splunk
LOGS_MODEL_CONFIG:
  producer: splunk_hec
  splunk_hec_config:
    host: prd-p-aaaaaq.splunkcloud.com
    port: 8088
    hec_token: 12345678-1234-1234-1234-1234567890ab
    url_scheme: https
    verify_ssl: False
    index: quay
    splunk_host: quay-sno
    splunk_sourcetype: quay_logs
Apply the updated config.yaml to the config-bundle-secret secret.
oc set data secret/config-bundle-secret -n quay-enterprise --from-file=config.yamlYou can find the official documentation in the Red Hat Quay docs.
Verify log forwarding
When the config-bundle-secret secret has been updated, Red Hat Quay will rollout new app pods. First, you should verify that new pods started correctly. You can also view the usage logs of any organization or repository within Quay. Since this configuration disables usage logs within Quay, you should see the message, “Method not implemented, Splunk does not support log lookups” on any access log page inside of Quay.
As a simple test, you can also create a dummy repository or organization and simply search for the splunk_host index and splunk_sourcetype within Splunk to verify you are receiving the access logs.
Gaining insight through Splunk
The following queries define the index and source_type. You should adjust these based on the configuration you used on the config.yaml to forward to your Splunk instance.
Organization creation and deletion
This query will show creation and deletion of any Red Hat Quay organization as well as the performer of this operation (Figure 1).
index="quay" sourcetype="quay_logs" (kind="org_create" OR kind="org_delete")
| eval Action = if(kind=="org_create", "Created", "Deleted")
| rename metadata_json.namespace AS "Organization Name", performer AS "Performer"
| table _time, Action, "Organization Name", "Performer"
| sort -_time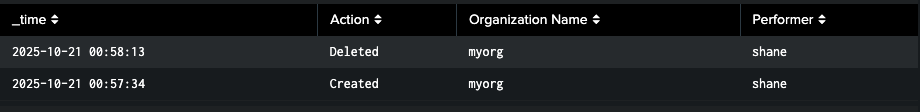
Repository creation and deletion
This query will show the creation and deletion of any Red Hat Quay repository as well as the performer of this operation (Figure 2).
index="quay" sourcetype="quay_logs" (kind="create_repo" OR kind="delete_repo")
| eval Action = if(kind=="create_repo", "Created", "Deleted")
| rename account AS "Organization", metadata_json.repo AS "Repository Name", performer AS "Performer"
| table _time, Action, "Organization", "Repository Name", "Performer"
| sort -_time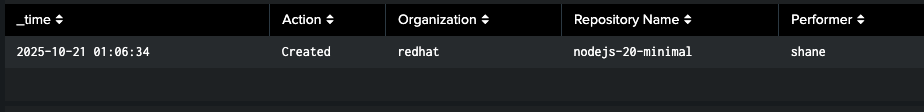
Image pulls
This query creates a report that shows the last time each unique image tag from your Quay repository and who pulled it (Figure 3).
index="quay" sourcetype="quay_logs" kind="pull_repo"
| stats max(_time) as last_event_epoch, latest(performer) as performer by metadata_json.namespace, metadata_json.repo, metadata_json.tag
| eval "Last Activity" = strftime(last_event_epoch, "%Y-%m-%d %H:%M:%S")
| fields - last_event_epoch
| rename metadata_json.namespace AS namespace, metadata_json.repo AS repository, metadata_json.tag AS tag
| sort -"Last Activity"
The next query will show us the number of image pulls per day (Figure 4).
index="quay" sourcetype="quay_logs" kind="pull_repo"
| timechart span=1d count AS "Number of Pulls"
Image pushes
This query creates a report that shows the last time each unique image tag pushed to your Quay repository and who pushed it.
index="quay" sourcetype="quay_logs" kind="push_repo"
| stats max(_time) as last_event_epoch, latest(performer) as performer by metadata_json.namespace, metadata_json.repo, metadata_json.tag
| eval "Last Activity" = strftime(last_event_epoch, "%Y-%m-%d %H:%M:%S")
| fields - last_event_epoch
| rename metadata_json.namespace AS namespace, metadata_json.repo AS repository, metadata_json.tag AS tag
| sort -"Last Activity"
The next query will show us the number of image pushes per day (Figure 6).
index="quay" sourcetype="quay_logs" kind="push_repo"
| timechart span=1d count AS "Number of Pushes"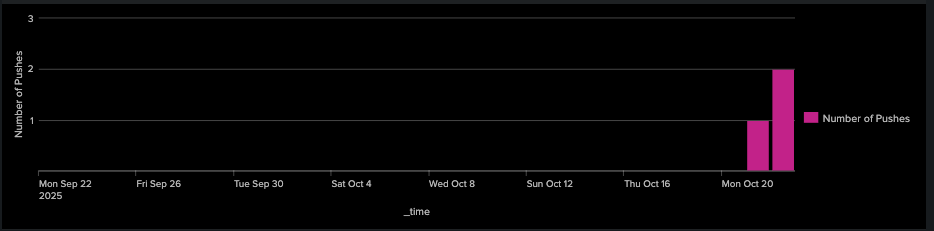
Combining pushes and pulls
This query creates a report that shows the last time each unique image tag was either pushed or pulled to your Quay repository and who performed the action (Figure 7).
index="quay" sourcetype="quay_logs" (kind="push_repo" OR kind="pull_repo")
| stats
    count(eval(kind="push_repo")) as "Total Pushes",
    max(eval(if(kind="push_repo", _time, null()))) as last_push_epoch,
    values(eval(if(kind="push_repo", performer, null()))) as "Push Performers",
    count(eval(if(kind="pull_repo", _time, null()))) as "Total Pulls",
    max(eval(if(kind="pull_repo", _time, null()))) as last_pull_epoch,
    values(eval(if(kind="pull_repo", performer, null()))) as "Pull Performers"
  by metadata_json.namespace, metadata_json.repo
| eval "Last Push" = strftime(last_push_epoch, "%Y-%m-%d %H:%M:%S")
| eval "Last Pull" = strftime(last_pull_epoch, "%Y-%m-%d %H:%M:%S")
| rename metadata_json.namespace AS namespace, metadata_json.repo AS repository
| table namespace, repository, "Total Pushes", "Push Performers", "Last Push", "Total Pulls", "Pull Performers", "Last Pull"
| sort -namespace, -"Total Pushes"
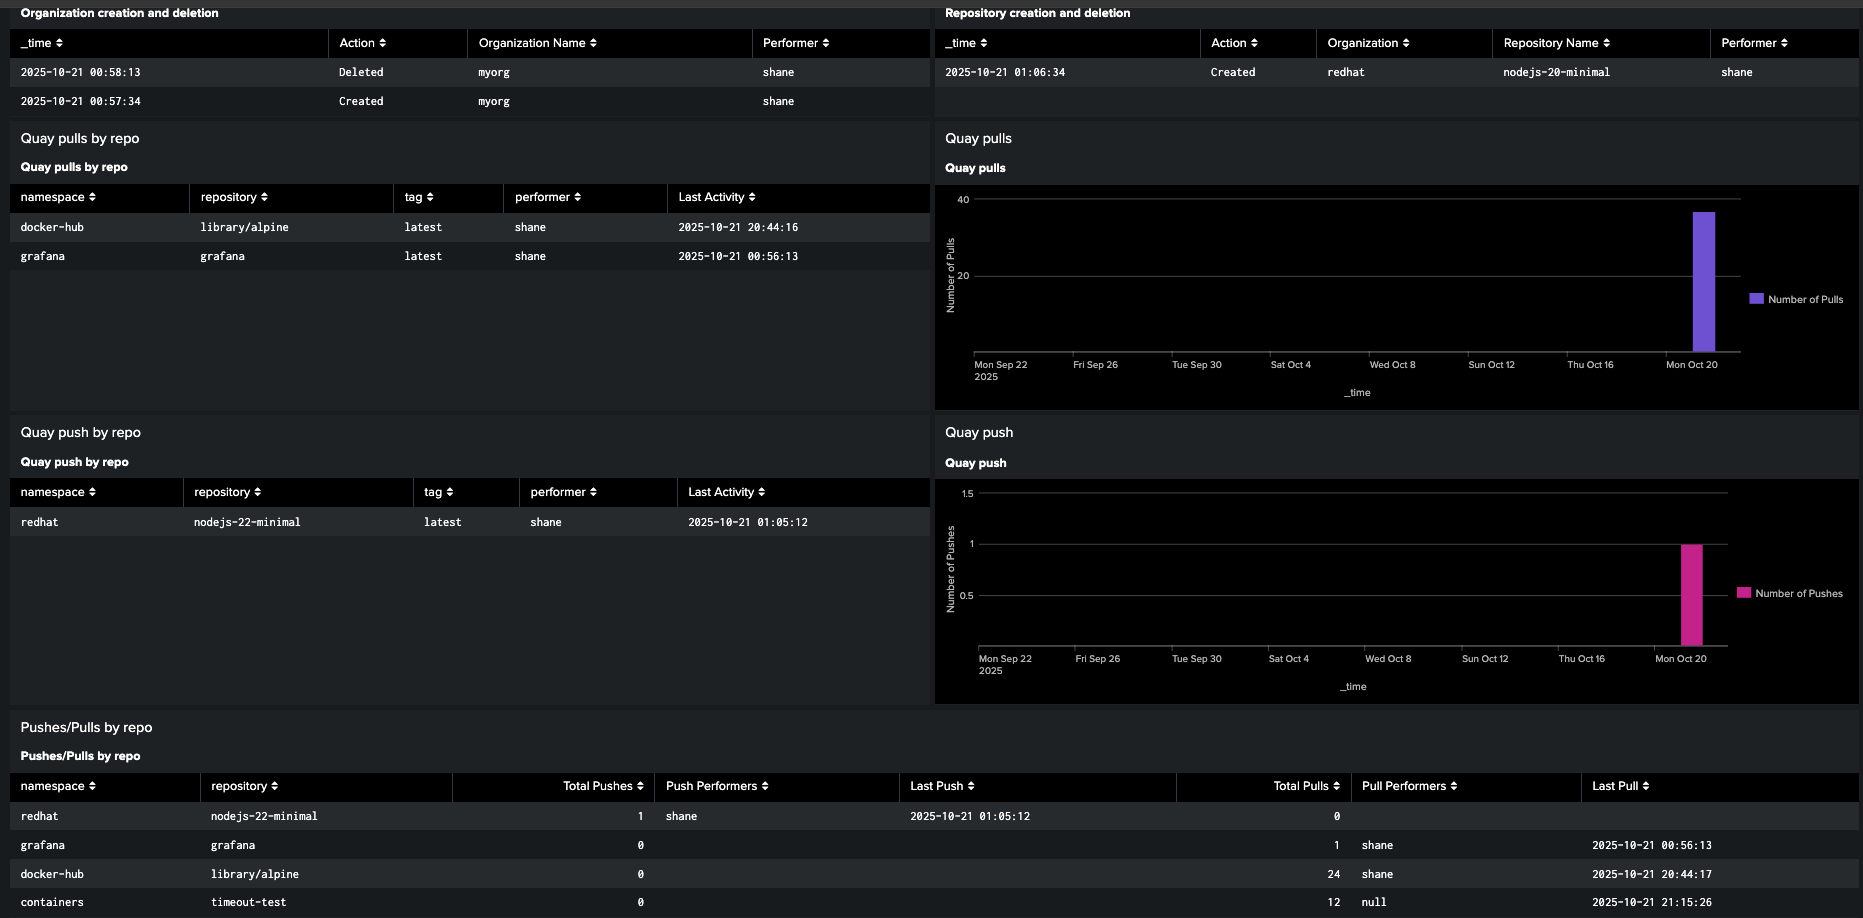
Tying it all together
These individual Splunk queries are the essential building blocks to gain visibility into your Red Hat Quay registry. However, to effectively monitor your registry, you should combine these into a single, comprehensive dashboard. This gives you a powerful way to track all the critical activity in your Red Hat Quay registry. Most importantly, it allows you to historically track your registry without the 30-day log limit in the Quay UI, giving you the long-term visibility you need for effective security and auditing to understand how your registry is truly being used.
You can find a sample of the classic Splunk dashboard in Figure 8 on GitHub. However, you will need to modify this to use your index and sourcetypes.
Wrap up
This article provided a step-by-step guide on how to forward Red Hat Quay container registry access logs to Splunk to achieve long-term visibility. By configuring the Red Hat Quay operator in OpenShift with a Splunk HEC token and modifying the config.yaml, users can ensure continuous data flow for auditing and security.
We also demonstrated various Splunk queries to track critical activity such as repository and organization creation/deletion and image pulls and pushes, ultimately recommending the consolidation of these queries into a single dashboard for comprehensive, historical monitoring of the Red Hat Quay registry.
