If you’ve been following the rise of the Model Context Protocol (MCP), you might have seen the recent buzz around managing Kubernetes clusters using AI assistants like Claude Desktop or Cursor. While the core abilities of the Kubernetes MCP Server (managing pods, deployments, and logs) are impressive, there is a hidden feature introduced in version 0.0.55: service mesh integration. The project recently added support for Kiali, the management console for Istio. This means now you can let your AI agent inspect your traffic flow, troubleshoot microservices, and analyze mesh metrics, all through natural language.
Why bring Kiali into the MCP server
While the MCP Server already exposes rich Kubernetes and OpenShift APIs, service mesh users often need a layer above raw workloads and pods. Kiali provides this service-mesh-aware context, including:
- Traffic topology and routing details
- Istio configuration validation
- Mesh, namespace, and workload health
- Request volume, error rates, response times (RED metrics)
- Distributed tracing information
- Versioned Canary and A/B rollout visibility
By integrating Kiali as a toolset, AI assistants can now surface these insights using simple prompts such as:
- “Show me the traffic graph for the payments namespace.”
- “Which workloads have the highest 5xx error rate in the mesh?”
- “Why is the checkout service showing degraded health?”
- “List any Istio validation errors affecting the bookinfo application.”
Installation
Now we will install the server and enable the Kiali toolset (turned off by default), using Red Hat OpenShift 4.19 and VS Code or directly within Red Hat OpenShift Lightspeed.
Prerequisites:
- OpenShift 4.19 cluster: You should be logged in via CLI (
oc login). - Installed service mesh: Kiali must be running on your cluster (e.g., Red Hat OpenShift Service Mesh).
- VS Code: With an MCP-compatible extension (like the native MCP support or Claude/Cursor integration).
Step 1: Get your Kiali URL
The MCP server needs to know where your Kiali console lives. Retrieve the route from your OpenShift cluster, assuming Kiali is in the istio-system namespace.
oc get route kiali -n istio-system -o jsonpath='{"https://"}{.spec.host}{"\n"}'Copy this URL because you will need it for the configuration file.
Step 2: Secure your access
While you can use your personal kubeconfig, best practices suggest using a dedicated, least-privilege ServiceAccount for AI agents.
As detailed in our previous post on the Kubernetes MCP server, you should avoid running MCP servers with cluster-admin privileges.
Follow these quick steps to generate a secure kubeconfig for the agent:
Create a dedicated namespace and ServiceAccount:
oc create sa mcp-viewer -n istio-systemFor this example, we grant read-only access to the cluster. We will need to grant more permissions if we want to edit objects in Istio.
oc adm policy add-cluster-role-to-user cluster-reader system:serviceaccount:istio-system:mcp-viewerUse this helper command to generate a standalone kubeconfig file that uses the ServiceAccount's token:
# Create a short-lived token (adjust duration as needed)
TOKEN=$(oc create token mcp-viewer -n istio-system --duration=8h)
SERVER=$(oc whoami --show-server)
# Compile the kubeconfig
oc login --server=$SERVER --token=$TOKEN --kubeconfig=mcp-viewer.kubeconfig
You now have a file named mcp-viewer.kubeconfig in your current directory. We will use this to authenticate the MCP server.
Step 3: Create the MCP configuration file
Unlike the standard setup where you just run the binary, enabling Kiali requires a TOML configuration file. This is where we explicitly tell the server to load the Kiali toolset (Figure 1).
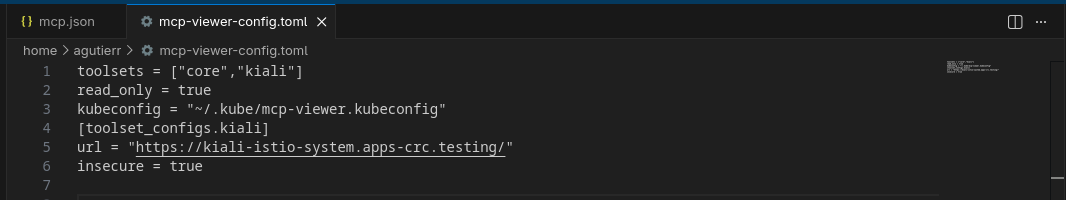
Create a file named mcp-viewer-config.toml in a known location (e.g., ~/mcp-viewer-config.toml):
# kiali-mcp-config.toml
# Enable both the core Kubernetes tools and the Kiali toolset
toolsets = ["core", "kiali"]
# Remove read_only if you want to perform Istio actions like create/remove
# You will need to update the kubeconfig to grant the necessary permissions
read_only = true
kubeconfig = "~/.kube/mcp-viewer.kubeconfig"
[toolset_configs.kiali]
# Replace with the URL you copied in Step 1
url = "https://kiali-istio-system.apps.cluster.example.com"
# For internal OpenShift clusters with self-signed certs, set this to true.
# For production, point 'certificate_authority' to your CA bundle.
insecure = true
Step 4: Configure VS Code (local client)
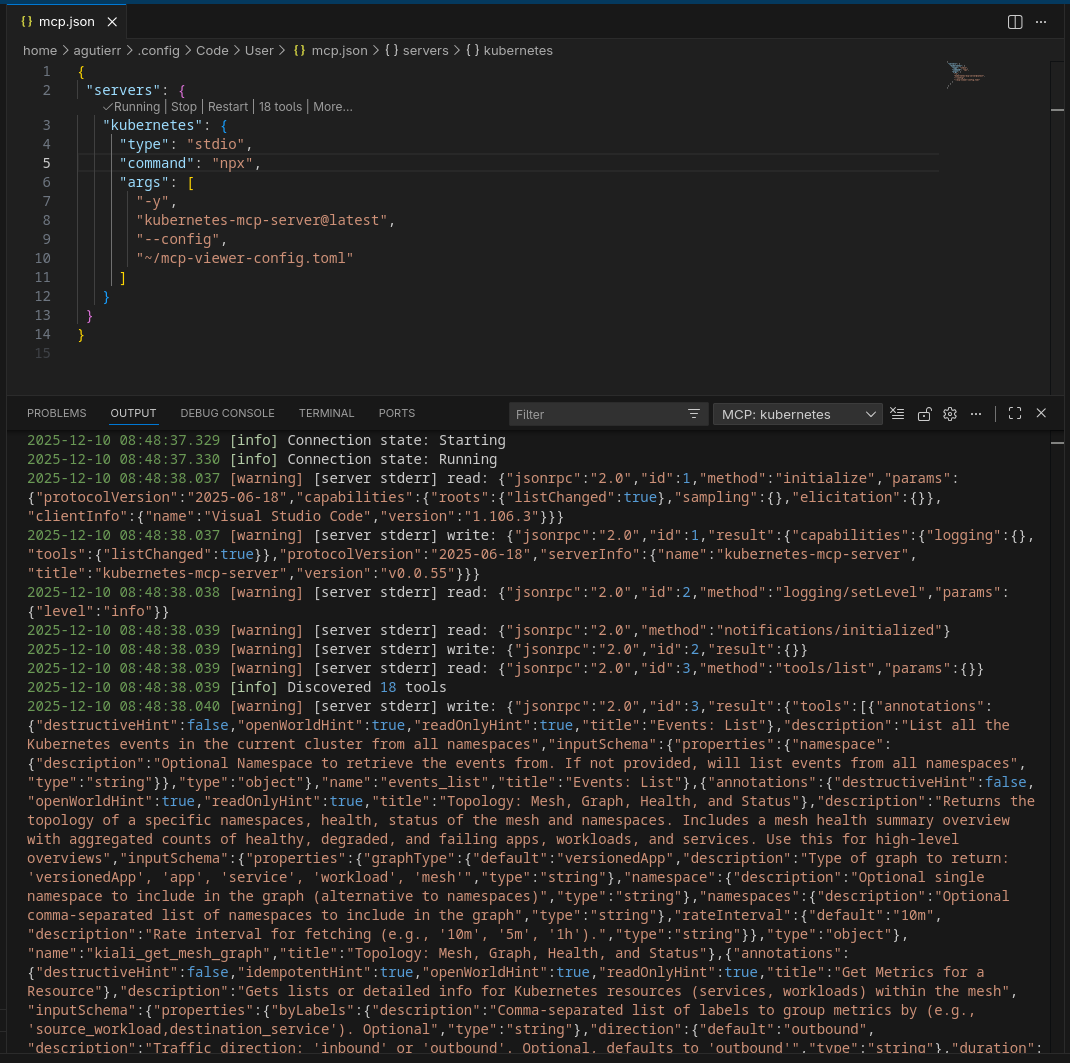
Now we need to tell VS Code to run the MCP server with this specific configuration as follows.
- Open VS Code.
- Open your MCP settings (often found in
.vscode/mcp-servers.jsonor accessible via the Command Palette: MCP: Configure Servers). Add the
kubernetes-mcp-serverentry. Note that we are passing the--configflag pointing to the file we created in step 3.{ "servers": { "kubernetes": { "type": "stdio", "command": "npx", "args": [ "-y", "kubernetes-mcp-server@latest", "--config", "~/mcp-viewer-config.toml" ] } } }- Save it. If it doesn’t auto-start, open the Command Palette and go to MCP: Show Installed Servers → Kubernetes. Click the gear symbol and select Restart (Figure 2).
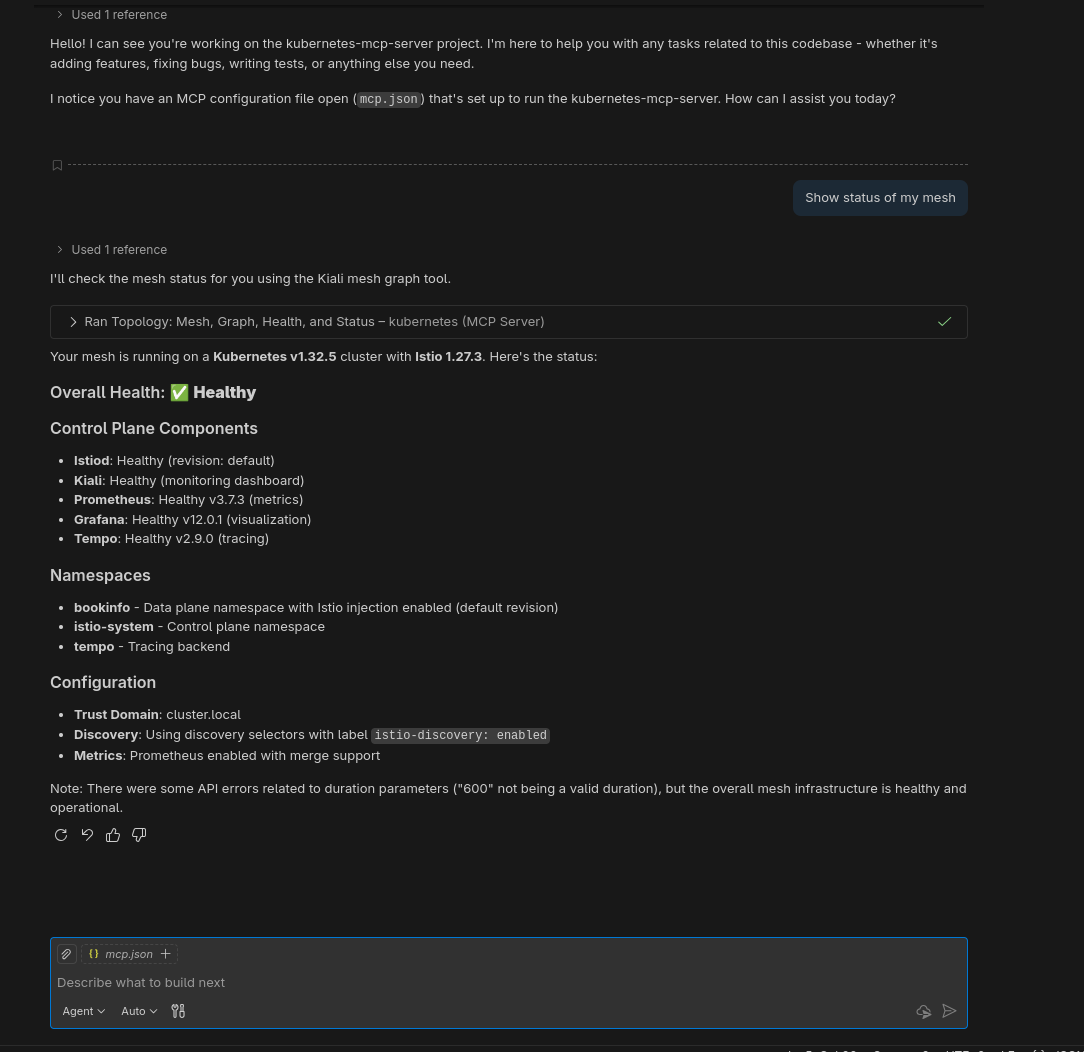
Step 5: Action
Open Chat using Agent mode and enter the prompt: "Show status of my mesh."
You will see something similar to the output in Figure 3.
Additional prompts
These prompts leverage Kiali's ability to generate dynamic service graphs.
Traffic topology and visualization:
- "Generate a traffic graph for the bookinfo namespace."
- "Show me how the product page service connects to other workloads."
- "Visualize the service mesh topology for the payments namespace including traffic rates."
- "Draw the interaction map between the frontend and backend services."
- "Show me the graph for istio-system to see the control plane components."
The following prompts focus on the health signals (red/green status, degraded workloads).
Health and status:
- "What is the overall health of the travel-agency mesh?"
- "Why is the reviews-v2 workload showing as degraded?"
- "List all unhealthy services in the default namespace."
- "Check the health status of the istio-ingressgateway."
- "Are there any workloads with missing sidecars in the legacy namespace?"
The next prompts use Kiali’s access to Prometheus metrics, or RED metrics (rate, errors, duration).
Metrics and troubleshooting:
- "Which services in the mesh have a non-zero error rate right now?"
- "Show me the request volume for the ratings service over the last hour."
- "What is the average response time (latency) for the checkout service?"
- "Identify any bottlenecks in the shop namespace based on response times."
- "Show me the inbound and outbound traffic metrics for the details pod."
Kiali excels at spotting misconfigured YAMLs (e.g., mismatched DestinationRules).
Istio configuration validation prompts:
- "Are there any Istio validation errors in the bookinfo namespace?"
- "Check if my VirtualServices and DestinationRules are correctly linked."
- "Validate the Istio configuration for the reviews service."
- "Do I have any unused or orphaned Istio resources?"
For tracing, use these prompts if Jaeger/Tempo is connected:
- "Find traces with errors for the productpage workload."
- "Show me the slowest trace for the login transaction."
- "List recent traces for the payment-processing service."
Try this drill-down workflow
The drill-down workflow begins with a high-level view in Kiali, starting with a traffic graph for a namespace, then identifying a specific problem like a degraded service and checking its error rates and response times. This is followed by using Kiali to check for Istio configuration warnings on the specific workload, and finally switching to the Core Kubernetes tool to inspect the root cause by fetching raw logs for a restarting deployment.
- Start with the big picture (Kiali): "Show me the traffic graph for the bookinfo namespace." (The AI retrieves the topology and identifies services).
- Identify the problem (Kiali): "I see reviews-v2 is degraded. What are the specific error rates and response times for it?" (The AI knows which service you are talking about from the previous step).
- Check the configuration (Kiali): "Are there any Istio validation warnings for that specific workload?" (Checks for DestinationRule or VirtualService mismatches).
- Inspect the root cause (core Kubernetes/Kiali): "Okay, now fetch the logs for the workload in that deployment that is restarting." (The AI switches from the Kiali tool to the core Kubernetes tool to pull raw logs for pods).
Experience the Kiali toolset
The real magic of the Model Context Protocol isn't just executing single commands, it is context retention. Because the AI agent holds the context of the conversation, you can chain the Kiali toolset (high-level observability) with the core Kubernetes toolset (i.e., low-level logs and manifests) to perform full SRE workflows without constantly repeating pod names or namespaces.
By combining these two toolsets, you can transform your AI assistant from a simple query engine into a level 1 troubleshooting agent that can navigate from a high-level architecture diagram down to a specific line of code in a log file.