Welcome to another installment of what's new in network observability. With the release of Red Hat OpenShift Container Platform 4.20, we have network observability 1.10. This release is backwards-compatible with all the supported versions of OpenShift, including an upstream version for Kubernetes. This article covers only the new features of 1.10. You can read about the older releases in my previous What's new in network observability articles. For a comprehensive coverage of all features, see the official Red Hat Network Observability documentation.
Network observability is an optional operator that provides insights into your network traffic, by collecting and aggregating network flow data using eBPF technology. The data is enriched with Kubernetes context, such as pods, services, namespaces, and nodes, and presented to the user in the form of graphs, tables, and a topology view. It not only provides deep visibility but can troubleshoot problems related to packet drops, latencies, DNS errors, and more.
The FlowCollector setup
Start with the Red Hat OpenShift web console running and the command line oc on your computer.
After installing the network observability operator, create a FlowCollector custom resource or instance. This allows you to configure the many parameters of network observability. In this release, there is a new 4-step wizard that simplifies resource creation (Figure 1).
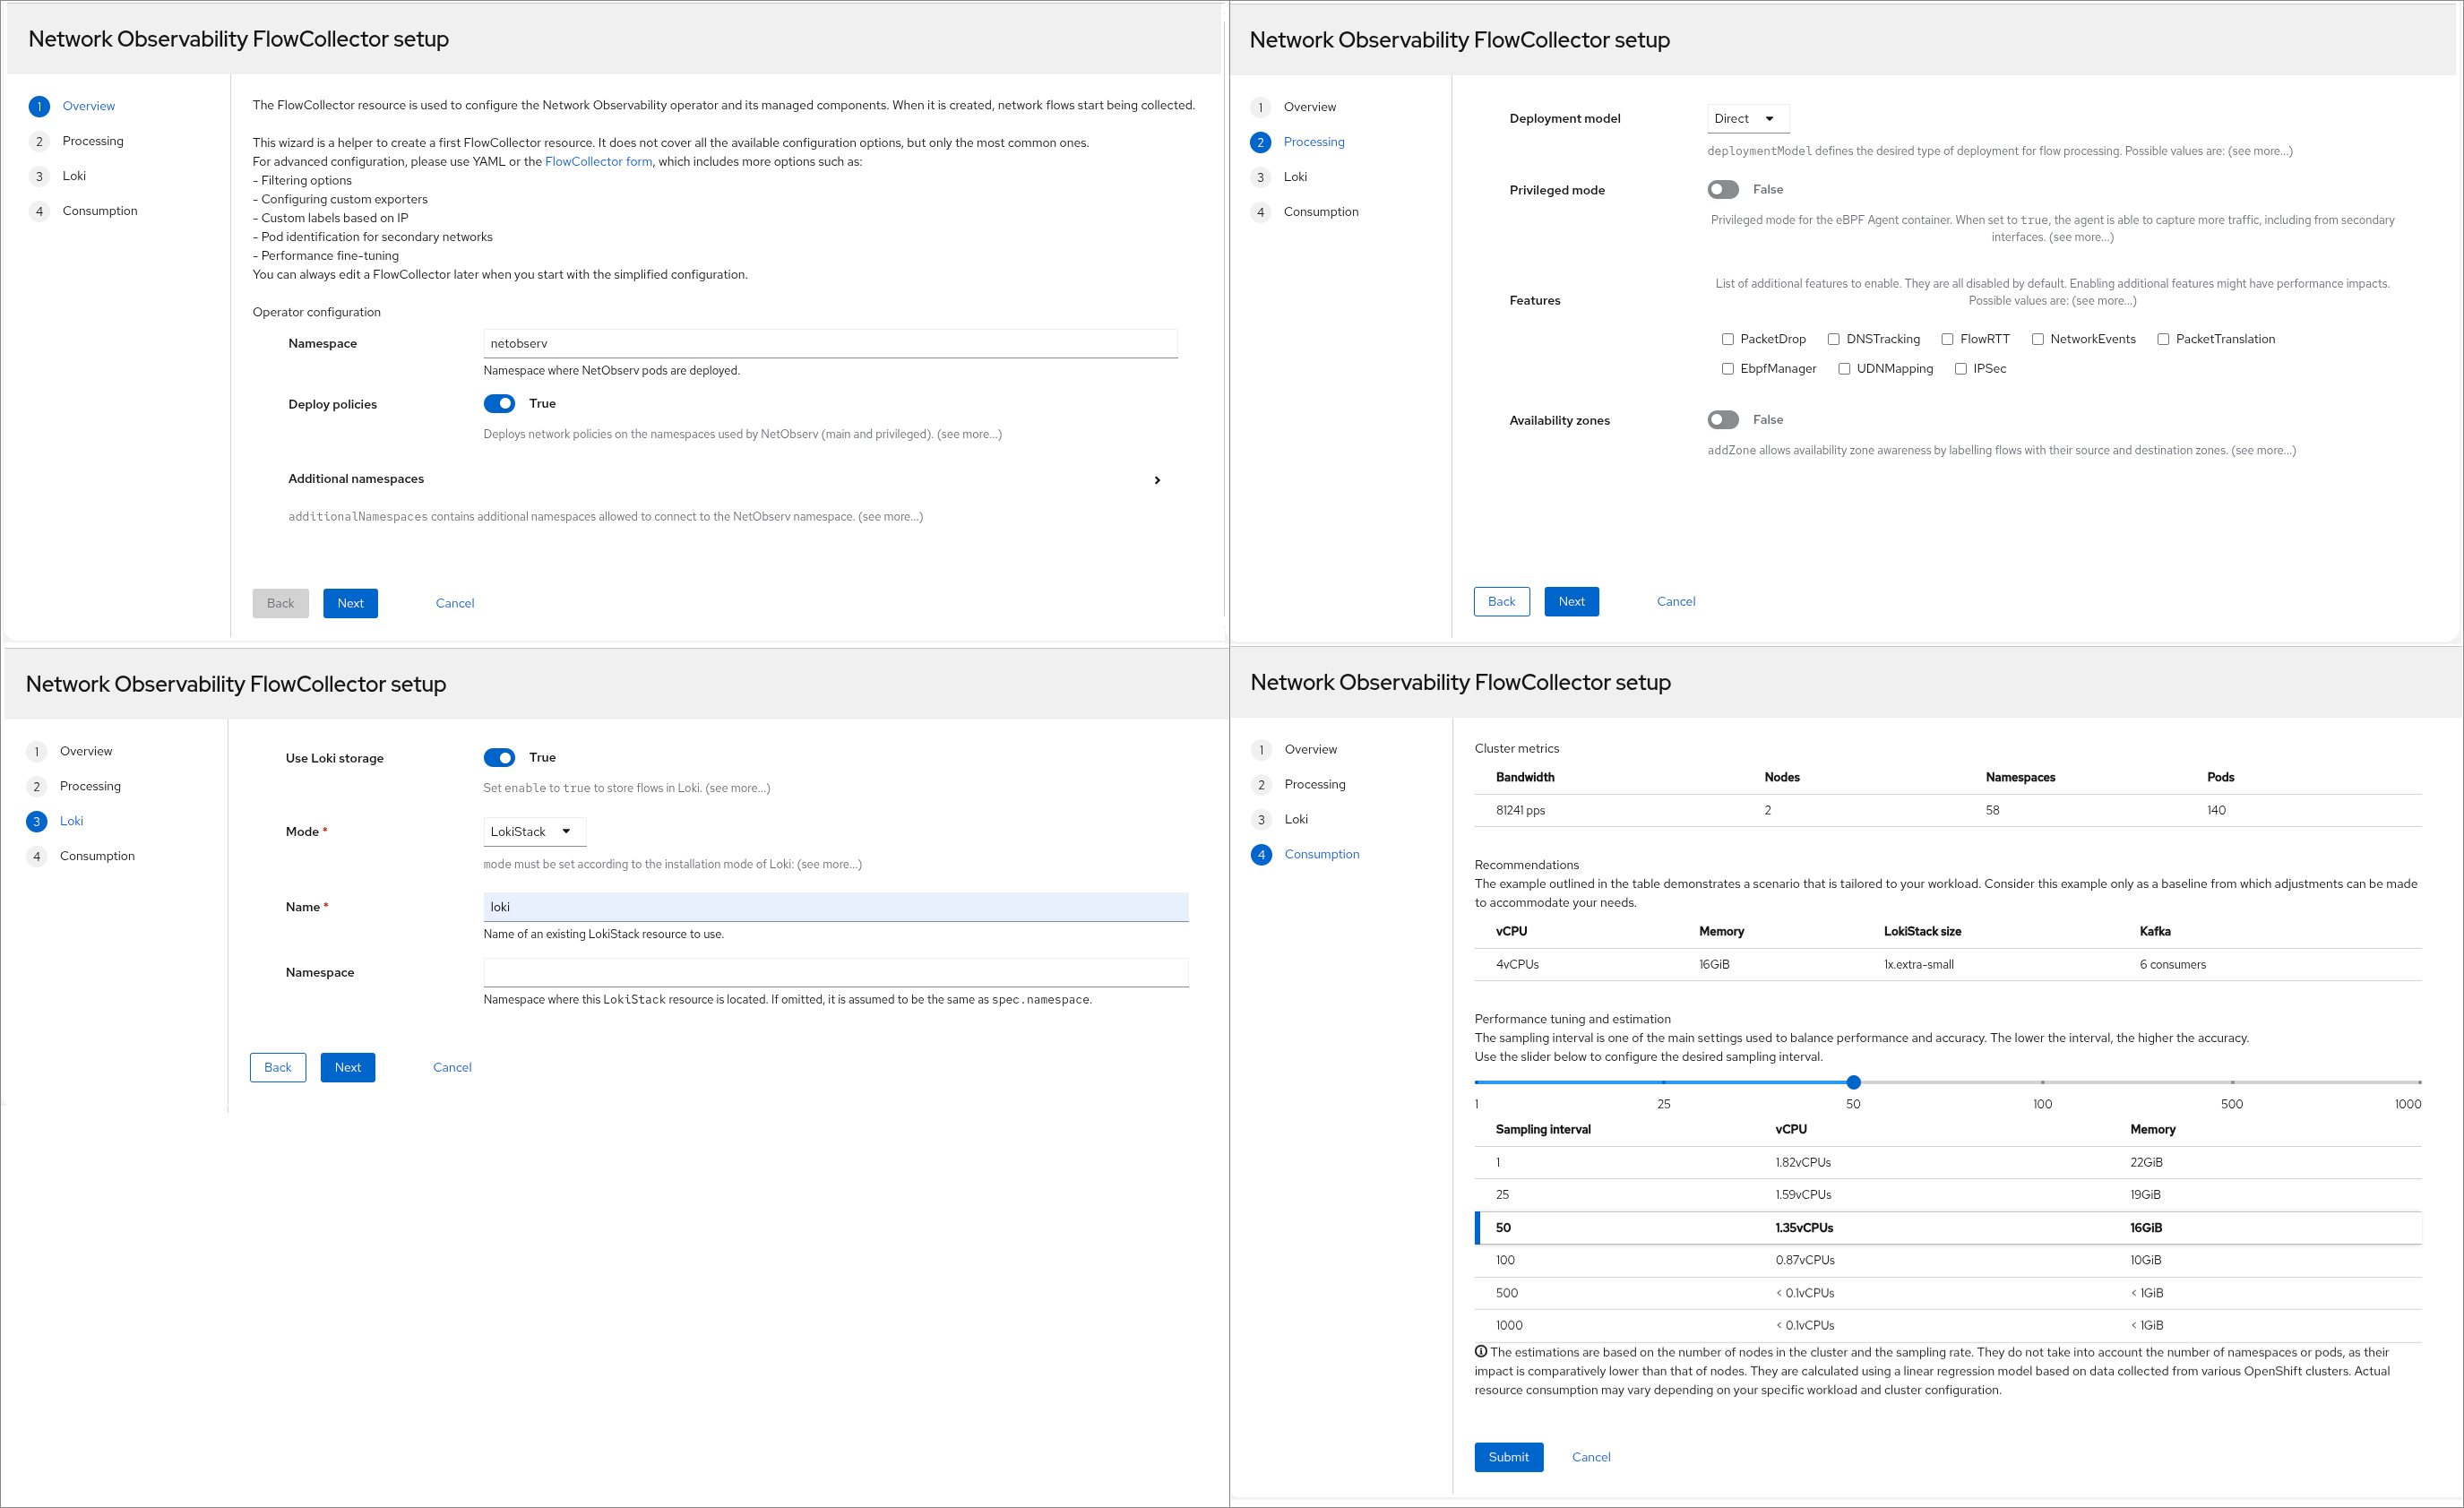
Step 1 gives an overview of the FlowCollector and basic configuration. We will cover the Deploy policies field in the "Improve security with network policies" section. Since many parameters are not available in the wizard, if you prefer the traditional form or YAML view, click the FlowCollector form link in the second paragraph.
Step 2 allows you to choose the Deployment model where you can enable Kafka, which is typically necessary for large clusters. This is also where you can enable various eBPF features, many of which help with troubleshooting. You can choose to include zone information.
Step 3 configures Loki to store flow logs. Although optional, without Loki there will not be a traffic flows table because it only stores metrics. The default Loki mode is LokiStack instead of monolithic.
Step 4 provides guidance on setting the sampling interval.
FlowCollector status
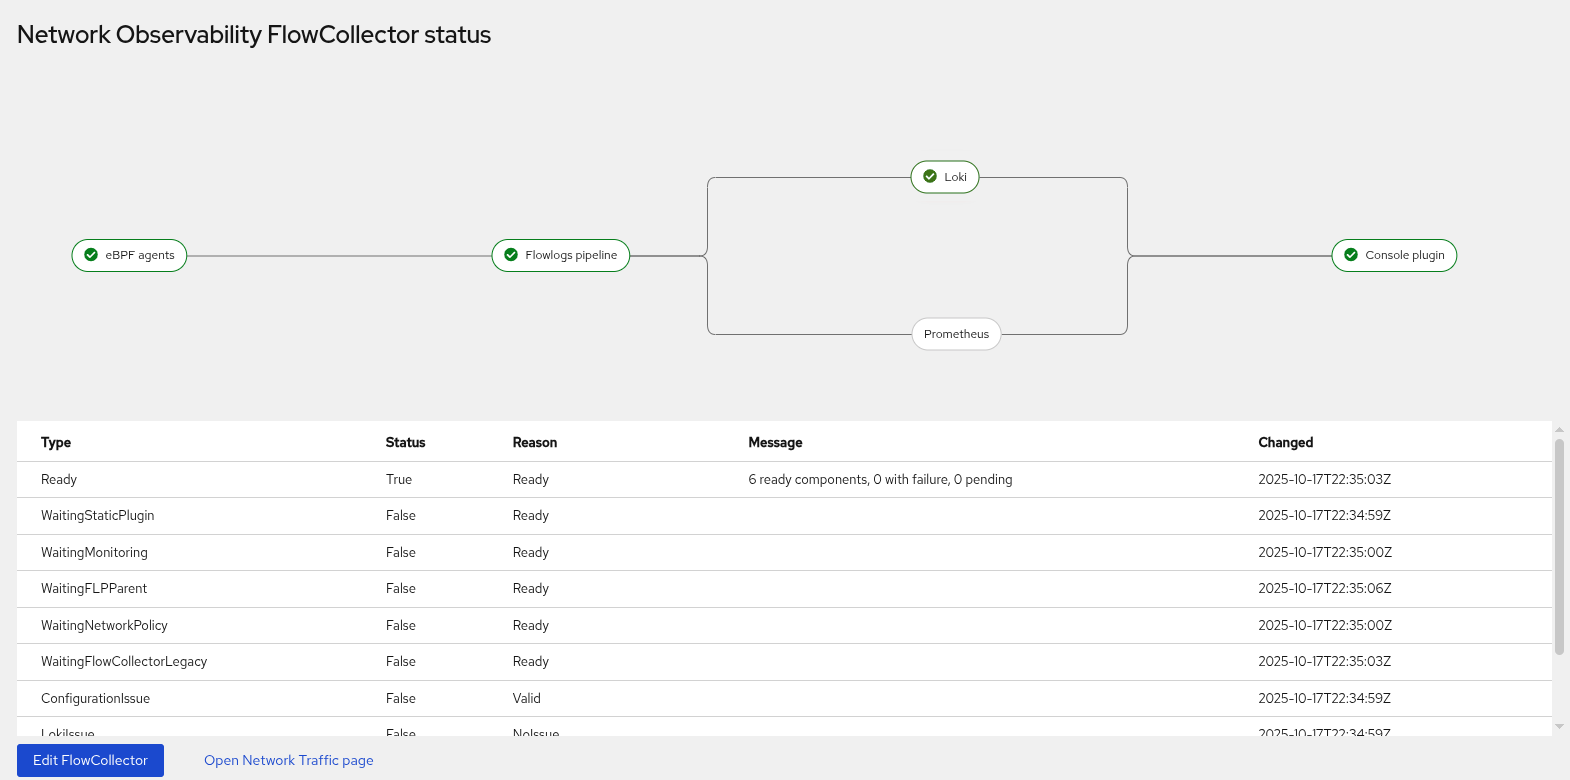
Once you click Submit in step 4, it shows a graphical status as the FlowCollector initializes and comes up (Figure 2).
The FlowMetric setup
Like the FlowCollector setup, there is a new 4-step wizard for the FlowMetric setup (Figure 3). The FlowMetric CRD allows you to define your own custom metrics.
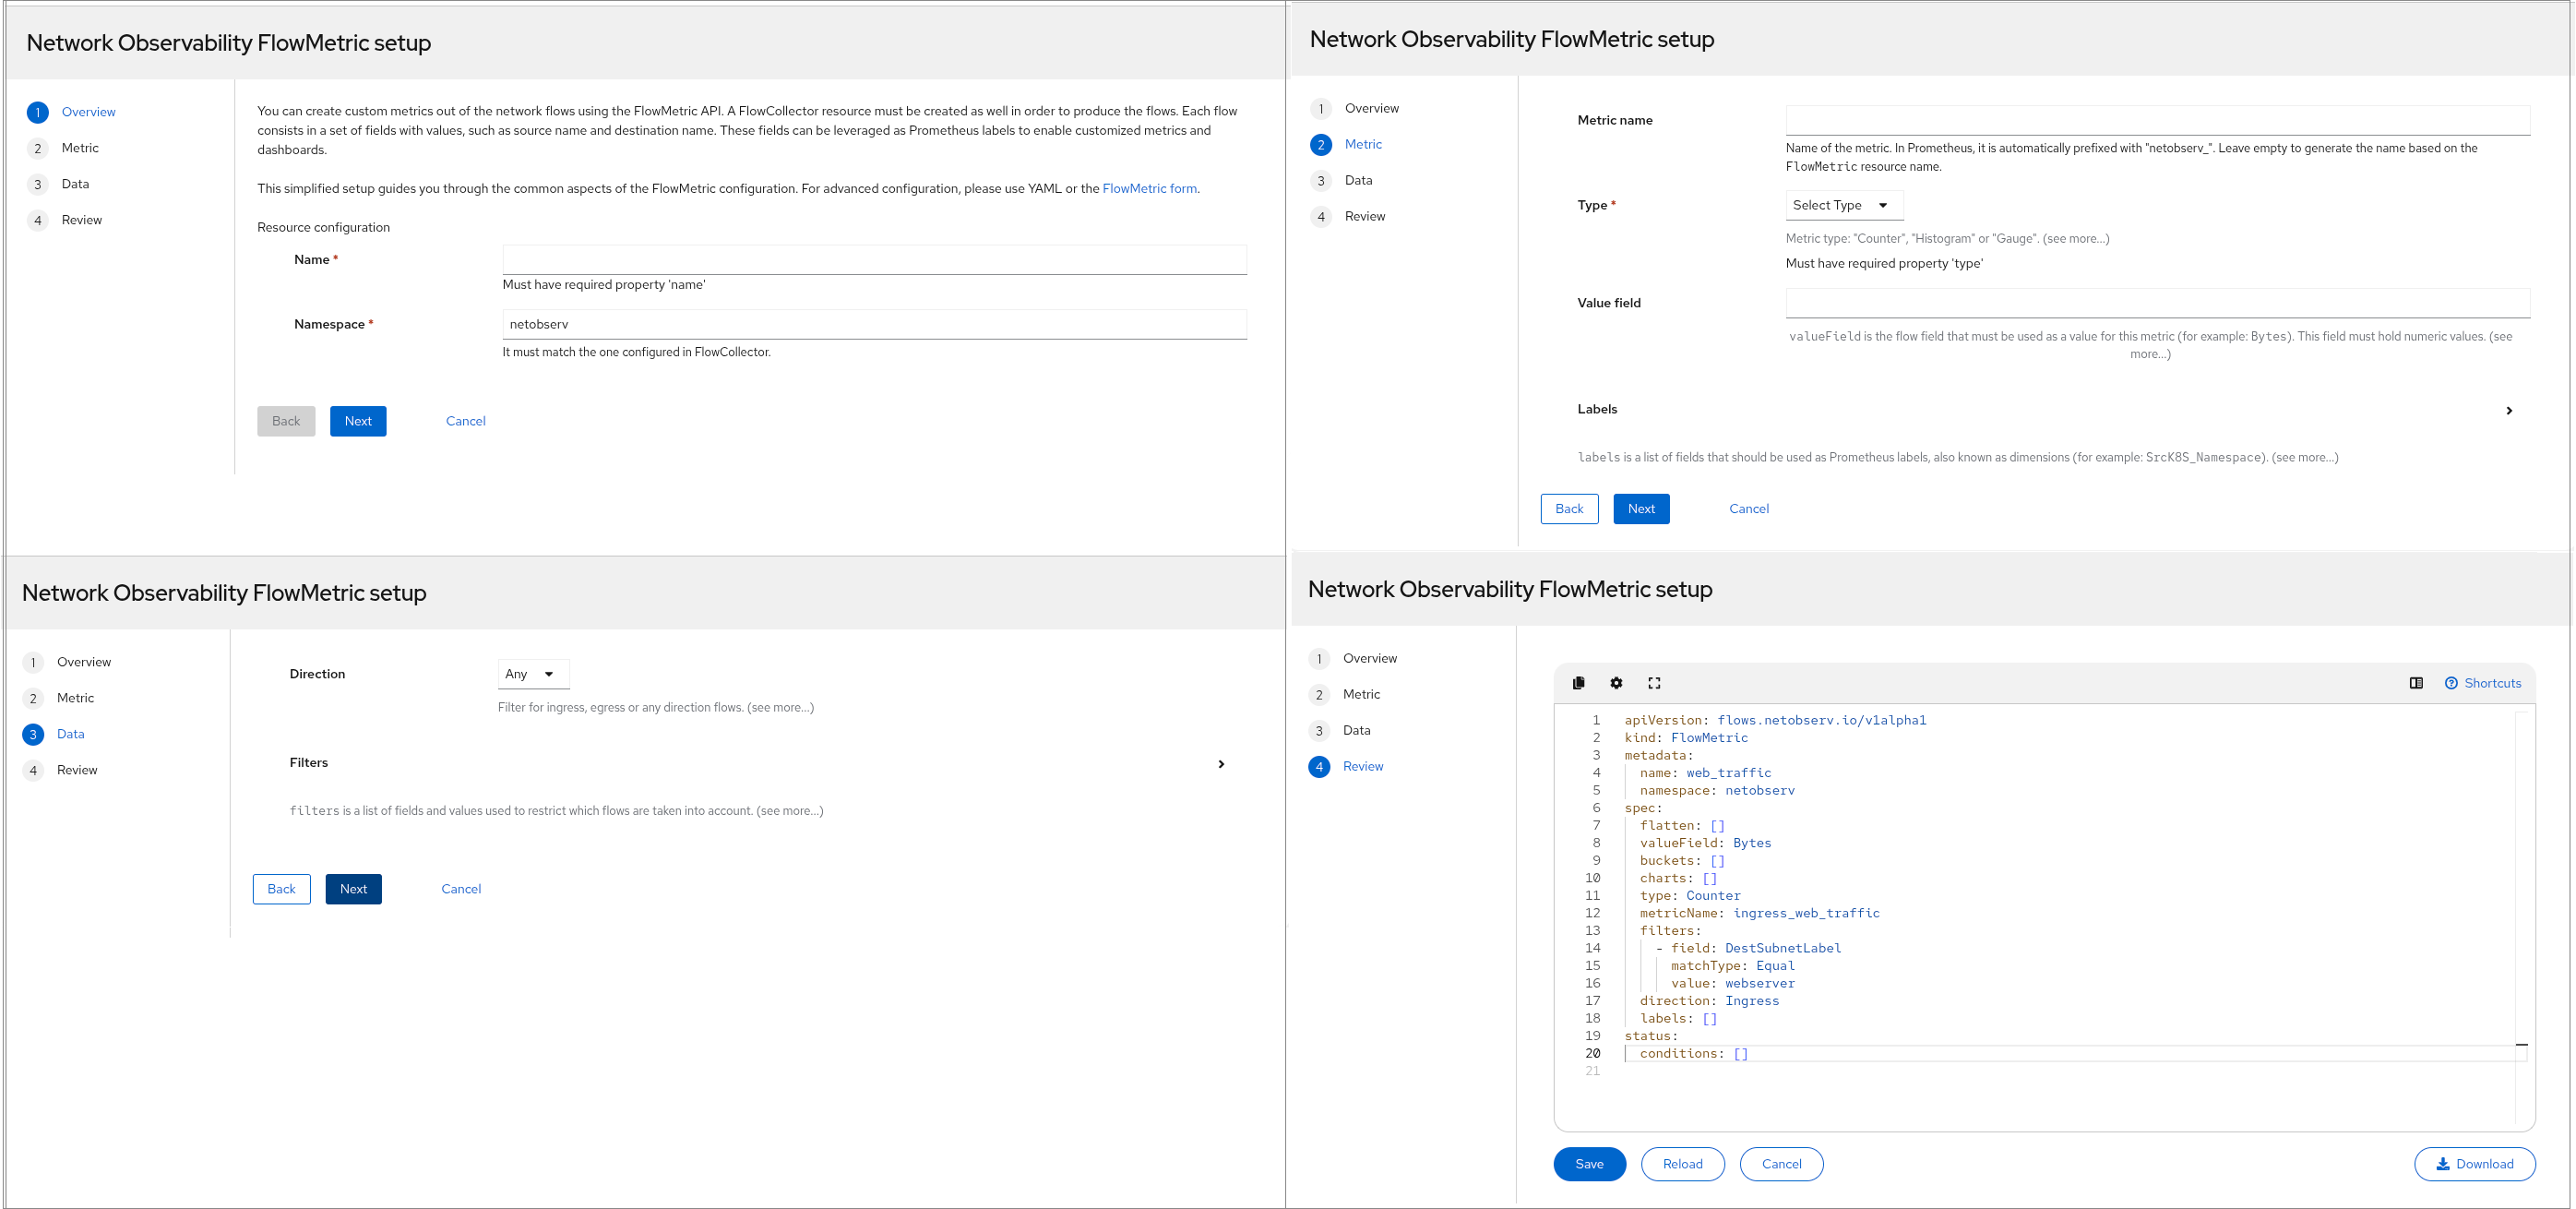
Step 1 provides an overview of custom metrics. You start by giving the metric a resource name and a namespace.
Step 2 asks for information about the metric, such as the metric name, type (i.e., counter, histogram, or gauge), the name of the field used by this metric (Value field), and an optional list of Prometheus labels.
Step 3 asks for the direction of the flow and a list of filters to determine the flows of interest.
Step 4 displays the manifest (YAML), with the option to edit before saving.
Improve security with network policies
To improve the security hygiene of your cluster, it is highly recommended that you apply a network policy to allow only the necessary traffic between Network Observability and other pods for both ingress and egress. In this release, when the Container Network Interface (CNI) plugin is OVN-Kubernetes, the network policies are created and enabled by default as shown in step 2 of the FlowCollector Setup.
If you use Loki or Kafka, it's recommended that you put these components in a different namespace for better isolation. When using the FlowCollector wizard, it will automatically update the network policy accordingly. Otherwise, you have to make sure the network observability network policy, located at Networking > NetworkPolicies, is allowed to communicate with Loki and/or Kafka.
Technology preview of custom alerts
Up to now, network observability focused on showing the network traffic flows for your cluster. This is the first release where it's providing notifications in the form of alerts.
This is a Technology Preview (TP) feature, and hence, there is no support until General Availability (GA), so use with caution. The feature is disabled by default, so first you must enable it. On the terminal, enter oc edit flowcollector and configure the following in the advanced section:
spec:
 processor:
   advanced:
     # add these two lines
     env:
       EXPERIMENTAL_ALERTS_HEALTH: "true"  # must have quotes
For convenience, network observability has many predefined alerts, but they are only active if the specific eBPF feature is enabled. For example, if you want alerts for DNS, edit FlowCollector to add DNSTracking:
spec:
 agent:
   ebpf:
     features: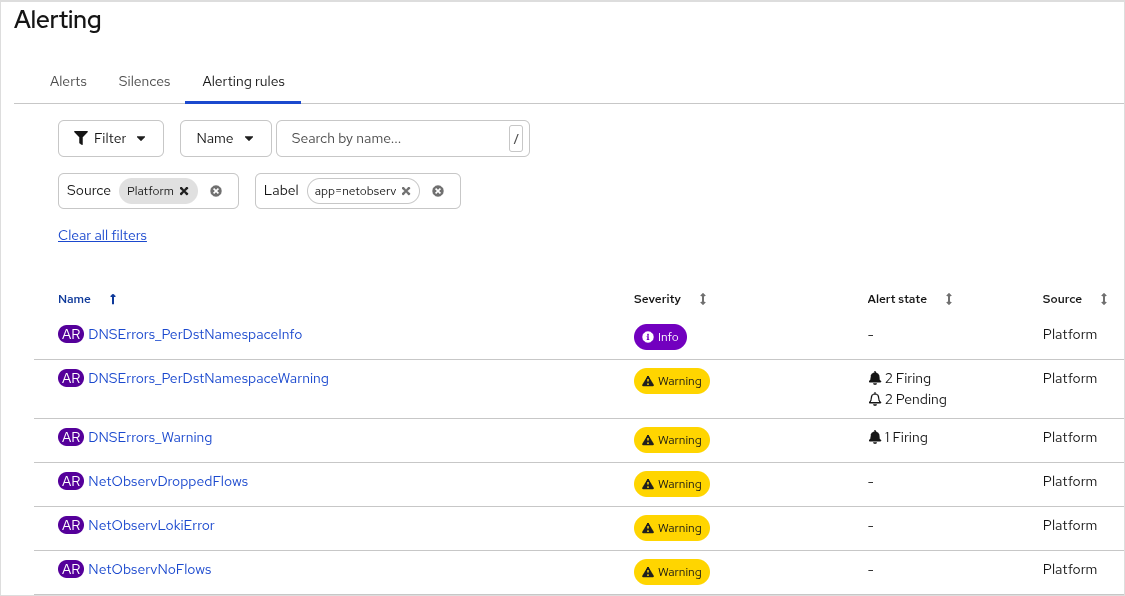
- DNSTracking- Refresh the browser page and go to Observe > Alerting.
- Click the Alerting rules tab.
- In the dropdown for Name, change it to Label.
- Enter
app=netobserv. You should see the three DNSErrors alerts, in addition to the four NetObserv alerts (Figure 4). If not, wait a few seconds. If it still doesn't show up, make sure the changes were accepted in FlowCollector.
The following shows the FlowCollector configuration if you want to see all the predefined alerts. You must also enable privileged mode for PacketDrop.
spec:
 agent:
   ebpf:
     features:
     - DNSTracking
     - FlowRTT
     - IPSec
     - NetworkEvents
     - PacketDrop
     privileged: true
Underneath the covers, it creates a PrometheusRule object. To see what that looks like, enter oc get prometheusrules -n netobserv -o yaml. However, if you want to modify a predefined alert, you must edit FlowCollector as described here. If you get ambitious, you can also write your own custom alerts. Refer to the Alerts in the NetObserv Operator for more information on this feature.
The network health dashboard
The second Technology Preview is the network health dashboard. The same environmental variable EXPERIMENTAL_ALERTS_HEALTH, also used for custom alerts (see the previous listing), enables this feature.
When you refresh the browser, there is a new menu panel at Observe > Network Health (Figure 5).
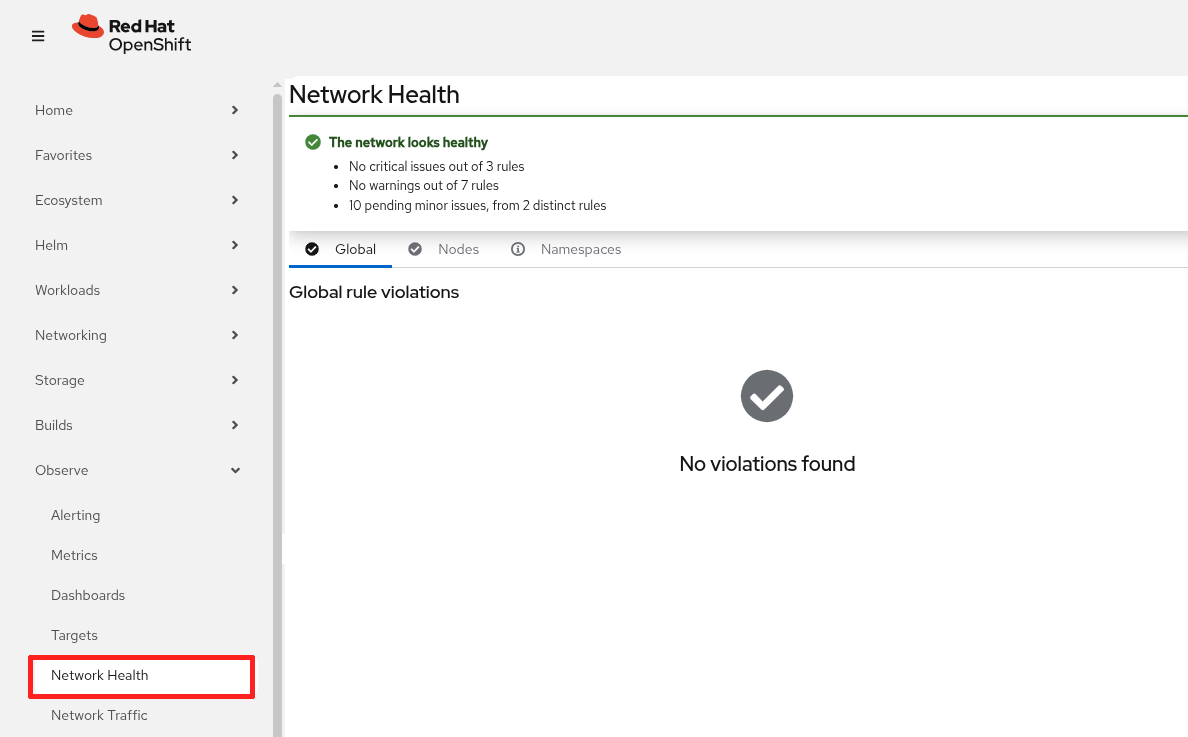
At the top of the network health dashboard, it gives an overall summary of the network health. Below that, there are three tabs: Global, Nodes, and Namespaces. Each of these tabs shows rule violations at that level. For example, Figure 5 indicates there are no global violations found.
Network observability CLI 1.10
The network observability CLI 1.10 gets a new facelift in this release. While it's still a text-based user interface, you can now use the mouse to interact with the program. It is an oc plug-in that captures, displays, and saves flows, metrics, or packet information.
Follow the installation instructions to set this up on your local computer. It runs independent of whether you have network observability operator installed or not.
Before you run the program, it's best to widen your terminal to 100+ characters and 40+ rows for a better display. Then enter oc netobserv followed by one of flows, metrics, or packets <filter>. Append help to the command to get online help.
I'll go over the three main modes and describe the changes in this release. If you want the complete documentation, read the chapter on the network observability CLI.
Traffic flows
To see the traffic flows table, enter oc netobserv flows and add any other options to the command (Figure 6). By default, it uses the dark mode.
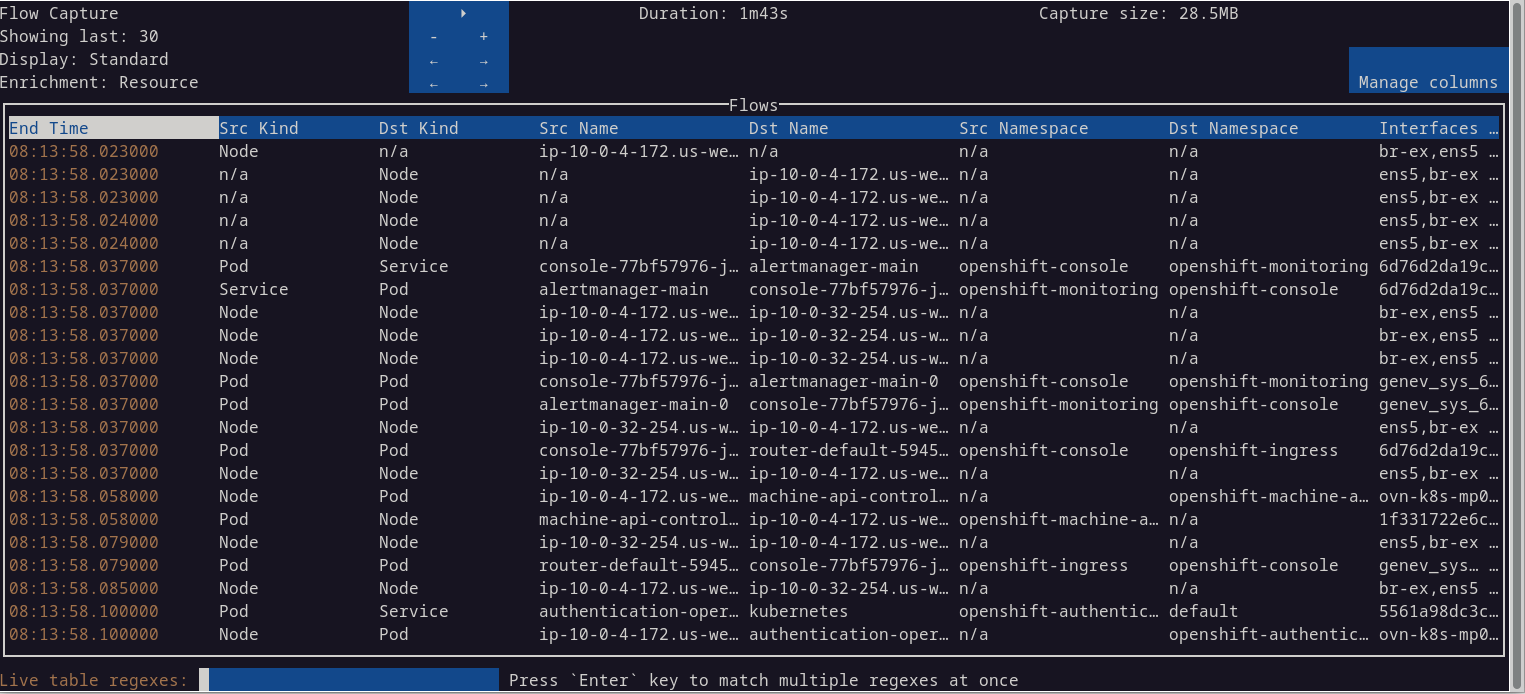
The blue square at the top has a number of controls. The triangle is a new play/pause button that's accessible with the mouse. This is a nice addition for pausing the data. Note that while it's paused, data is still collected.
Below the play/pause button are the "-" and "+" buttons. Each row corresponds to decreasing or increasing the value on that same row. Therefore, the first set of buttons decreases or increases how many rows to display. The next Display row, cycles through the eBPF features. The last Enrichment row, shows different columns.
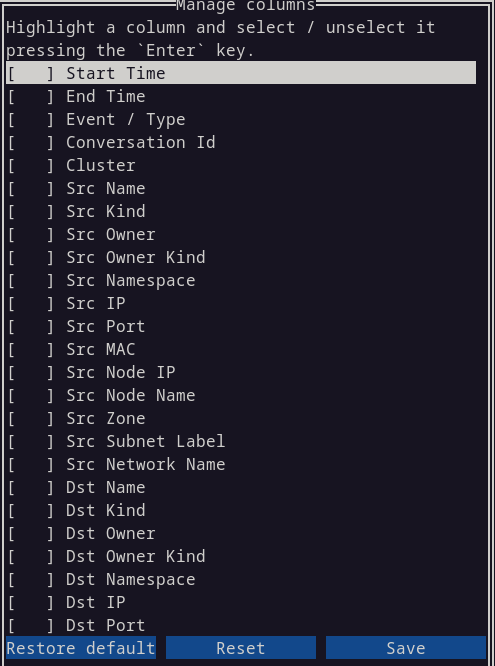
The Manage columns button is new (Figure 7). It allows you to select a set of columns to display. Select or deselect a column using the Enter key (not the mouse).
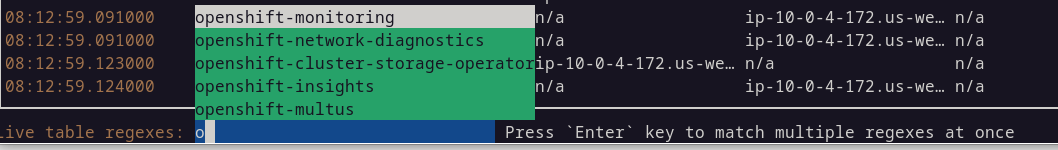
The filter field at the bottom of the screen was improved. As you type into this field, it provides auto-suggestions in a dropdown choice list (Figure 8). You can also enter multiple filters.
Use the tab key to toggle between the flows table and the filter field. While in the table, you can move around using the h,j,k,l keys, for those of you who are familiar with vi.
Tip: Sometimes the network observability CLI will exit before I am done. To increase the time it runs, add the --max-bytes option such as --max-bytes=500000000 (500 MB). Of course, you will need to have enough disk space to store the temporary data.
Metrics
To view the metrics, enter oc netobserv metrics --enable_all plus any other options to the command (Figure 9). The --enable_all is optional and turns on all eBPF features. Otherwise, many of the graphs will be blank.
In the previous release, you could only see graphs with the OpenShift web console. Now there are text-based graphs.
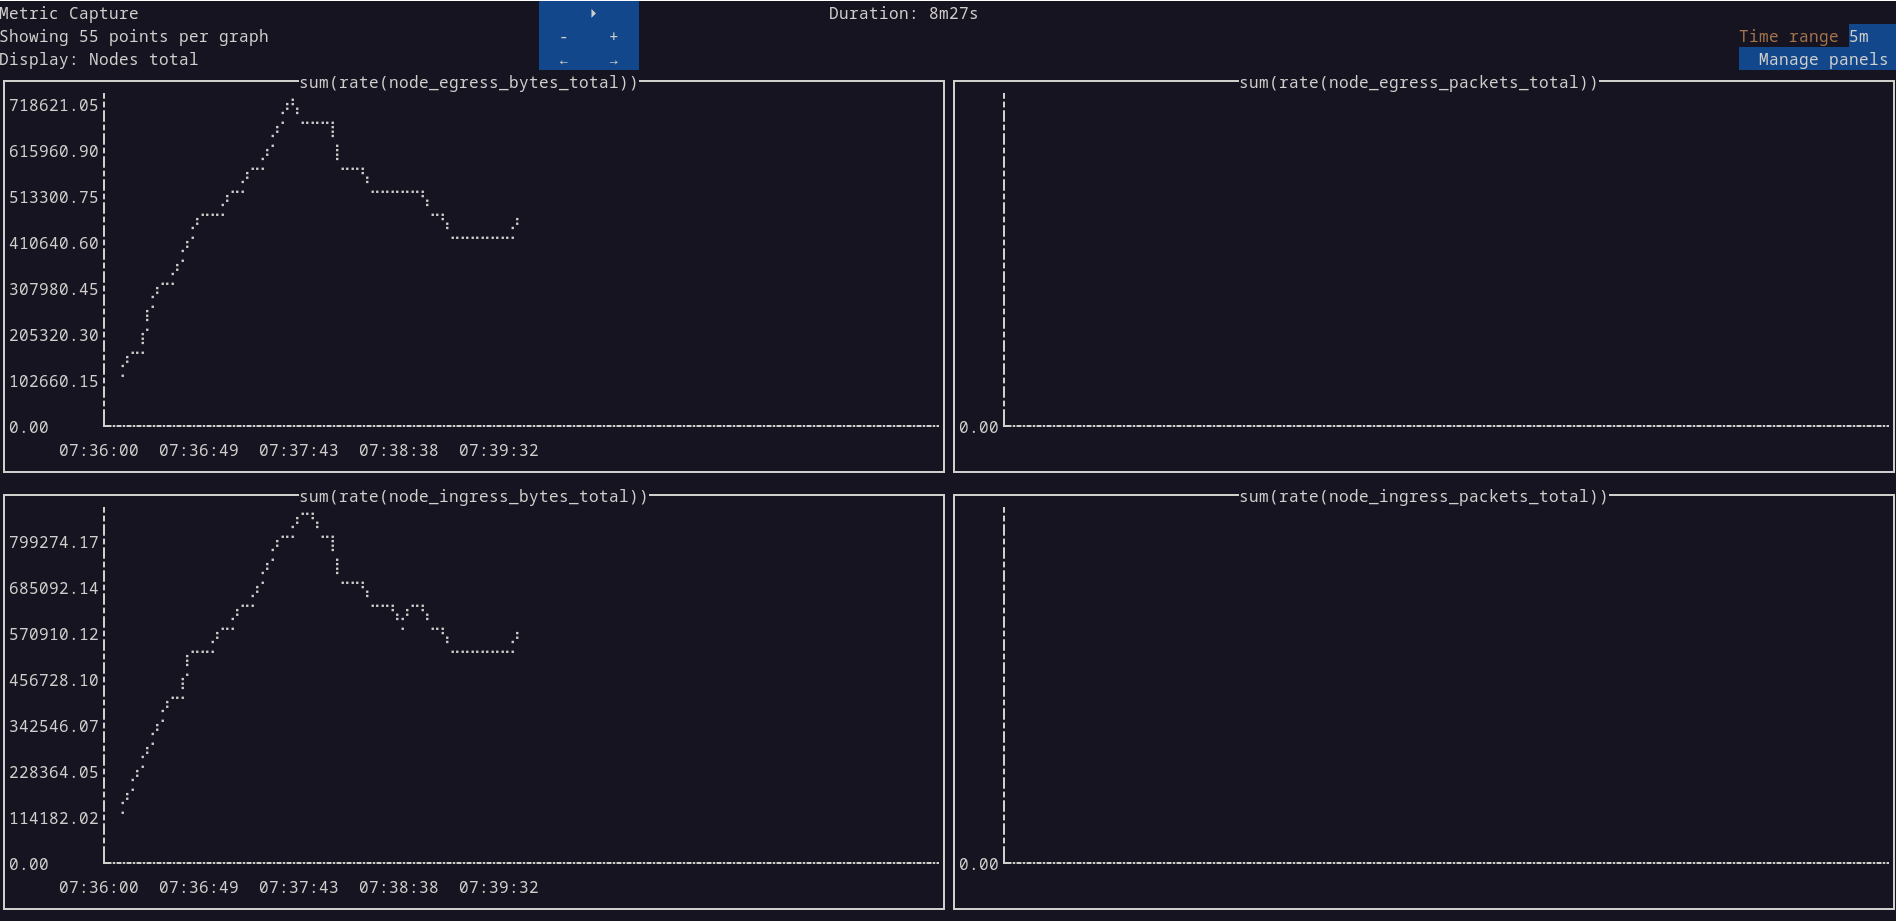
oc netobserv metrics --enable_all to see the metrics graphs.In the blue box, you can increase or decrease the number of points in the graph by increments of 5. You can also cycle through the different sets of graphs in the Display row. If you want the OpenShift web console to display the graphs like before, add the --background option.
Similar to the Manage columns in the Flows mode, there is a Manage panels button that lets you choose the graphs you want to display. Select or deselect a panel using the Enter key (not the mouse).
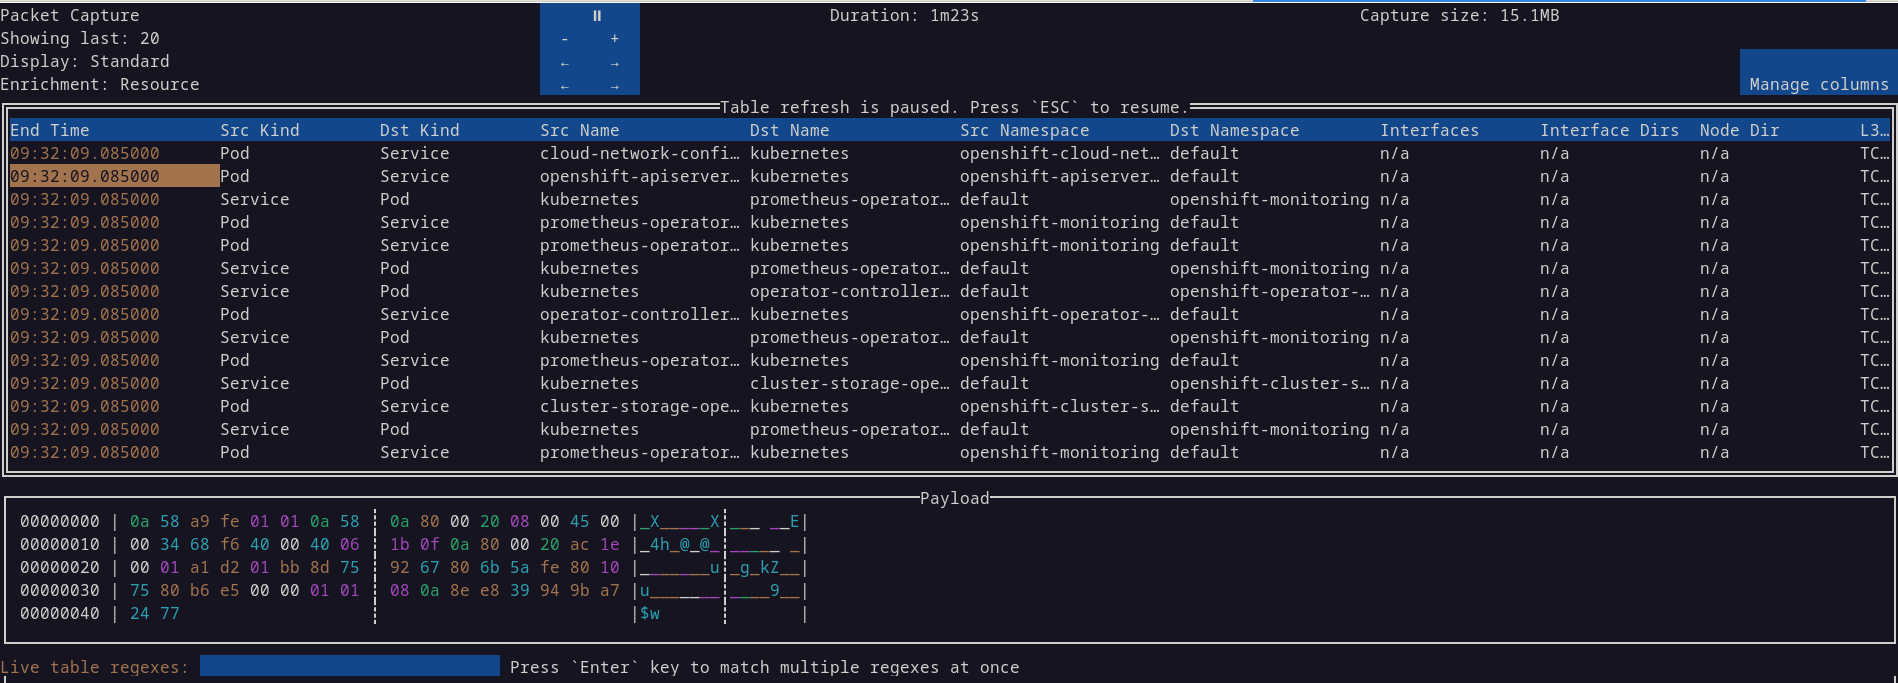
Packets
To view packets, enter oc netobserv packets <filter>. A filter is required such as oc netobserv packets --port=443. If you want to inspect a packet, you can do that directly now without having to resort to an external tool like Wireshark (Figure 10). Press tab to go to the table. Move to the particular row and press Enter.
oc netobserv packets <filter> to see the packets table.Wrap up
In the network observability CLI, there are significant improvements in the user interface and ease of use. The UI has been completely revised and supports the mouse. Columns in the flow table and selection of graphs to display for metrics are customizable. It is now able to display graphs and packet captures without resorting to external programs.
In network observability, it is easier to create a FlowCollector and FlowMetric instance. It is more secure with the use of network policies. The custom alerts and Network Health Dashboard, while still in Technology Preview, are signs of things to come. As we move beyond insights into analysis, give us feedback on the discussion board.
Special thanks to Joel Takvorian, Julien Pinsonneau, and Amogh Rameshappa Devapura for reviewing this article.
