In a distributed microservices architecture, the failure of one service can cascade, leading to system-wide outages. To build resilient and fault-tolerant applications, we must isolate failures and prevent them from spreading. The circuit breaker is a critical design pattern that addresses this challenge by temporarily blocking traffic to a service that it detects as unhealthy, giving it time to recover.
This guide shows you how to configure, trigger, and monitor a circuit breaker using Red Hat OpenShift Service Mesh 3.0. By the end, you'll have a hands-on understanding of how to use Istio's outlier detection to automatically improve your application's stability on OpenShift.
Prerequisites
Before you begin, ensure your environment is fully prepared. This guide assumes you have the following setup:
- An OpenShift Container Platform cluster: You will need access to a cluster running version 4.16 or newer with administrator privileges.
- Command-line tools: The OpenShift CLI (
oc) and Kubernetes CLI (kubectl) must be installed and configured to connect to your cluster. Red Hat OpenShift Service Mesh and the Bookinfo sample application: You need a project (for example,
bookinfo) where the OpenShift Service Mesh control plane is installed and the Bookinfo sample application is deployed. The application's product page must be accessible via the Istio ingress gateway.If you need to set this up, follow the official Red Hat documentation to install OpenShift Service Mesh and deploy the Bookinfo application. (Complete sections 2.1 through 2.5.3 of the tutorial.)
Kiali for monitoring: This tutorial uses Kiali to visualize the circuit breaker's status. Ensure you have configured access to the Kiali console.
To set this up, follow the official documentation to expose and access the Kiali console. (Complete sections 4.1.1 through 4.1.3).
Step-by-step instructions
Follow these steps to deploy the application, configure the circuit breaker, and monitor the results.
Step 1: Preparation
First, verify that the Bookinfo application is running correctly and that all pods are in a Running state.
oc get pods -n bookinfoYou should see output similar to this, with pods for productpage, details, ratings, and three versions of reviews along with istio-igressgateway.
NAME                                   READY   STATUS    RESTARTS      AGE
details-v1-7c799b8b4b-7npbl            2/2     Running   0             9d
istio-ingressgateway-7bb7fb8fd-8sbxr   1/1     Running   0             9d
productpage-v1-f8479c768-s72st         2/2     Running   0             9d
ratings-v1-7fccfc8b8b-dr6xp            2/2     Running   4 (9d ago)    18d
reviews-v1-8cc49957f-gswj6             2/2     Running   0             9d
reviews-v2-5bf9856f5c-bcswn            2/2     Running   0             9d
reviews-v3-6d8f75d44c-fqmzf            2/2     Running   3 (17h ago)   17h
Generate load and inspect the Kiali graph for traffic (see Figure 1).
while true; do
  echo "$(date) - Status: $(curl -s -o /dev/null -w '%{http_code}' http://istio-ingressgateway-bookinfo.<yourdomainName>/productpage)"
  sleep 1
done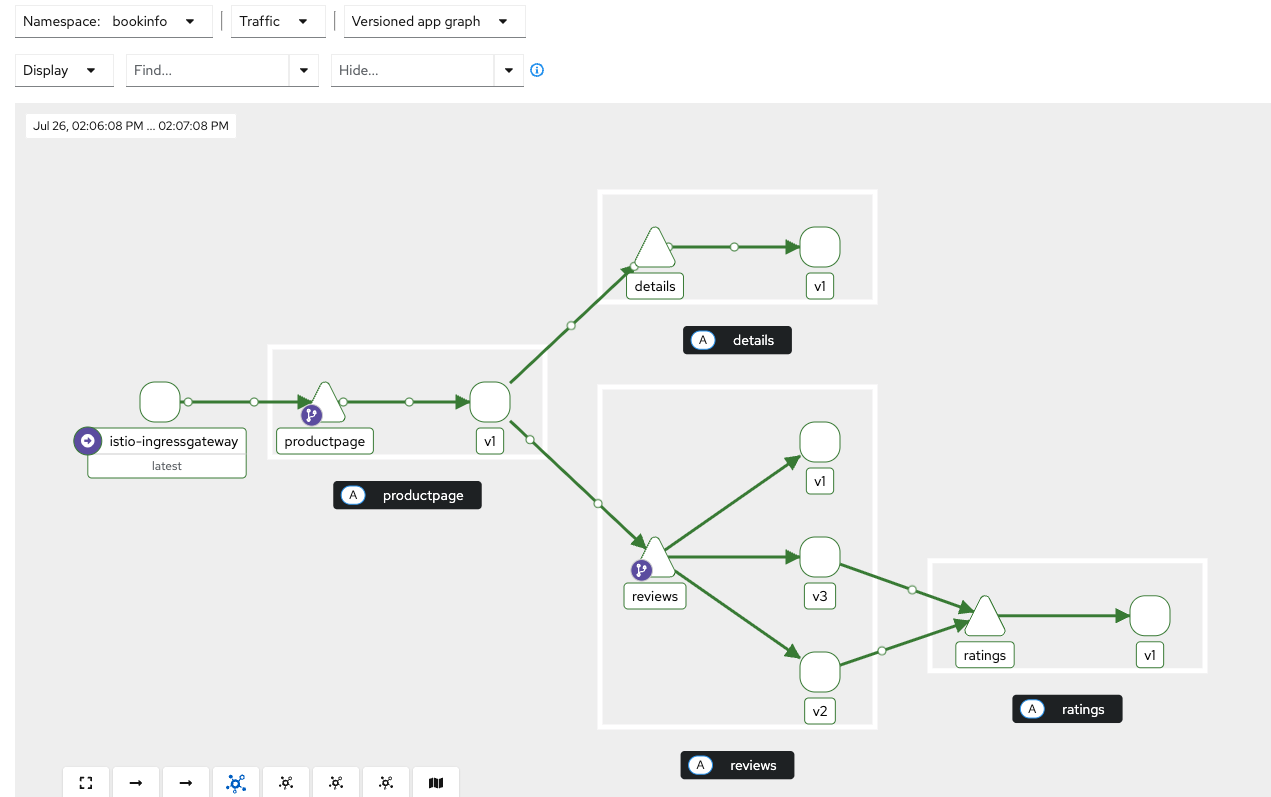
Step 2: Configure the circuit breaker
Circuit breaking is configured in Istio using a DestinationRule. We will apply a policy that monitors the reviews service. Specifically, we'll target the v3 subset. If an instance in this subset returns even a single 5xx error, the Envoy proxy will "eject" it from the load-balancing pool for 300 seconds.
Apply the following DestinationRule manifest:
apiVersion: networking.istio.io/v1
kind: DestinationRule
metadata:
  creationTimestamp: "2025-07-26T09:28:27Z"
  generation: 3
  name: reviews
  namespace: bookinfo
  resourceVersion: "38980107"
  uid: 27bd5ee9-ffaa-46d2-a75b-dea6db482e4c
spec:
  host: reviews
  subsets:
  - labels:
      version: v1
    name: v1
    trafficPolicy:
      loadBalancer:
        simple: ROUND_ROBIN
  - labels:
      version: v2
    name: v2
    trafficPolicy:
      loadBalancer:
        simple: RANDOM
  - labels:
      version: v3
    name: v3
    trafficPolicy:
      connectionPool:
        http:
          http1MaxPendingRequests: 1
          maxRequestsPerConnection: 1
        tcp:
          maxConnections: 1
      outlierDetection:
        baseEjectionTime: 300s
        consecutive5xxErrors: 1
        interval: 1s
        maxEjectionPercent: 100
consecutive5xxErrors: 1: Trips the circuit after one consecutive 5xx error.interval: 1s: The time interval for ejection analysis.baseEjectionTime: 300s: The instance remains ejected for 300 seconds.maxEjectionPercent: 100: Allows up to 100% of the instances to be ejected.
Next, we will update our traffic policy to route requests only to the v1 and v3 versions of the reviews service. Apply the following VirtualService manifest to implement this rule:
apiVersion: networking.istio.io/v1
kind: VirtualService
metadata:
  creationTimestamp: "2025-07-17T02:07:48Z"
  generation: 8
  name: reviews
  namespace: bookinfo
  resourceVersion: "38981001"
  uid: abd5dfe2-2526-4541-a079-d9194da4f4fb
spec:
  hosts:
  - reviews
  http:
  - route:
    - destination:
        host: reviews
        subset: v1
      weight: 50
    - destination:
        host: reviews
        subset: v2
      weight: 0
    - destination:
        host: reviews
        subset: v3
      weight: 50
Step 3: Enable detailed circuit breaker metrics
By default, Red Hat OpenShift Service Mesh collects a minimal set of statistics from its Envoy proxies to reduce resource consumption and improve performance. The specific metric we need to monitor our circuit breaker, envoy_cluster_outlier_detection_ejections_active, is not included in this default set. Refer to the documentation for more details.
To enable it, we must add an annotation to our application's pods. This annotation instructs the Envoy sidecar to include additional metrics, specifically those related to outbound cluster statistics.
The following is an abbreviated example of the reviews-v3 deployment manifest, modified to include the required annotation. Note the new annotations section under spec.template.metadata.
apiVersion: apps/v1
kind: Deployment
metadata:
  labels:
    app: reviews
    version: v3
  name: reviews-v3
  namespace: bookinfo
spec:
  progressDeadlineSeconds: 600
  replicas: 1
  revisionHistoryLimit: 10
  selector:
    matchLabels:
      app: reviews
      version: v3
  strategy:
    rollingUpdate:
      maxSurge: 25%
      maxUnavailable: 25%
    type: RollingUpdate
  template:
    metadata:
    # --- ANNOTATION ADDED HERE ---
      annotations:
        proxy.istio.io/config: |
          proxyStatsMatcher:
            inclusionPrefixes:
            - "cluster.outbound"
            - "cluster_manager"
            - "listener_manager"
            - "server"
            - "cluster.xds-grpc"
     # ---------------------------
      creationTimestamp: null
      labels:
        app: reviews
        version: v3
    spec:
........Important: For this tutorial, the annotation must be applied to all deployments involved in the requests (productpage, reviews-v1, reviews-v2, reviews-v3).
Step 4: Generate traffic
With our configurations in place, we need to generate a consistent stream of user traffic. Now, run the following command in a new terminal window. It will continuously send requests to the /productpage every second, printing the HTTP status code of the response.
while true; do
  echo "$(date) - Status: $(curl -s -o /dev/null -w '%{http_code}' http://istio-ingressgateway-bookinfo.<yourdomainName>/productpage)"
  sleep 1
done
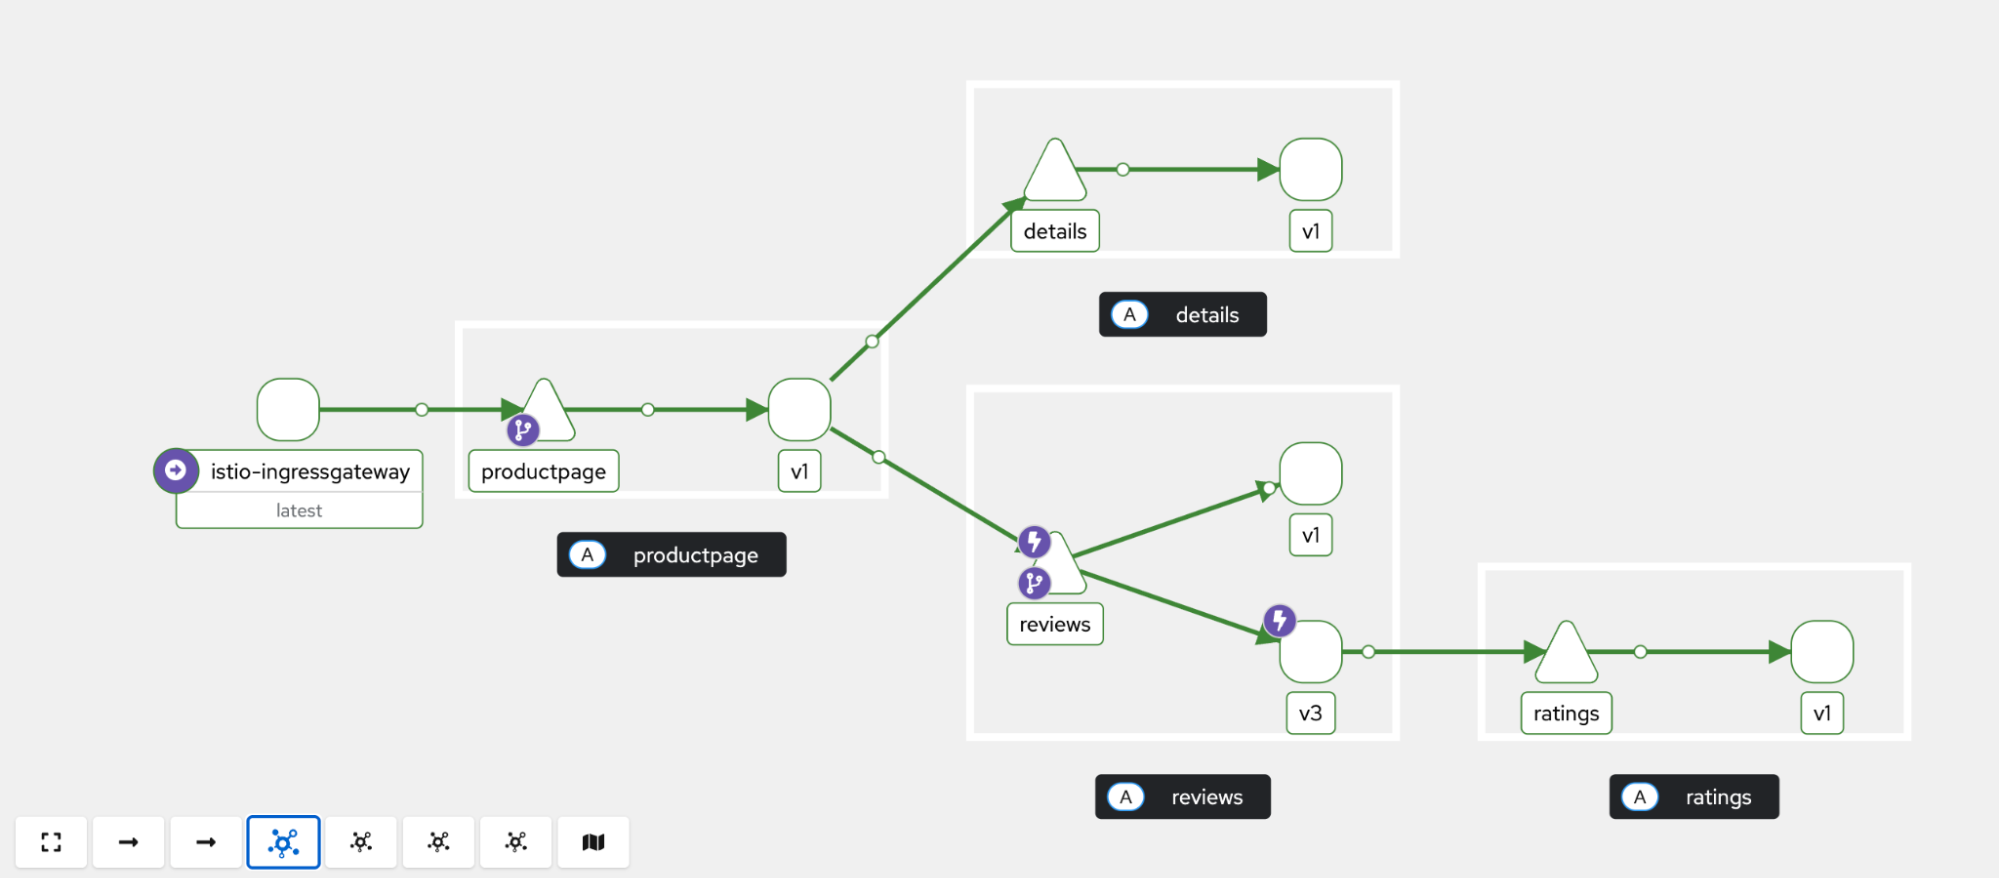
In the Kiali service graph (Figure 2), observe the traffic flow. You will see that requests to the reviews service are split between the v1 and v3 versions, and that only the reviews:v3 workload calls the ratings service.
Step 5: Simulate a service failure
Now, we will deliberately cause the reviews:v3 service to fail. This will generate the 5xx errors needed to trip the circuit breaker we configured earlier. A direct way to simulate a critical failure is to terminate the main process within the container, causing the pod to crash and become temporarily unavailable.
Execute the kill 1 command inside the reviews container of that specific pod. This command terminates the main application process, causing the container to exit with an error. See Figure 3.
oc exec -n bookinfo reviews-v3-6d8f75d44c-fqmzf -c reviews -- kill 1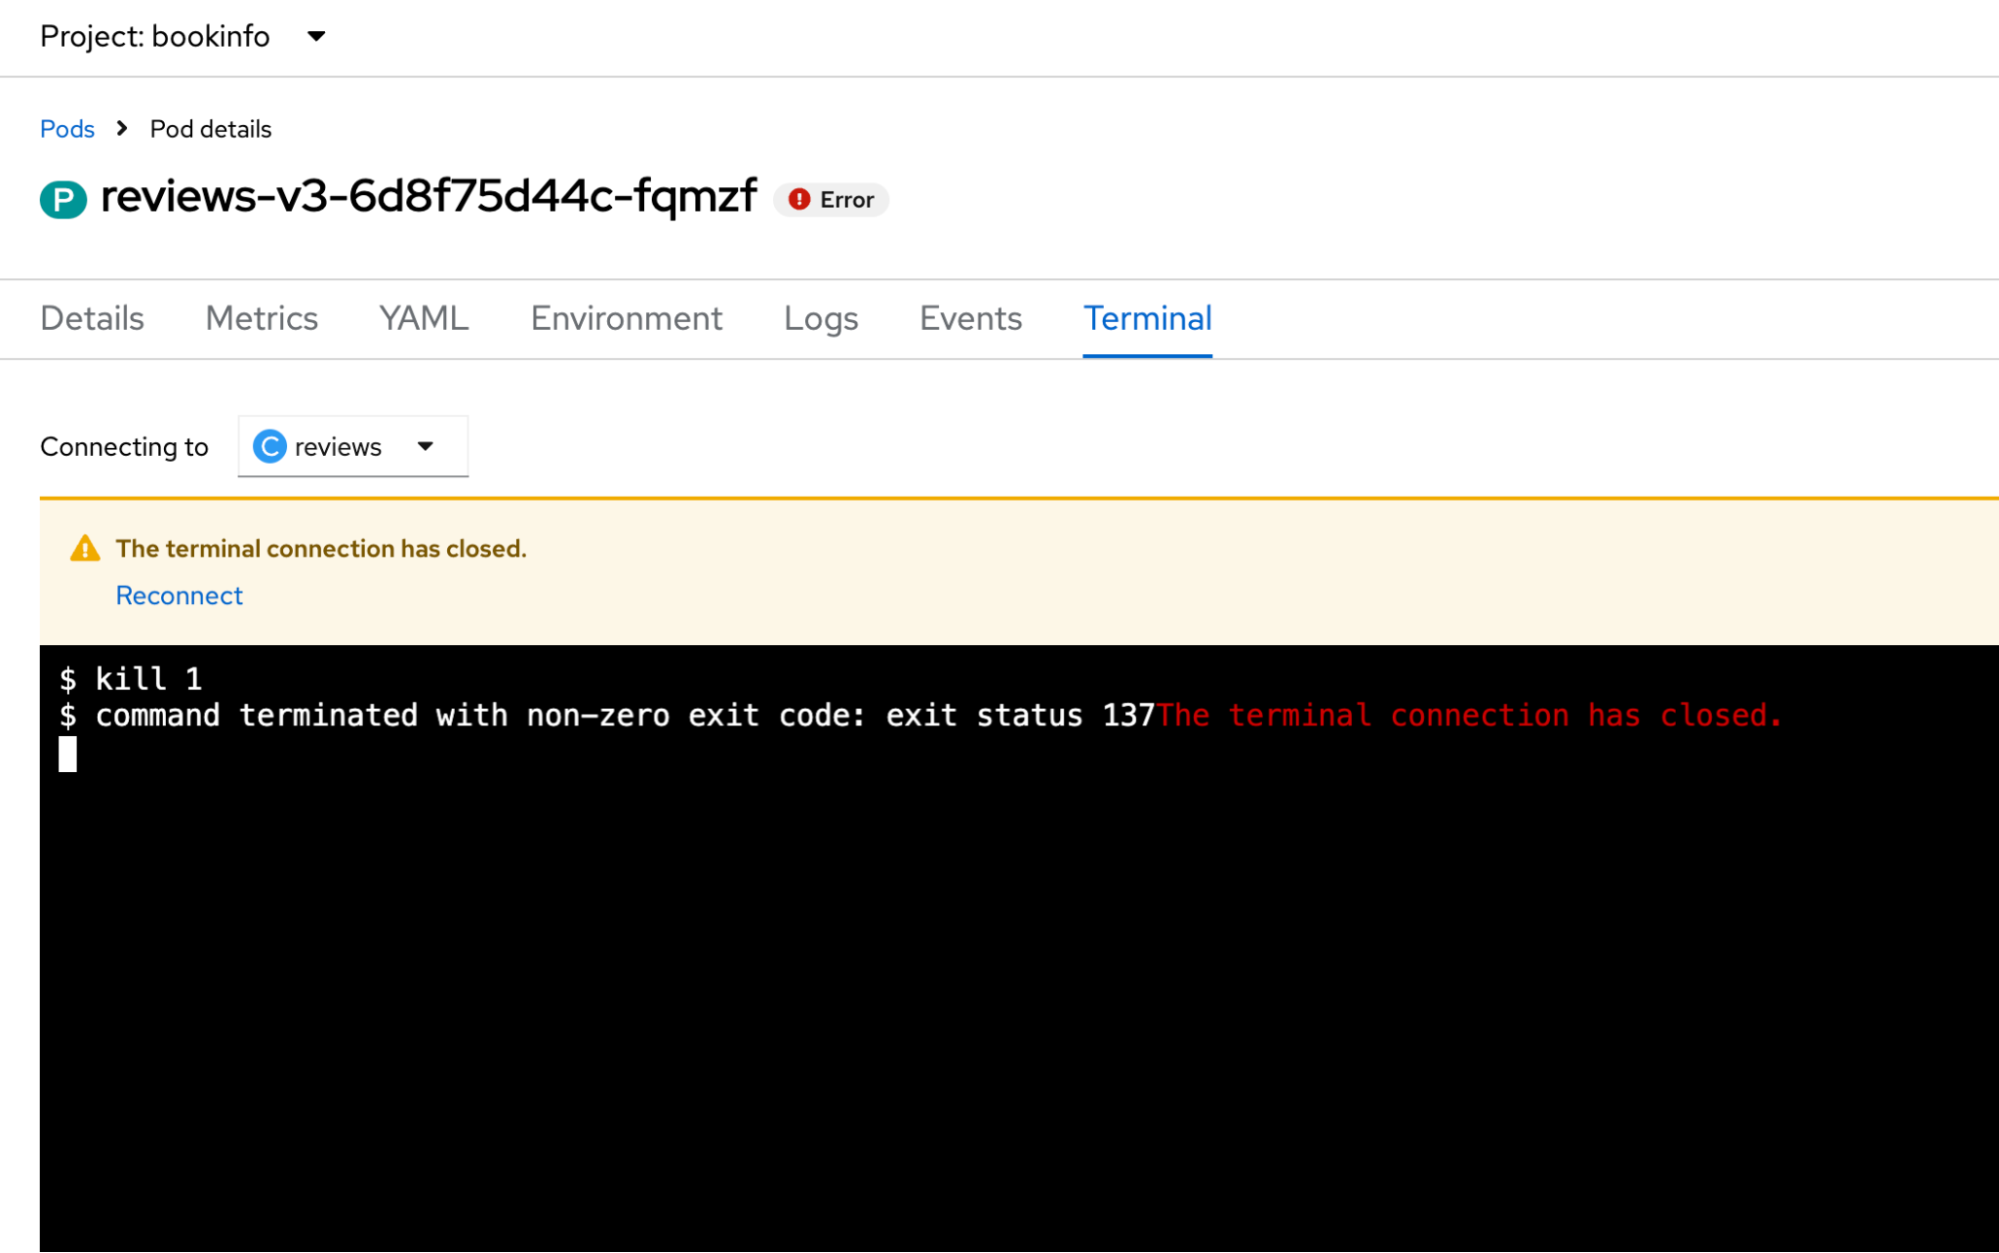
Immediately after running this command, look at your traffic generation terminal from Step 4. You will see the output change from 200 to 503 (Service Unavailable) as the Envoy proxy attempts to route requests to the now-unresponsive pod.
OpenShift will automatically restart the crashed pod, but during this failure window, our circuit breaker will detect the 5xx errors and trip.
Step 6: Monitor the circuit breaker in the console
While the traffic generation script is running, let's observe the circuit breaker in action.
- Navigate to the Observe → Metrics section in your OpenShift web console.
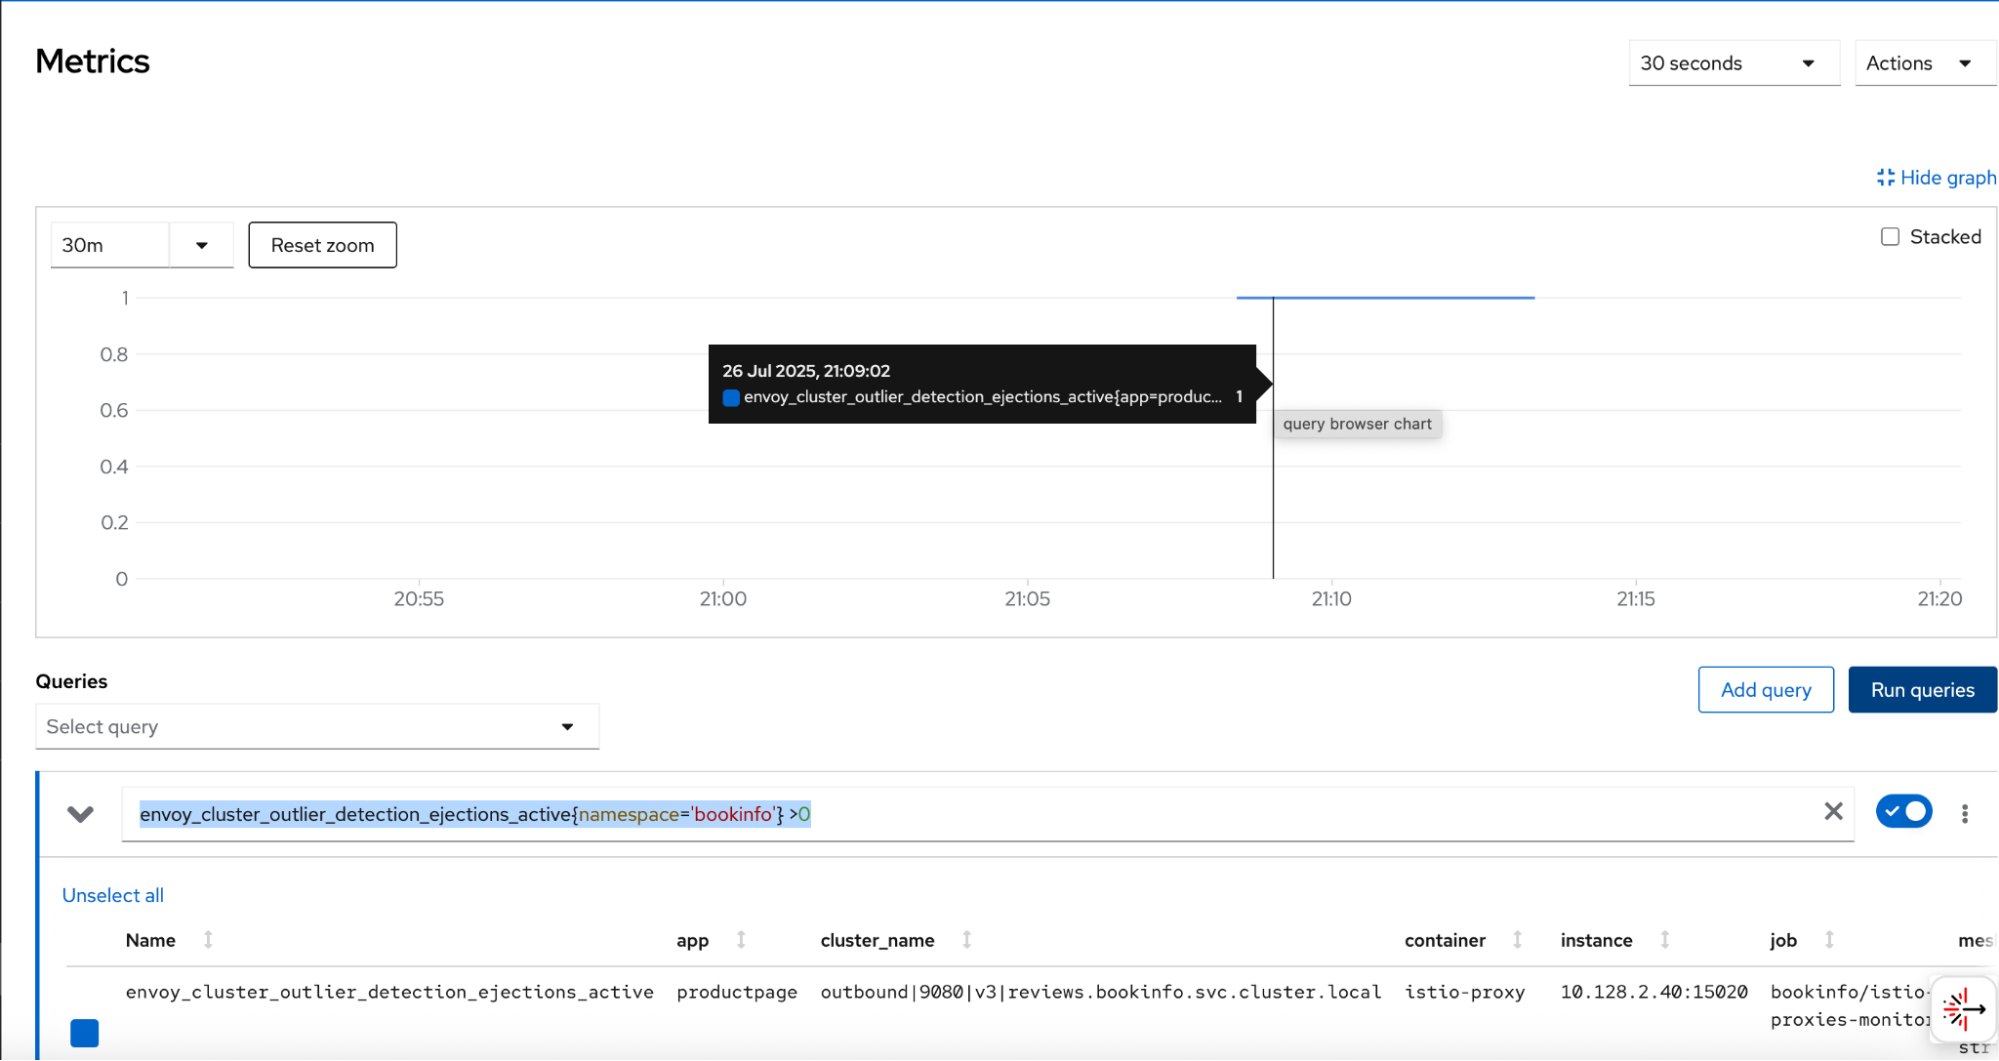
- In the Expression field of the PromQL UI, enter the following query. This query checks for the number of hosts that are currently ejected for the
reviews-v3cluster.
envoy_cluster_outlier_detection_ejections_active{namespace='bookinfo'} >0- Select Run queries.
You should see a graph where the value is 1, as shown in Figure 4. This indicates that the single instance of reviews:v3 has been ejected. The value will periodically drop to 0 for a brief moment before returning to 1 as the 300-second ejection period expires and the circuit is immediately re-tripped by the next failed request.
In the Kiali service graph, you can now see the circuit breaker in action. Traffic to the reviews service is being routed exclusively to the healthy v1 version. The path to reviews:v3 shows an open circuit breaker, and no traffic is flowing to it or its downstream ratings service. See Figure 5.
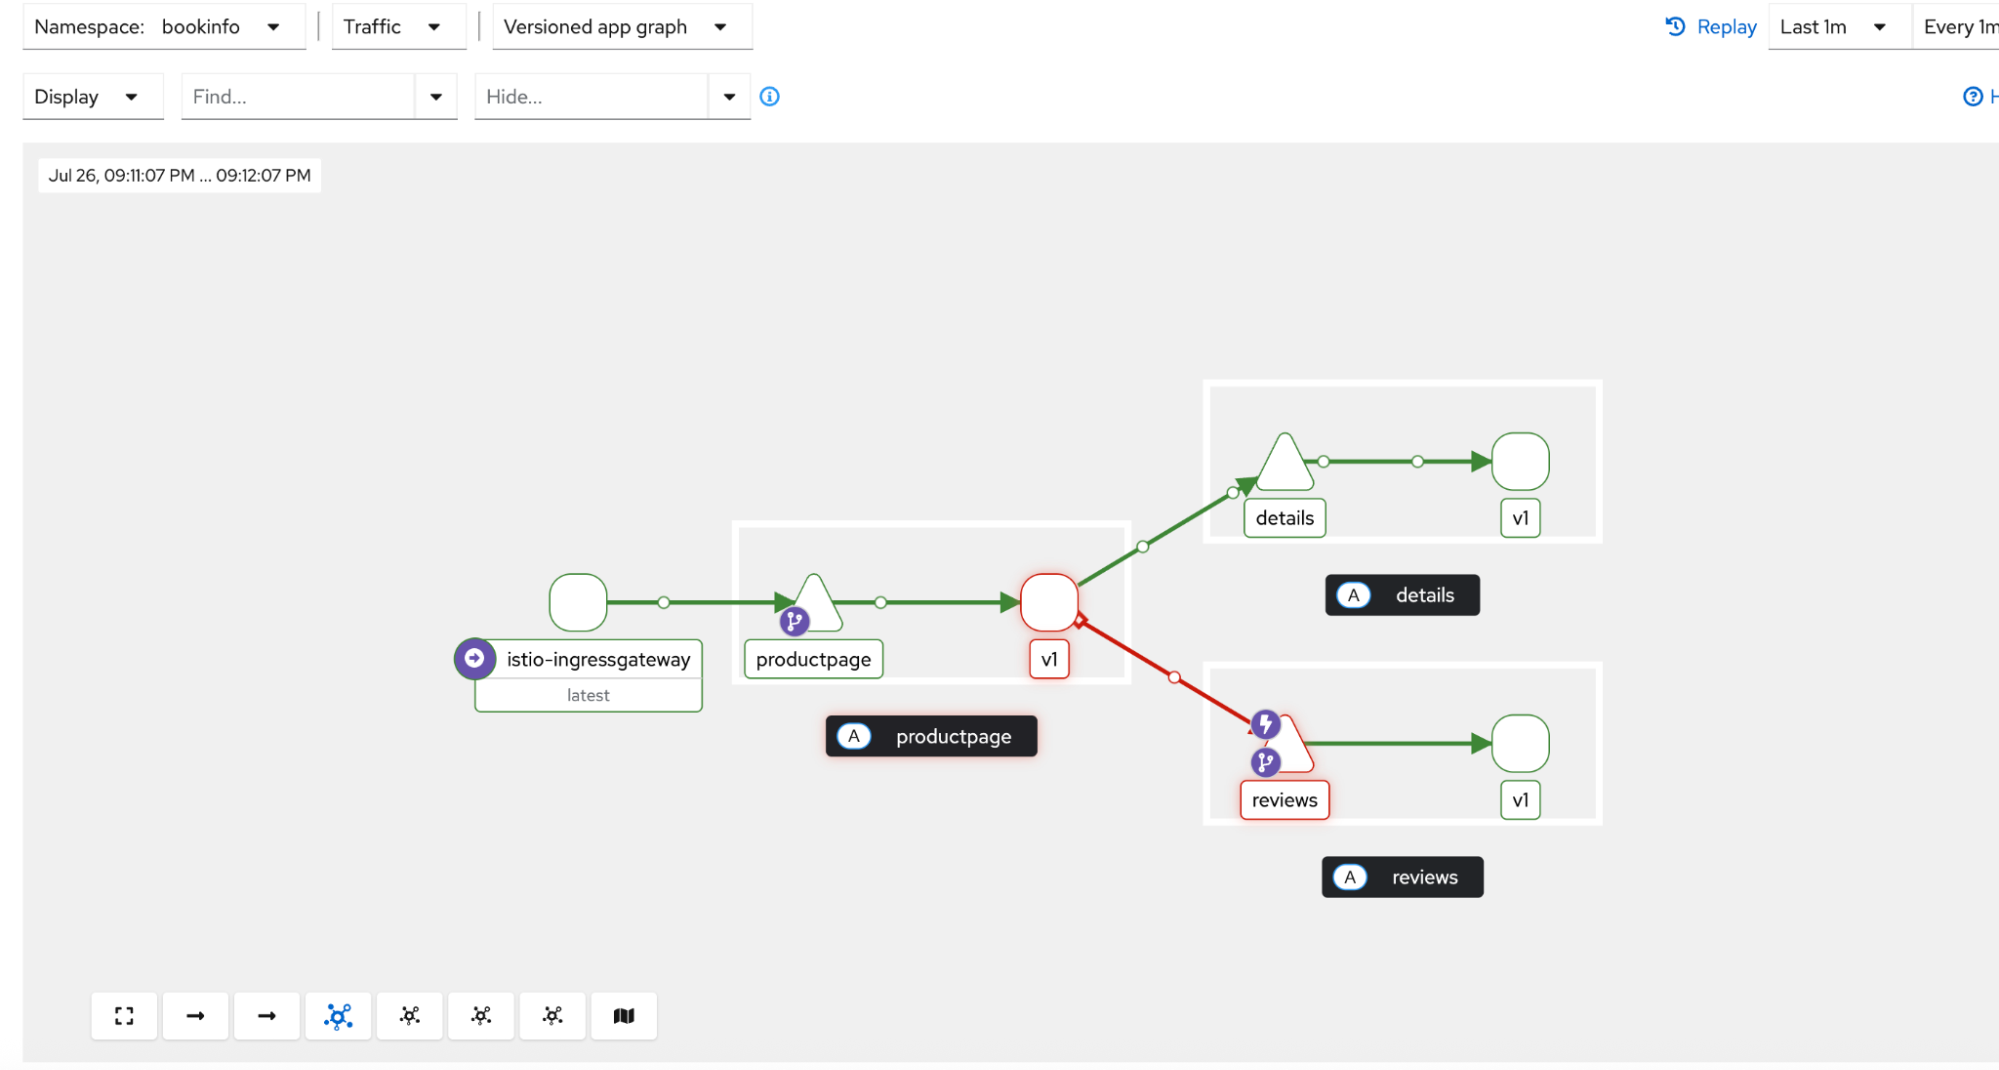
You will now observe that requests routed to the reviews:v1 service succeed without issue (Figure 6).

Any traffic intended for reviews:v3 will result in an error, as shown in Figure 7. This happens because the circuit breaker is active for its 300-second ejection period, blocking calls to the v3 pod even though it is running.

Understanding key outlier detection metrics
While ejections_active is perfect for seeing the real-time state, Envoy provides a rich set of metrics for a deeper understanding of your circuit breaker's behavior. According to the official Envoy proxy documentation, these statistics give you a more complete picture for monitoring and tuning.
Wrap up
Congratulations! You have successfully configured a circuit breaker for a microservice, simulated a failure using fault injection, and monitored the circuit's state in real-time using metrics in the OpenShift console. This powerful resilience pattern is a fundamental tool for building robust, self-healing applications with Red Hat OpenShift Service Mesh.
