Network observability 1.9 is an optional operator that provides insights into your network traffic, including features like packet drops, latencies, DNS tracking, and more. You can view this in the form of graphs, a table, or topology.
This version aligns with Red Hat OpenShift Container Platform (RHOCP) 4.19 but is backwards-compatible with older OpenShift Container Platform and Kubernetes releases. For installation instructions, check out the documentation on OpenShift Container Platform and network observability.
This article covers the new features in this release, namely IPsec tracking, flowlogs-pipeline filter query, UDN mapping, and network observability CLI enhancements. If you want to learn about the past features, read my previous What's new in network observability articles.
IPsec tracking
Network observability can identify IPsec traffic flows and indicate if they were successfully encrypted. To try this, you need to have OVN-Kubernetes as your container network interface (CNI), which is the default for RHOCP.
To enable IPsec, follow the instructions on Configuring IPsec encryption. If you didn't enable IPsec during cluster installation, it's a bit tricky to set up, so I've provided a quick guide for setting it up in a test environment.
Network observability can identify encrypted IPsec traffic between pods. In the OpenShift web console, when you create the FlowCollector instance, scroll down to the Agent configuration and open up the section named Features. In the dropdown for Value, select IPSec, as shown in Figure 1.
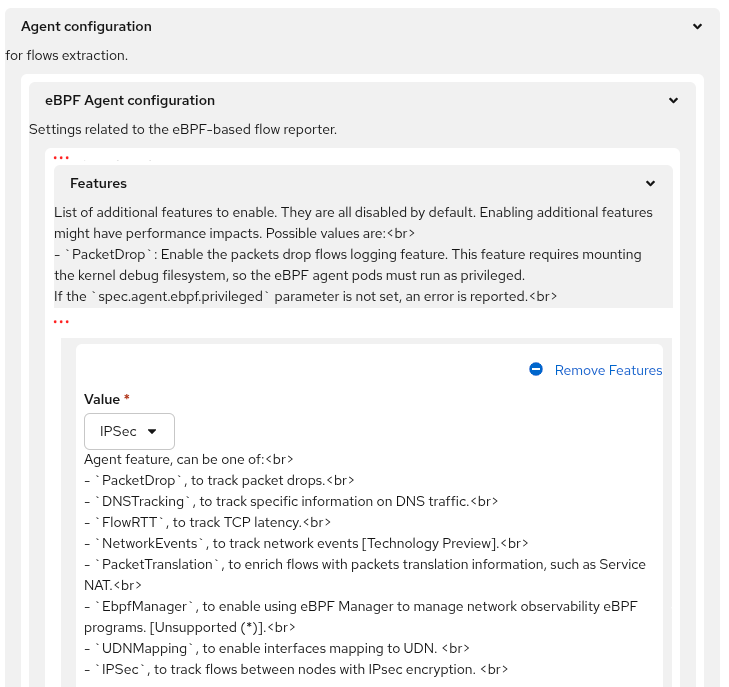
The equivalent in YAML is to add this in the spec section:
spec:
 agent:
   ebpf:
     features:
     - IPSec
Network observability: IPsec feature
In the Observe > Network Traffic, Traffic flows tab, it adds a new column IPSec Status that has the possible values of success, error, or n/a (Figure 2).
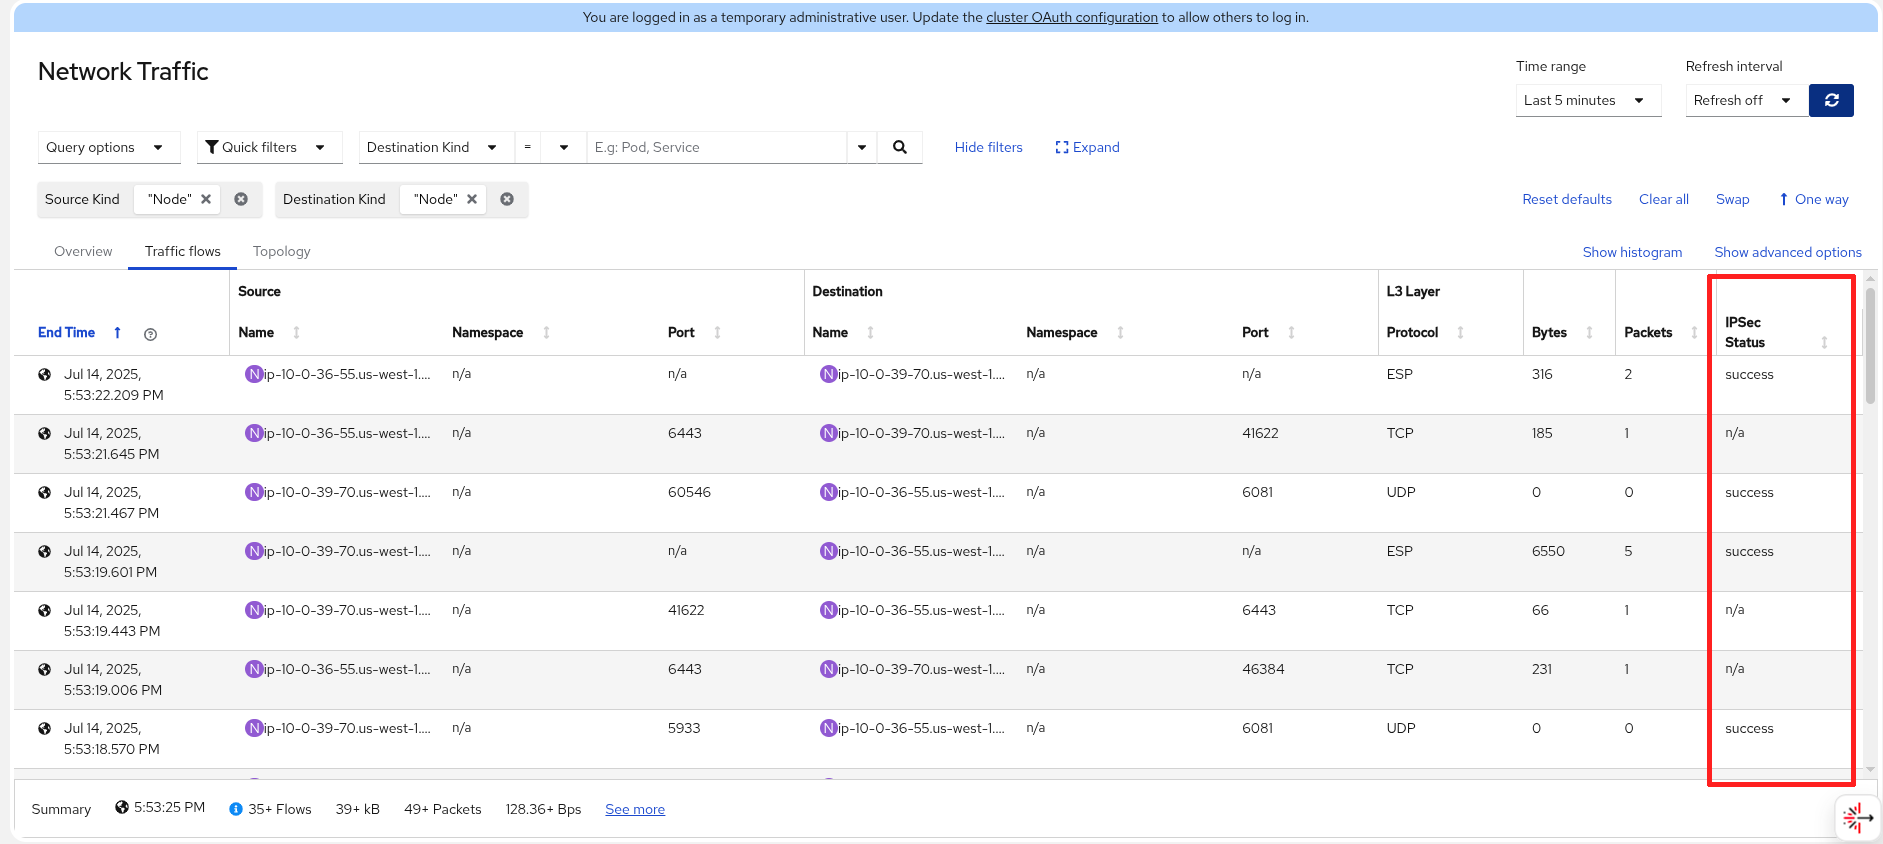
IPsec flows always appear as node-to-node traffic, but they are actually encapsulated pod-to-pod or host-to-pod traffic. There are two types of encapsulation used for IPsec-encrypted flows. The first is ESP encapsulation, which is the traditional IPsec mode. ESP packets don't have ports, hence the ports are n/a. The second is UDP encapsulation. In the table, the destination port is 6081, so they are OVN Geneve tunnel traffic. If you only see UDP encapsulated traffic (no ESP), then you must have configured encapsulation: Always when configuring IPsec.
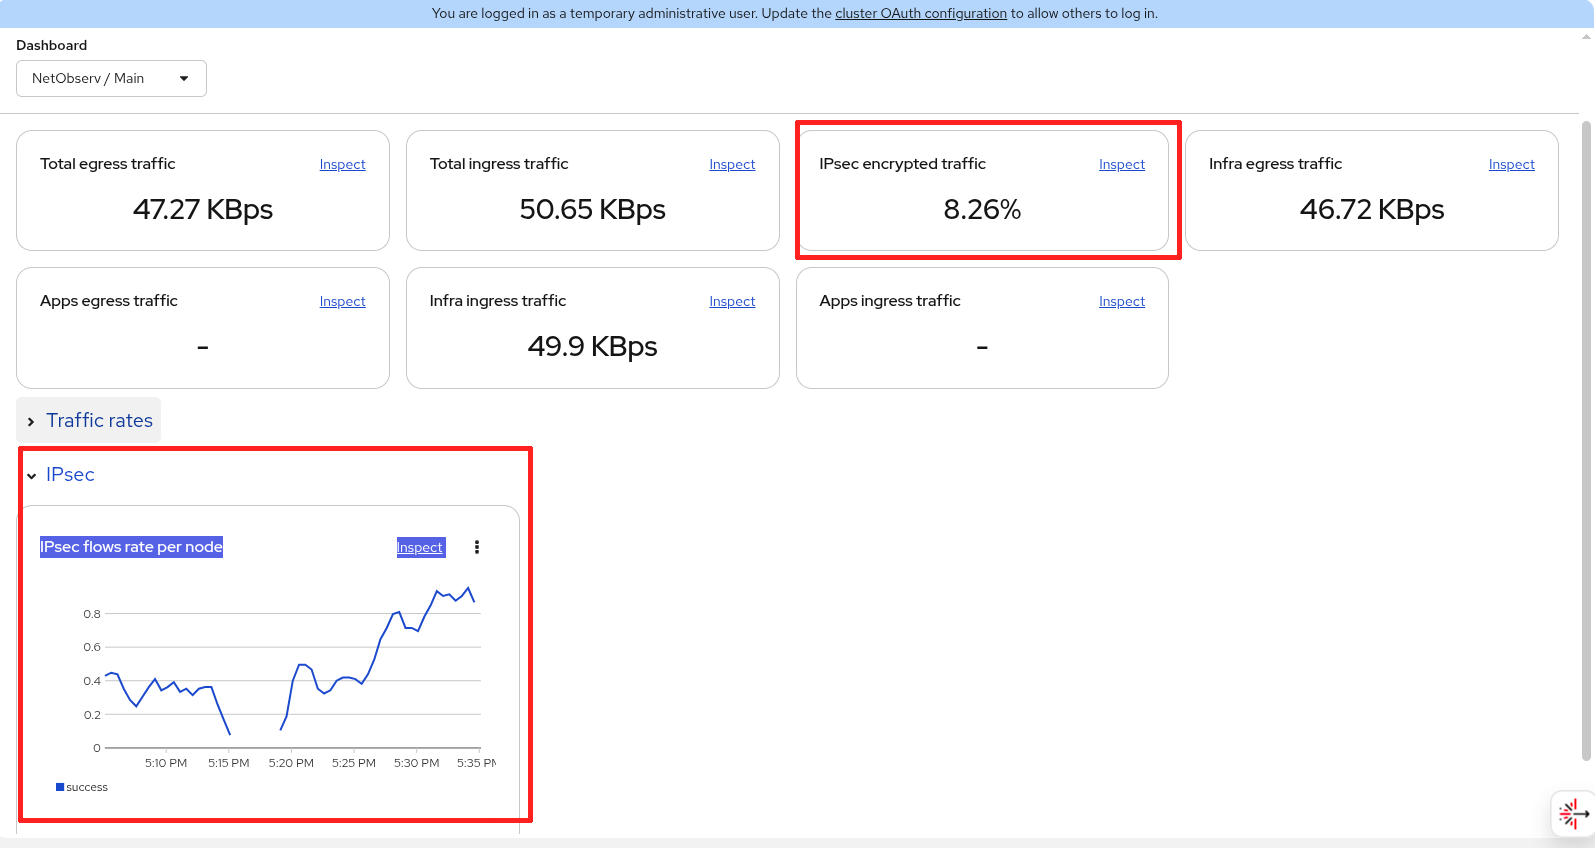
In the Observe > Dashboards, Network / Main dashboard dropdown, it shows the percentage of traffic encrypted and the IPsec traffic rate (Figure 3).
Enable IPsec on OVN-Kubernetes
The following are the steps to enable IPsec on OVN-Kubernetes. You can skip this section if you already have IPsec enabled.
In addition to enabling IPsec, you should reduce the MTU value, as this is necessary to avoid packet fragmentation and dropped connections. Enter oc edit networks.operator.openshift.io to update the configuration, but read following to get the right MTU values. The migration could take half an hour or more, so be prepared for downtime.
spec:
 defaultNetwork:
   ovnKubernetesConfig:
     gatewayConfig:
       routingViaHost: true  # change
     ipsecConfig:
       mode: Full  # change
     mtu: 8855  # update with your MTU value and below
 migration:  # add this section
   mtu:
     network:
       from: 8901
       to: 8855
     machine:
       to: 9001
Make the two changes with the comment change to enable IPsec. Reduce the network MTU by 46 bytes, which is needed by the ESP header to do IPsec encryption. My current network MTU value was 8901 (using jumbo frames) and was reduced to 8855. Therefore, the overlay packets generated by the pods won't exceed 8855 bytes, and this provides the 46-byte overhead for the ESP header. You also need to provide the machine or physical MTU on the interface even though it won't change.
To get the network MTU, enter oc get networks.operator.openshift.io -o yaml | grep mtu. To get the machine MTU, look at the following example, and issue the commands, replacing the pod name with your own.
$ oc project openshift-ovn-kubernetes
$ oc get pods
NAME                                     READY   STATUS    RESTARTS        AGE
ovnkube-control-plane-595bf6d946-9gjjb   2/2     Running   2 (4h48m ago)   5h3m
ovnkube-node-5h682                       8/8     Running   1 (4h58m ago)   4h58m
ovnkube-node-94z84                       8/8     Running   0               5h3m
$ oc rsh ovnkube-node-5h682
sh-5.1# ip link show
...
2: ens5: <BROADCAST,MULTICAST,UP,LOWER_UP> mtu 9001 qdisc mq master ovs-system state UP mode DEFAULT group default qlen 1000
   link/ether 06:a5:5a:cd:ff:6b brd ff:ff:ff:ff:ff:ff
   altname enp0s5
Look for the interface such as ensX and the mtu value. Here, it's 9001. The original network MTU was 100 bytes less at 8901 to provide overhead for the Geneve header. Now we're reducing it another 46 bytes to 8855 for the ESP header.
Now you can start the migration and IPsec enablement. During this process, you will lose connection to the cluster. It may be five minutes or longer before it automatically connects back. When it does, IPsec pods should be running.
$ oc get pods
NAME                                     READY   STATUS    RESTARTS      AGE
ovn-ipsec-containerized-jpnxr            1/1     Running   1             4m14s
ovn-ipsec-containerized-w6r9c            1/1     Running   1             4m14s
ovn-ipsec-host-27j49                     2/2     Running   2             4m14s
ovn-ipsec-host-jjb54                     2/2     Running   2             4m14s
ovnkube-control-plane-595bf6d946-9gjjb   2/2     Running   6             5h24m
ovnkube-node-dfhck                       7/8     Running   7 (16s ago)   3m32s
ovnkube-node-dtq28                       7/8     Running   8             4m11s
While the IPsec pods are up and running, the other parts of the cluster might not be ready yet, including network observability. To ensure the cluster is stable, enter oc adm wait-for-stable-cluster.
Flowlogs-pipeline filter
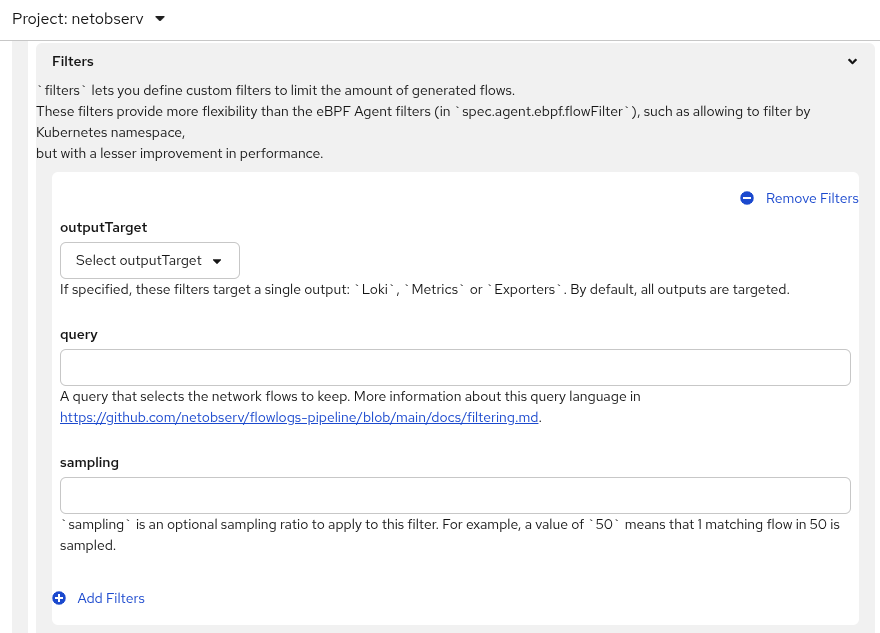
Flowlogs-pipeline filter lets you filter data after it has been enriched with Kubernetes information and before ingestion. It can filter logs (Loki data), metrics (Prometheus data), or logs to be exported, or all of them, which corresponds to the outputTarget field (Figure 4) when configuring a FlowCollector instance.
In the FlowCollector form view, scroll down to the Processor configuration section and click to open it. Then click Filters and then Add Filters. You can also set a different sampling value than the one used by the eBPF Agent.
The query uses a simple query language that supports 8 comparison operators, the 6 standard ones (=, !=, >, >=, <, <=), plus two more to match or not match a regular expression (=~, !~). It can check if a field exists or not (with(field), without(field). Finally, the query language allows and and or with parentheses to specify precedence for more complex expressions.
Don't confuse this with the eBPF flow filter, which happens at a much earlier stage at the packet level. Flowlogs-pipeline filter doesn't benefit as much from resource savings as eBPF flow filter because part of the processing of flows has already happened. To get a list of field names for the query, refer to the documentation or click a row in the Traffic flows table, and then click the Raw tab.
Here's a query to include only netobserv traffic.
SrcK8S_Namespace="netobserv" or DstK8S_Namespace="netobserv"You can find more information in the FLP filtering language.
UDN Mapping (GA)
The eBPF feature UDNMapping reached General Availability (GA). Network observability added support for the ClusterUserDefinedNetwork object. In 1.8, it only supported UserDefinedNetwork. ClusterUserDefinedNetwork allows pods in different namespaces to communicate with each other using the cluster UDN. To learn more about how to set up a UDN, read the article, User defined networks in Red Hat OpenShift Virtualization.
Network observability CLI enhancements
The network observability CLI is a command line tool based on the network observability code base. It is an oc plugin that captures, displays, and saves flows, metrics, and/or packet information.
Installation is simple. Download the oc_netobserv file and put it in a location that is accessible from the command line (e.g. /usr/local/bin on Linux). Make the file executable. You don't even need to install network observability operator, and it won't conflict with it if it's installed.
You must be able to access your cluster from the command line using oc or kubectl. It's best to widen your terminal to 100 characters or more for a better display. To run the program, enter oc netobserv or just call the script directly, oc-netobserv, followed by various options.
Decide whether you want to see flows, metrics, or capture packets. If you want more information on this, enter one or more of these commands.
oc netobserv flows help
oc netobserv metrics help
oc netobserv packets help
oc netobserv help  # for general help
With flows, it displays a text-based traffic flows table. With metrics, you are given a link that creates a dynamic dashboard in the OpenShift web console. With packets, you also get flows, and it saves a pcapng file that can be loaded in with a tool such as Wireshark. You can save all of this data locally upon exit.
Network observability CLI deploys in its own namespace and is automatically removed once the CLI exits. To manually exit, press ctrl-c. It asks if you want to save the data in the directory ./output and then exits.
The rest of this section covers the new features in network observability CLI 1.9. Tthe new options are shown in the following table:
| Option | Description |
--enable_ipsec | Enable eBPF IPsec tracking feature |
--enable_network_events | Enable eBPF Network Events feature |
--enable_udn_mapping | Enable eBPF UDN Mapping feature |
--sampling | Set sampling interval, defaults to 1 |
--query | Define a query filter |
--exclude_interfaces | List of interfaces to exclude |
--include_list | List of metric names (metrics only) |
--yaml | Generate a FlowCollector YAML |
This version catches up with all of the eBPF features that were introduced in network observability, including the latest IPsec tracking. These are the options that begin with --enable. The new --sampling option sets the sampling interval and defaults to 1; unlike the network observability operator, which defaults to 50.
The --regexes option has been removed in favor of the --query option. It allows you to enter an expression, similar to the filter UI in Observe > Network Traffic.
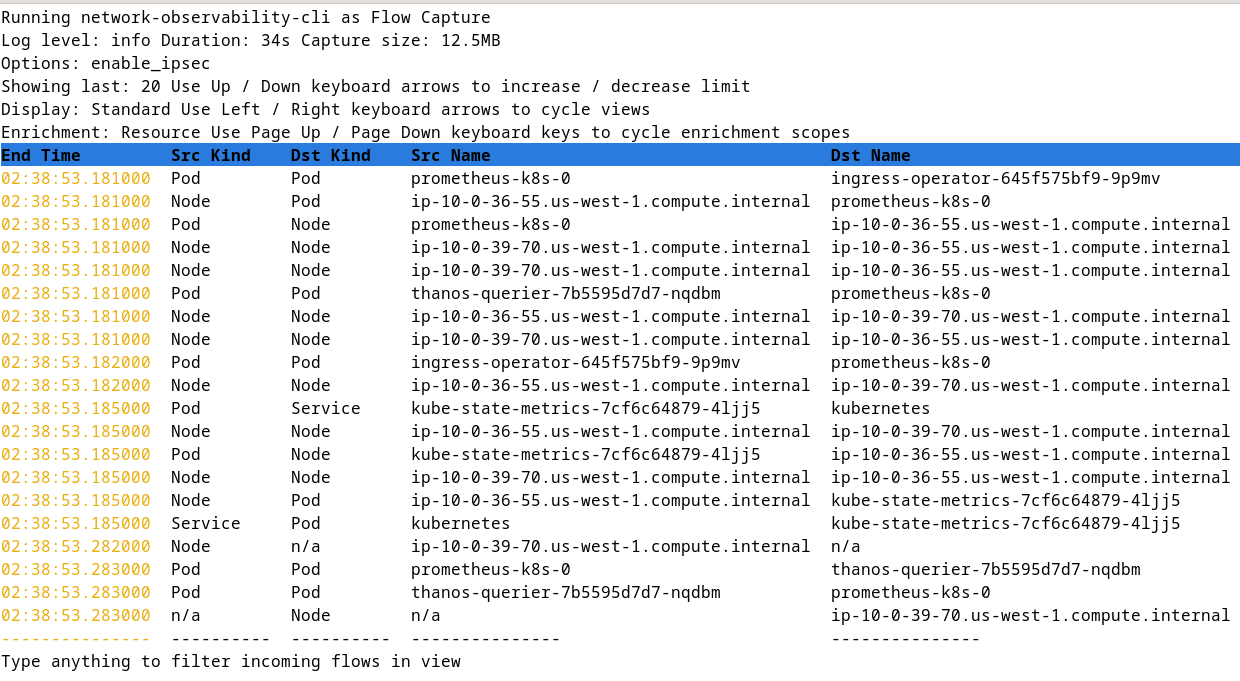
The following is an example command that enables IPsec tracking and displays flows where the IPsec encryption was successful. It uses a sampling interval of 10.
oc netobserv flows --query='IPSecStatus="success"' --enable_ipsec --sampling=10Pay attention to the syntax of --query. An equals character follows it, wrapped in a pair of single quotes. Double quotes are used if the value is a string. The field name does not have quotes. The query and the field names are the same as the flowlogs-pipeline filter query. Figure 5 shows a screenshot of this command.
The --exclude_interfaces is a list of comma-separated interfaces to exclude. The --include_list is a metrics-only option to specify a list of comma-separated metric names. See the metrics help for the default list of names.
The last new option is the unique --yaml. Add in your features and filter options after oc netobserv --yaml command. It creates a FlowCollector YAML that you can apply and reuse, and prints out the command to run. Save this command. When you run it, it starts up network observability CLI with all the options you gave it.
Here's an example of running with this option.
$ oc netobserv flows --enable_ipsec --yaml
...
You can create flows agents by executing:
oc apply -f ./output/flows_capture_2025_07_14_07_14.yml
Then create the collector using:
oc run -n netobserv-cli collector \
--image=registry.redhat.io/network-observability/network-observability-cli-rhel9:1.9.0 --image-pull-policy='Always' --overrides='{"spec": {"serviceAccount": "netobserv-cli"}}' \
--command -- bash -c "/network-observability-cli get-flows --options enable_ipsec --loglevel info --maxtime 5m --maxbytes 50000000 && sleep infinity"
And follow its progression with:
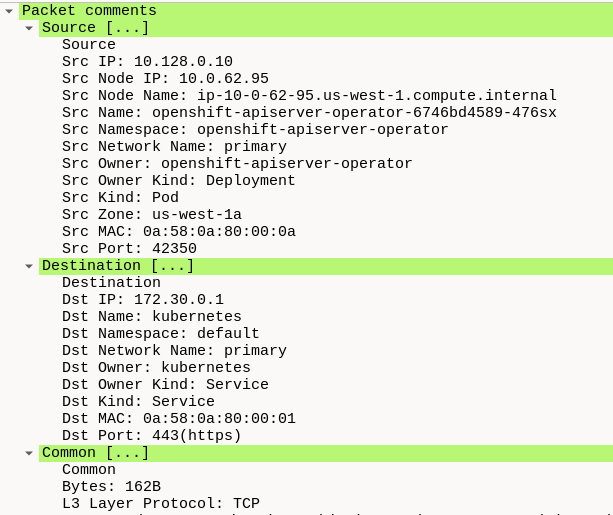
oc logs collector -n netobserv-cli -fFinally, the pcapng file was enhanced to include enrichment data as comments. The command below starts the packet capture. Upon exit, save the capture output.
oc netobserv packets --port=443Now run Wireshark on this file, which is in the ./output/pcap directory. Update with your output filename.
# Update with your output filename
wireshark output/pcap/2025-07-22T212639Z.pcapng
When Wireshark comes up, select a row and click the Packet comments section to open up this section (Figure 6).
Summary
This is another solid release from the network observability team. If you use IPsec, you can get insight into this type of traffic. A filter query was added in both flowlogs-pipeline and the network observability CLI. If you want to easily capture flows, metrics, and packets, network observability CLI is the tool for you. Write to us on the discussion board if you have any feedback or suggestions for improvements.
Special thanks to Julien Pinsonneau, Joel Takvorian, Mehul Modi, and Mohamed S. Mahmoud for their review.
Last updated: October 21, 2025