Network observability is one of the most critical and must-have components in your Kubernetes cluster. When networking stops or slows down, your productivity essentially grinds to a halt. Introducing Network Observability 1.8, which aligns with Red Hat OpenShift Container Platform 4.18. While it supports older versions of OpenShift Container Platform and any Kubernetes cluster, many of the new features require OpenShift Container Platform 4.18, and specifically, OVN-Kubernetes as your container network interface (CNI).
If you read my articles on this topic, I gave a sneak peek of developer and technology preview features. In both cases, they should not be used in production until they reach general availability (GA). I also covered only the new features. If you want an overview of everything in Network Observability, check out the Network Observability documentation.
Prerequisites
You should have installed an OpenShift Container Platform cluster (preferably 4.18) and the Network observability Operator 1.8 so you can test the new features. Install Loki using the Loki operator or a monolithic Loki (non-production) by following the instructions in the Network Observability Operator in the Red Hat OpenShift web console.
Create a FlowCollector instance and enable Loki. By default, it should be running OVN-Kubernetes. You should also have the OpenShift command-line interface (CLI) oc installed on your computer. Now let's dive in.
The Network Observability features
This release has two items in the GA category that I will cover: packet translation and eBPF resource reduction. The rest are the upcoming features that fall into the developer preview and technology preview categories.
There is also a significant change in the Network Observability CLI, which is a kubectl plug-in allowing you to use Network Observability from the command line separate from the operator. I've talked about this in the past, but it has grown with many great new features. You will be able to read all about it in a future article.
Packet translation
When a client accesses a pod through its Kubernetes service, it does a reverse proxy to the server running on a pod. In the OpenShift web console, go to Observe > Network Traffic > Traffic flows tab. The table shows two separate flows: one from the client to the service and another from the client to the pod. This makes tracing the flow fairly difficult. Figure 1 shows an Nginx server accessing another Nginx server on a different namespace.

With packet translation, a few xlate-related columns are added. The first row with the service shows the translated namespace and pod for the source and destination (Figure 2).

To enable this feature in FlowCollector, enter oc edit flowcollector and configure the following in the ebpf section:
spec:
 agent:
   ebpf:
     sampling: 1  # recommended so all flows are observed
     features:
     - PacketTranslation
To create a basic Nginx web server, enter the following commands. I created two of them, one with the namespace chiefs and another with namespace eagles:
oc new-project chiefs
oc adm policy add-scc-to-group anyuid system:authenticated
oc create deployment nginx --image=nginx
oc expose deployment/nginx --port=80 --target-port=80
oc expose svc/nginx
eBPF resource reduction
In an ideal world, observability would take zero resources. But since that's not realistic, the goal is to use the least amount of resources possible, particularly in CPU and memory usage.
The great news is that 1.8 made significant resource savings in the eBPF area. Testing showed that in the 25-node and 250-node cluster scenarios, the savings range from 40% to 57% compared to 1.7. Before you get too excited, this is eBPF only, so when you look at the overall network observability, the savings are closer to 11% to 25%, which is still impressive. Obviously, your savings will vary depending on your environment.
There were two major changes made to the eBPF agent, which is the component that collects and aggregates flows in Network Observability. The way hash maps were used and the algorithm to handle concurrency were changed to split this up into two hash maps: one for collecting and processing data and another for enriching the data with Kubernetes information. Ultimately, this approach uses less memory and CPU cycles than having a hash map per CPU.
Further savings in CPU and memory usage were achieved due to the hash map change, by doing more de-duplication in reducing the hash map key, based on 12 tuples to essentially 5. De-duplication is the process of removing copies of the same packet that the eBPF agent sees on different interfaces as it traverses through the network.
Developer and technology preview features
The rest of the features are non-GA, meaning they should not be used in a production environment. Network events is a technology preview feature and the rest are developer preview features.
- Network events for monitoring network policies
- eBPF flow filtering enhancements
- UDN observability
- eBPF manager support
Network events for monitoring network policies
With OVN-Kubernetes and network events, you can see what's happening with a packet, including why a packet was dropped or what network policy allowed or denied a packet from going through. This long-awaited feature gives you incredible insight into troubleshooting.
On OVN-Kubernetes, this is disabled by default since this is a technology preview feature, so enable it by adding the feature gate named OVNObservability. On the command line, enter oc edit featuregate and change the spec section to:
spec:
 featureSet: CustomNoUpgrade
 customNoUpgrade:
   enabled:
     - OVNObservability
It can take upwards of 10 minutes for this to take effect, so be patient. Initially, it might seem like nothing has happened, but after about five minutes, you will lose connection to your cluster because OVN-Kubernetes has to restart. Then after another five minutes, everything should be back online.
To enable this feature in FlowCollector, enter oc edit flowcollector and configure the following in the ebpf section:
spec:
 agent:
   ebpf:
     sampling: 1  # recommended so all flows are observed
     privileged: true
     features:
     - NetworkEvents
A packet could be dropped for many reasons, but oftentimes, it's due to a network policy. In OpenShift Container Platform, there are three different types of network policies. Network events supports all three.
Click the links to learn how to configure them:
- Kubernetes network policy: Similar to a firewall rule, typically based on an IP address, port, and protocol.
- Admin network policy: Allows cluster admin to create policies that are at the cluster level.
- Egress firewall: Controls what external hosts a pod can connect to.
In Figure 3, the traffic flows table shows a column for network events. The first row shows a drop from a network policy, and the second row allowed the packet in an admin network policy.

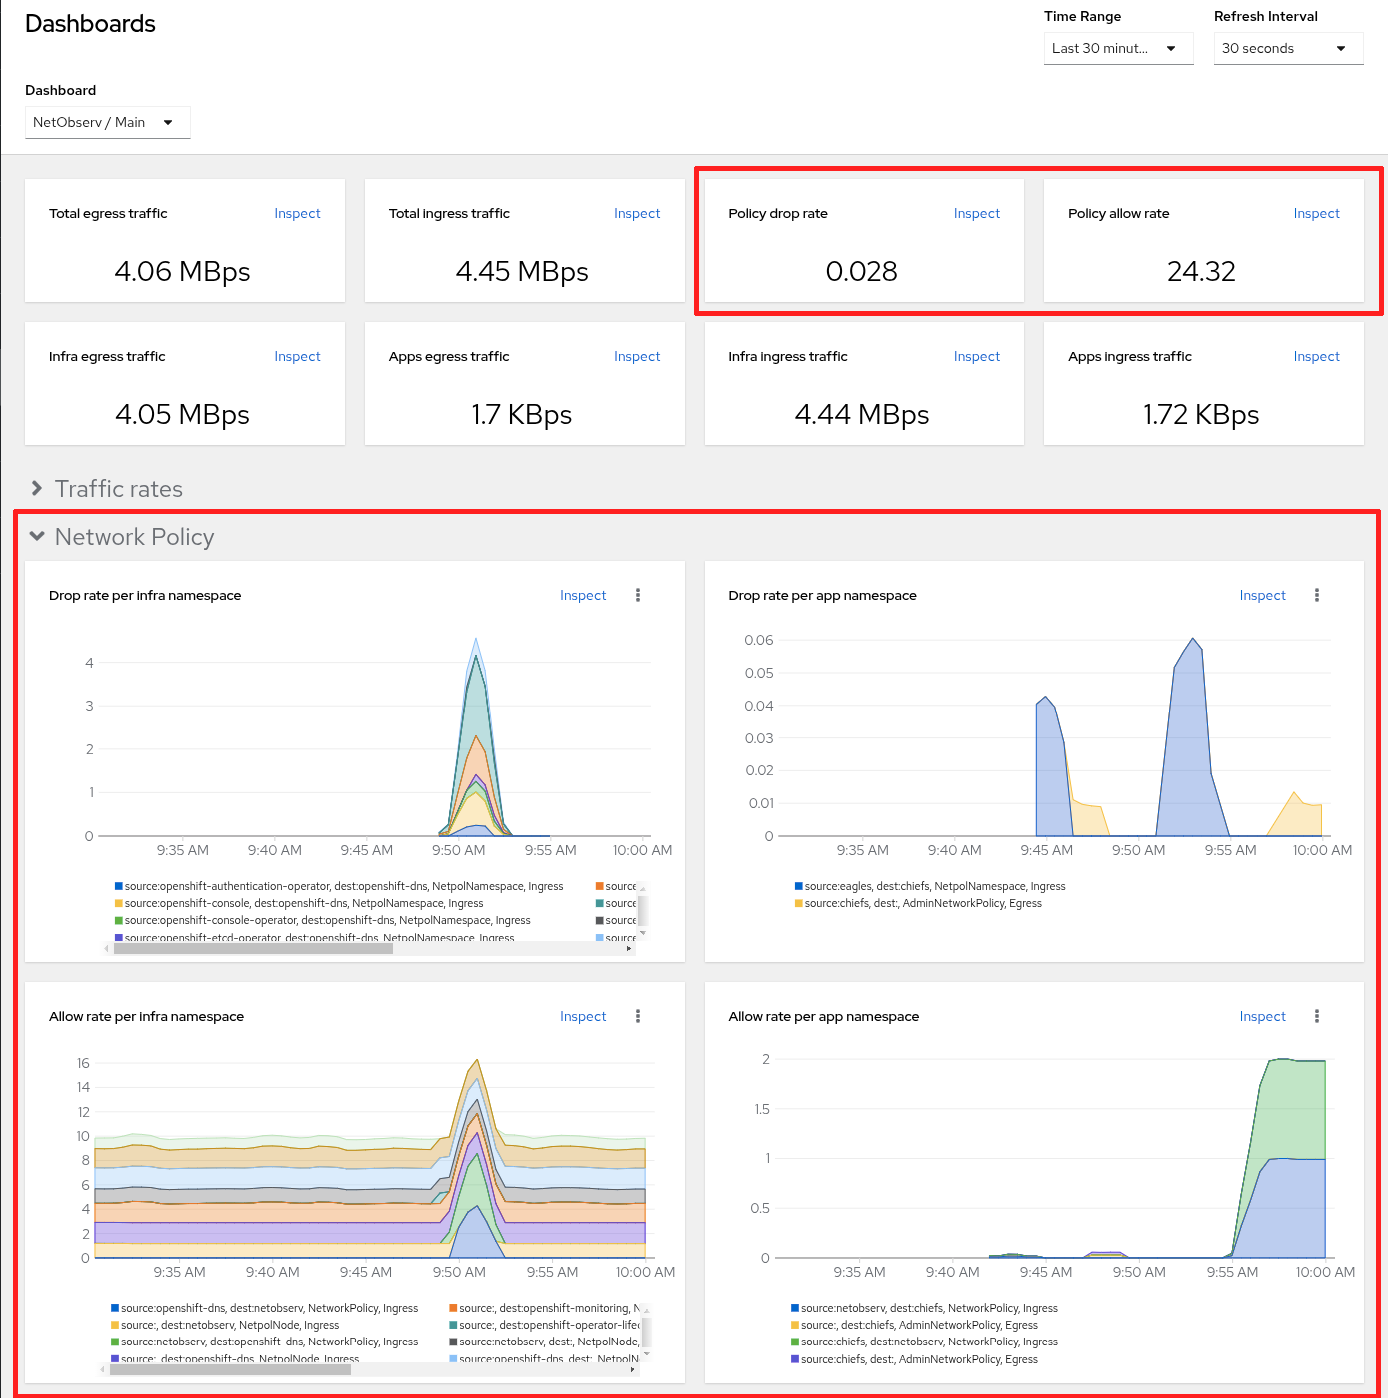
There are also network policy dashboards in Observe > Dashboards. Select NetObserv / Main from the Dashboard dropdown as shown in Figure 4.

For more detailed information on network events, read the article, Monitor OVN networking events using Network Observability.
eBPF flow filter enhancements
The eBPF flow filter was first introduced in Network Observability 1.6. You can decide what you want to observe at the initial collector stage, so you can minimize the resources used by observability. This release comes with the following enhancements.
More flow filter rules
Instead of one filter rule, you can now have up to sixteen rules, thus removing a major limitation of this feature. The rule that is matched is based on the most specific classless inter-domain routing (CIDR) match. That is, the one with the longest prefix. Hence, no two rules can have the same CIDR. After that, if the rest of the rule is matched, the action, accept or reject, is taken. If the rest of the rule is not matched, it is simply rejected. It does not attempt to match another rule.
For example, suppose there is a rule with CIDR 10.0.0.0/16 and another with 10.0.1.0/24. If the address is 10.0.1.128, it would match the second rule, because that's more specific (24-bit prefix vs.16-bit prefix). Suppose the second rule also has tcpFlags: SYN and action: Accept. Then, if it's a SYN packet, it's accepted. Otherwise it's rejected, and it doesn't attempt to apply the first rule.
Peer CIDR
The peerCIDR command is a new option that specifies the address on the server side, which is the destination when you make a request and the source when it makes a response. There still exists a peerIP that can only specify a host. However, with peerCIDR, you can simply use it to specify a host (/32) or a subnetwork.
In summary, use cidr for the client side address and peerCIDR for the server side address.
Sampling rate per rule
Each rule can have its own sampling rate. For example, you might want the eBPF agent to sample all external traffic on source and destination, but for internal traffic, it's sufficient to sample at 50. The following code block shows how this can be done, assuming the default IP settings of 10.128.0.0/14 for pods and 172.30.0.0/16 for services:
spec:
 agent:
   type: eBPF
   ebpf:
     flowFilter:
       enable: true
       rules:
         - action: Accept
           cidr: 10.128.0.0/14      # pod
           peerCIDR: 10.128.0.0/14  # pod
           sampling: 50
         - action: Accept
           cidr: 10.128.0.0/14      # pod
           peerCIDR: 172.30.0.0/16  # service
           sampling: 50
         - action: Accept
           cidr: 0.0.0.0/0
           sampling: 1
The last rule with CIDR 0.0.0.0/0 is necessary to explicitly tell it to process the rest of the packets. This is because once you define a flow filter rule, the default behavior of using the FlowCollector's sampling value to determine what packets to process no longer applies. It will simply use the flow filter rules on what to accept or reject and reject the rest by default. If sampling is not specified in a rule, it uses the FlowFilter's sampling value.
Include packet drops
Another new option is packet drops. With pktDrops: true and action: Accept, it includes the packet only if it's dropped. The prerequisite is that the eBPF feature, PacketDrop, is enabled, which requires eBPF to be in privileged mode. Note that this currently is not supported if you enable the NetworkEvent feature. The following is an example configuration:
spec:
 agent:
   type: eBPF
   ebpf:
     privileged: true
     features:
       - PacketDrop
     flowFilter:
       enable: true
       rules:
         - action: Accept
           cidr: 10.1.0.0/16
           sampling: 1
           pktDrops: true
UDN observability
Kubernetes networking consists of a flat Layer 3 network and a single IP address space where every pod can communicate with any other pod. In a number of use cases, this is undesirable. OVN-Kubernetes provides another model called user-defined networks (UDN). It supports microsegmentation where each network segment, which could be Layer 2 or Layer 3, is isolated from one another. Support for UDN in Network Observability includes changes in the flow table and topology.
To enable this feature in FlowCollector, enter oc edit flowcollector and configure the following in the ebpf section:
spec:
 agent:
   ebpf:
     sampling: 1  # recommended so all flows are observed
     privileged: true
     features:
     - UDNMapping
Let's create a user-defined network based on a namespace as follows:
apiVersion: v1
kind: Namespace
metadata:
 name: 49ers
 labels:
   k8s.ovn.org/primary-user-defined-network: ""
This creates a new namespace with the k8s.ovn.org/primary-user-defined-network label set to an empty string. A new namespace has to be created, because it is not allowed to add certain labels like this to an existing namespace.
You can use oc apply with the content in the previous code block, or copy and paste this into the OpenShift web console. To do the latter, click the + icon in the upper right corner next to the ? icon, and select Import YAML. Paste the YAML in and click Create.
Now create a UserDefinedNetwork instance. Again, use oc apply or paste it into the OpenShift web console:
apiVersion: k8s.ovn.org/v1
kind: UserDefinedNetwork
metadata:
 name: udn-49ers
 namespace: 49ers
spec:
 topology: Layer2
 layer2:
   role: Primary
   subnets:
     - "10.0.0.0/24"
Now if you add a pod into this namespace, it will automatically have a secondary interface that is part of the UDN. You can confirm this by entering the commands into the following:
oc project 49ers
pod=$(oc get --no-headers pods | awk '{print $1;}') # get pod name
oc describe pod/$pod  # should see two interfaces mentioned in Annotations
All pods in this namespace are isolated from pods in other namespaces. In essence, a namespace can be a tenant. The UDN feature also has a ClusterUserDefinedNetwork resource that allows a UDN to span across multiple namespaces.
In Network Observability, the traffic flow table has a UDN labels column (Figure 5). You can filter on the Source Network Name and Destination Network Name.

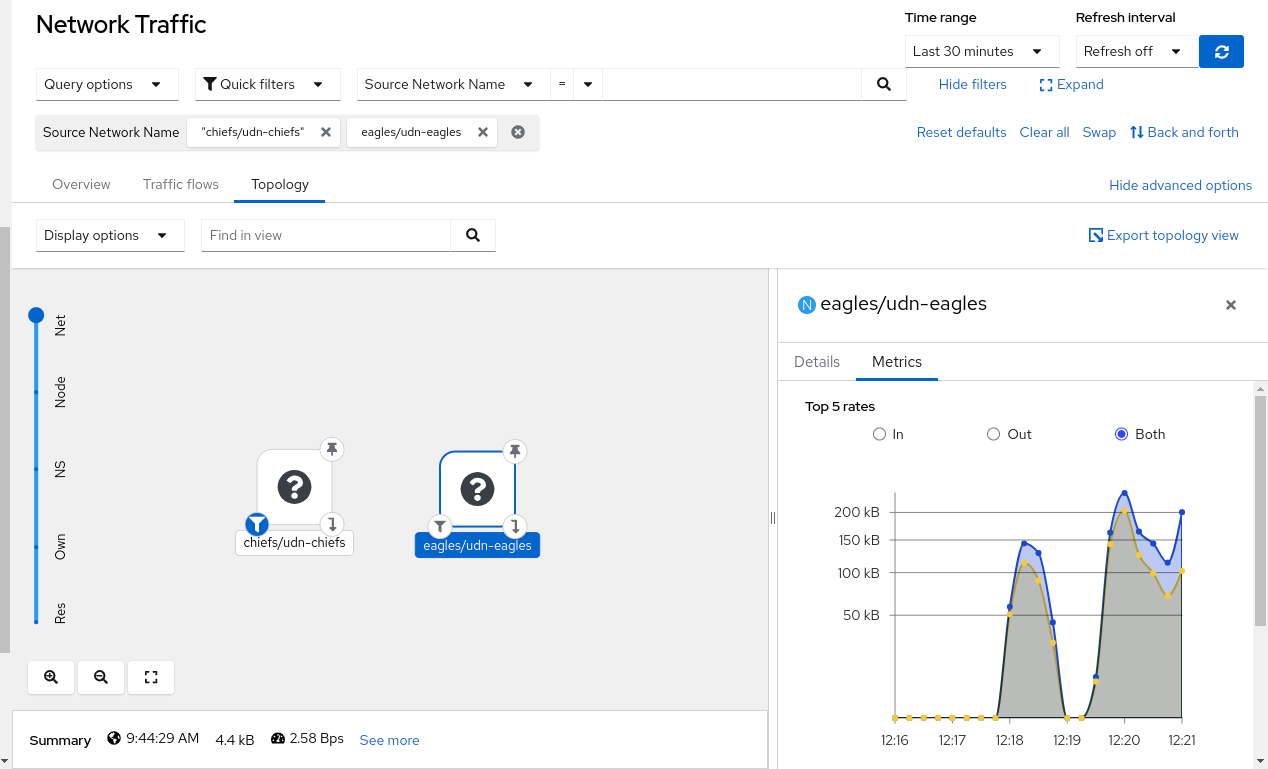
In the Topology tab, there is a new top-level scope called Net (Network). This shows all of your secondary networks. Figure 6 shows two UDNs.

eBPF manager support
With the proliferation of eBPF programs in networking, monitoring, tracing, and security, there is potential for conflicts in the use of the same eBPF hooks. The eBPF manager is a separate operator that manages all eBPF programs, thereby reducing the attack surface and ensuring compliance, security, and preventing conflicts. Network Observability can leverage eBPF manager and let it handle the loading of hooks. This ultimately eliminates the need to provide the eBPF agent with privileged mode or additional Linux capabilities, such as CAP_BPF and CAP_PERFMON. Since this is a developer preview feature, privileged mode is still required for now, and it is only supported on the amd64 architecture.
First, install the eBPF manager operator from Operators > OperatorHub. This deploys the bpfman daemon and installs the security profiles operator. Check Workloads > Pods in the bpfman namespace to make sure they are all up and running.
Then, install Network Observability and configure the FlowCollector resource as shown in the following block. Because this is a developer preview feature, delete the FlowCollector instance if you already have one and create a new instance, rather than edit an existing one.
spec:
 agent:
   ebpf:
     privileged: true  # required for now
     interfaces:
       - br-ex
     features:
       - eBPFManager
It must specify an interface, such as br-ex, which is the OVS external bridge interface. This lets eBPF Manager know where to attach the TCx hook. Normally, the interfaces are auto-discovered, so if you don't specify all the interfaces, it won't get all the flows. This is a work in progress.
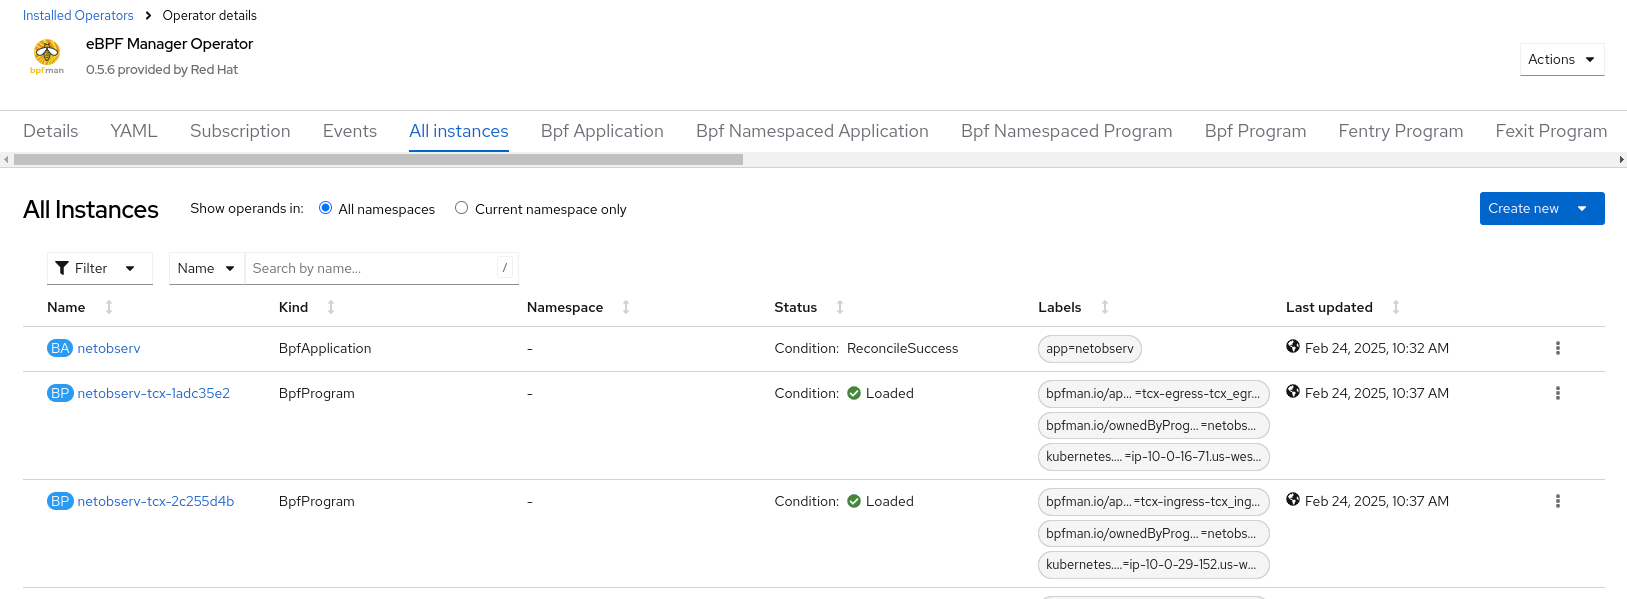
To verify that this is working, go to Operators > Installed Operators. Click eBPF Manager Operator and then the All instances tab. There should a BpfApplication named netobserv and a pair of BpfPrograms for each node: one for TCx ingress and the other for TCx egress. There might be more if you enable other eBPF agent features (see Figure 7).

Network Observability enhances security and more
Network Observability 1.8 is another feature-rich release that works hand-in-hand with OVN-Kubernetes. Getting insight into how packets are translated when accessing a pod through a service and knowing where a packet is dropped will be immensely helpful in troubleshooting. Support for microsegmentation via UDNs will improve security and management.
Network Observability continues to provide flexibility in deciding what you want to observe so that you can minimize the resources used. This comes in addition to the internal optimizations that we've made in this release.
While many of the features are in developer preview, this gives you a chance to try these out and give us feedback before it becomes generally available. You can comment on the discussion board.
Special thanks to Joel Takvorian, Mohamed S. Mahmoud, Julien Pinsonneau, Mike Fiedler, Sara Thomas, and Mehul Modi for reviewing.
Last updated: May 14, 2025