Incident detection groups the cascade of related alerts that occur during system issues (alert storms) into manageable incidents. This helps teams identify root causes more effectively and prioritize critical problems by providing a color-coded timeline and categorizing alerts by severity and affected components, rather than getting overwhelmed by individual notifications.
To address this challenge, the incident detection feature, currently a technology preview for Red Hat OpenShift with the Cluster Observability Operator, allows users to navigate between incidents and related alerts within a single cluster. Utilizing this feature requires installing and correctly configuring the Cluster Observability Operator on each cluster. This can be tedious when you manage multiple clusters, but luckily the Red Hat Advanced Cluster Management for Kubernetes is here to help.
Red Hat Advanced Cluster Management for Kubernetes 2.14 introduces a development preview of the incident detection feature, enabling the deployment of the Cluster Observability Operator across all managed clusters.
Installing the Incidents overview in the Advanced Cluster Management Hub cluster
The installation is implemented in multicluster-observability-addon, which is managed by the MultiClusterObservability custom resource. This add-on relies on several CustomResourceDefinitions that must be present in the Hub cluster. Currently, these CRDs require manual installation, a process that will be automated or addressed differently in future releases.
To manually install of the CRDs, you can perform the following steps (note you will need kubectl, Git, and curl to be available in your system):
Clone the
multicluster-observability-addonrepository:git clone git@github.com:stolostron/multicluster-observability-addon.git- Log in to the Hub cluster.
Install the CRDs with:
make install-crds
You can now enable incident detection by updating the MultiClusterObservability custom resource, which installs the Cluster Observability Operator on spoke clusters. You can update it in the UI using the OpenShift Container Platform web console (Figure 1).
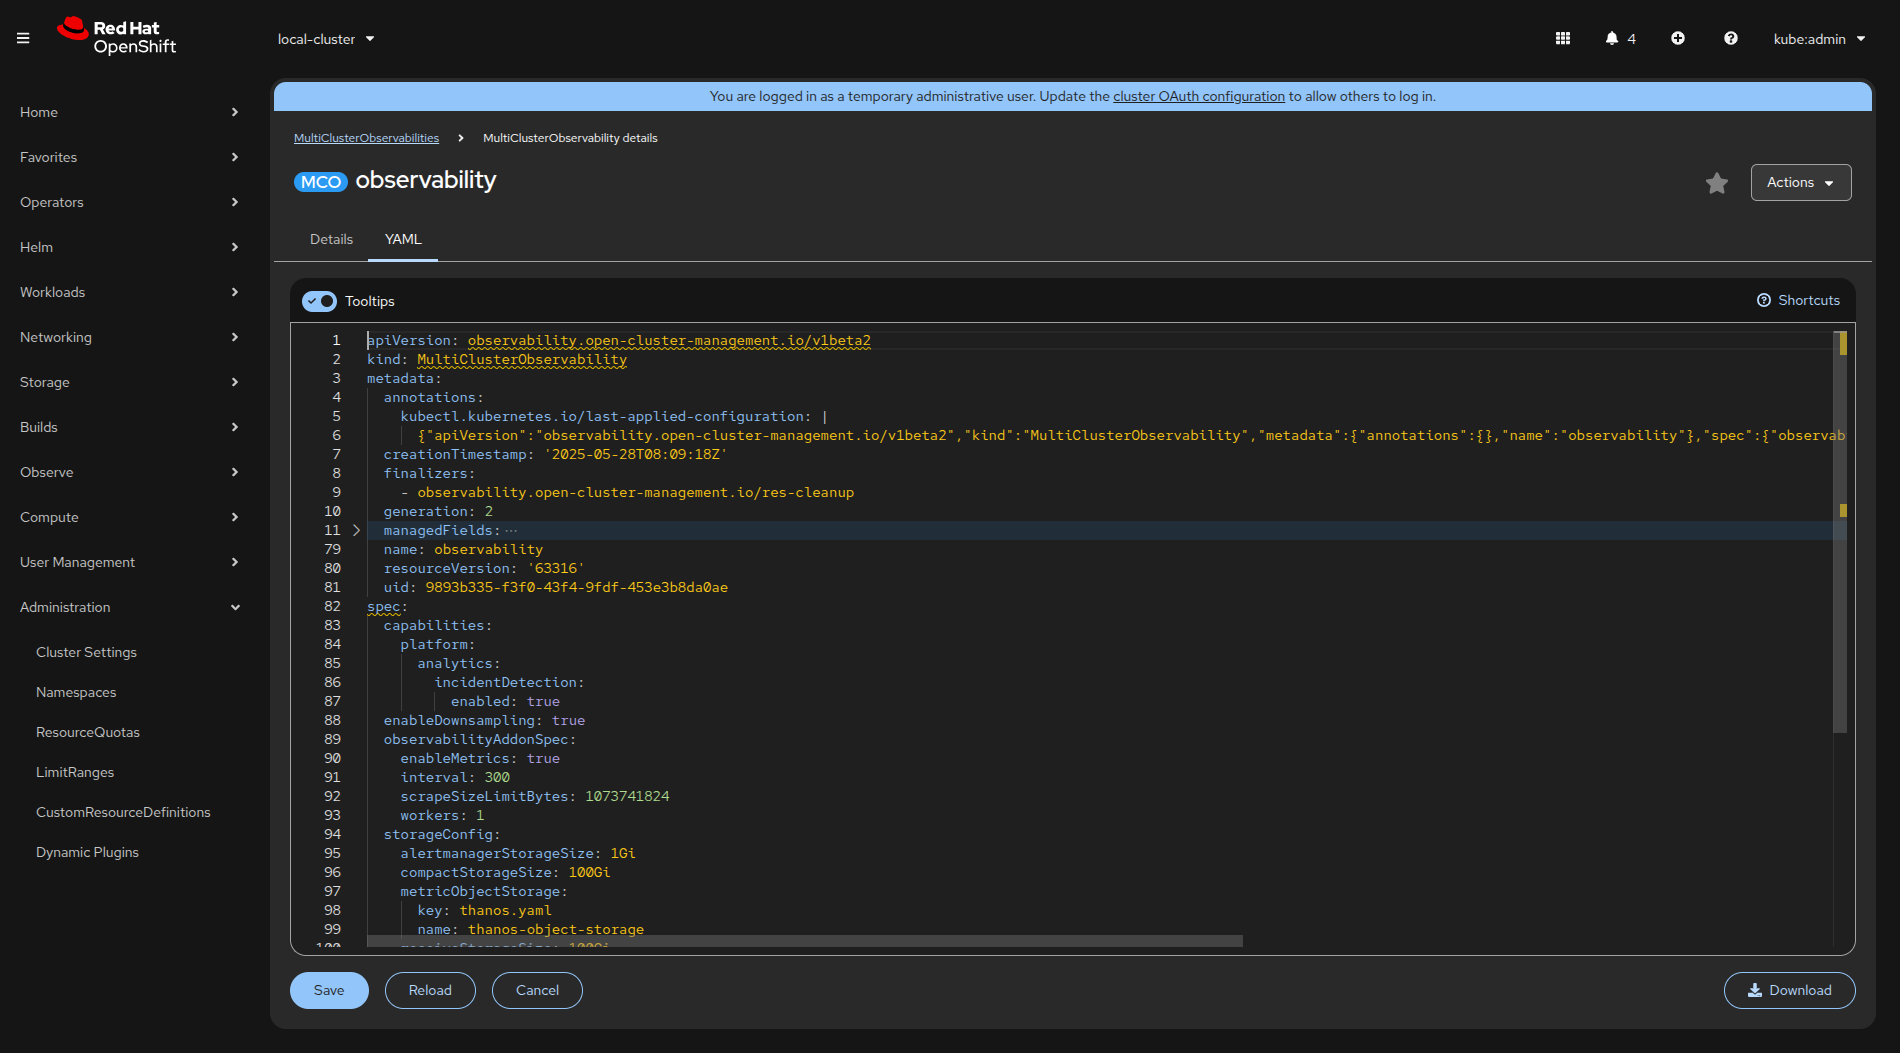
The crucial YAML configuration is the following part (as mentioned in the dev preview docs):
 capabilities:
    platform:
      analytics:
        incidentDetection:
          enabled: true
Alternatively, you can patch the custom resource by using the OpenShift client:
oc patch multiclusterobservabilities.observability.open-cluster-management.io observability --type=merge -p '{"spec":{"capabilities":{"platform":{"analytics":{"incidentDetection":{"enabled":true}}}}}}'This creates the multicluster-observability-addon-manager Pod in the open-cluster-management-observability namespace, and the Cluster Observability Operator is installed to the spoke clusters as well as to the Hub cluster, as shown in Figure 2.
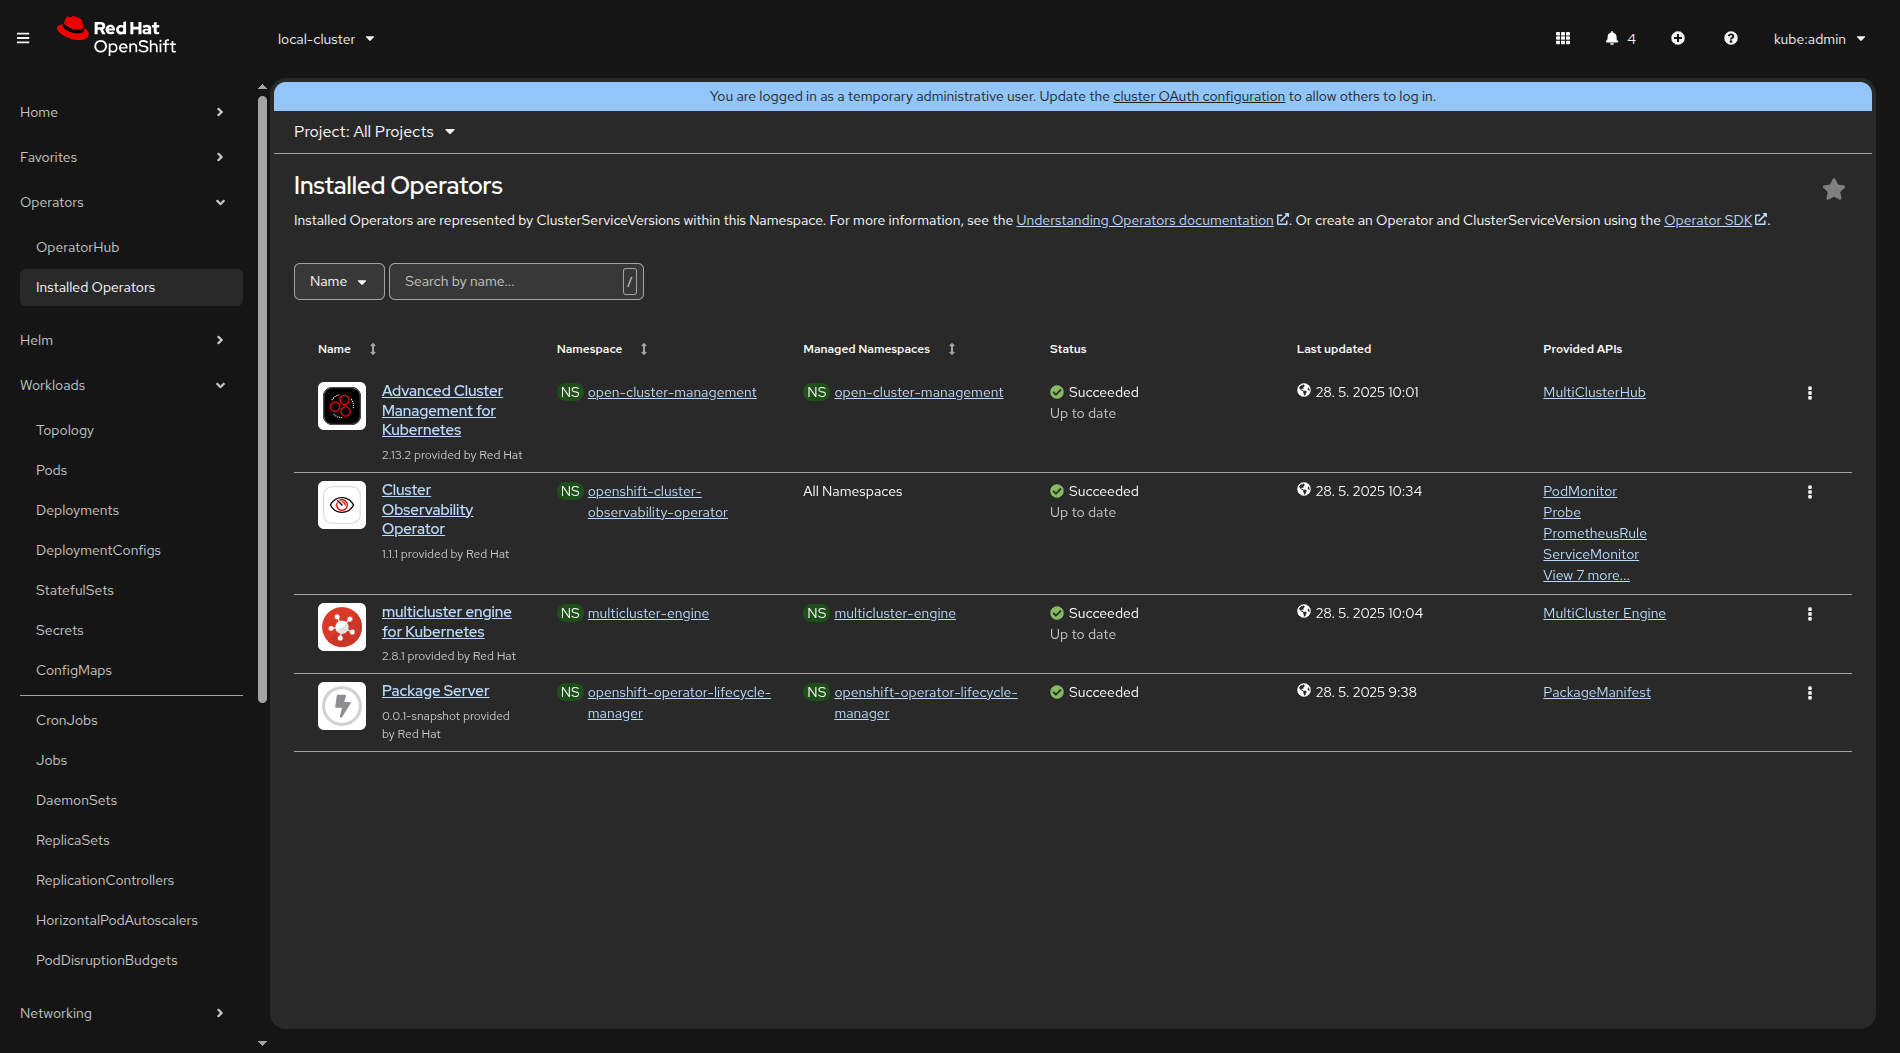
Having the Cluster Observability Operator already installed on some spoke clusters leads to the issue with two OperatorGroup resources (tracked in COO-973). To resolve this, delete one of the OperatorGroup resources.
Incidents overview in the Advanced Cluster Management Grafana
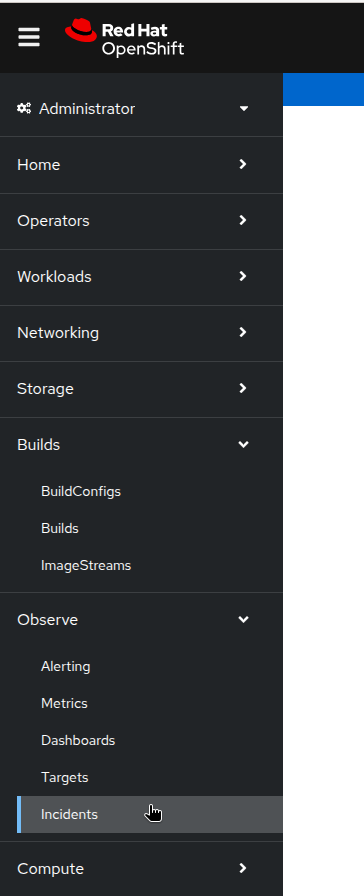
Once the Cluster Observability Operator has been successfully installed, a new Incidents menu item will appear under the Observe menu on the left (Figure 3).
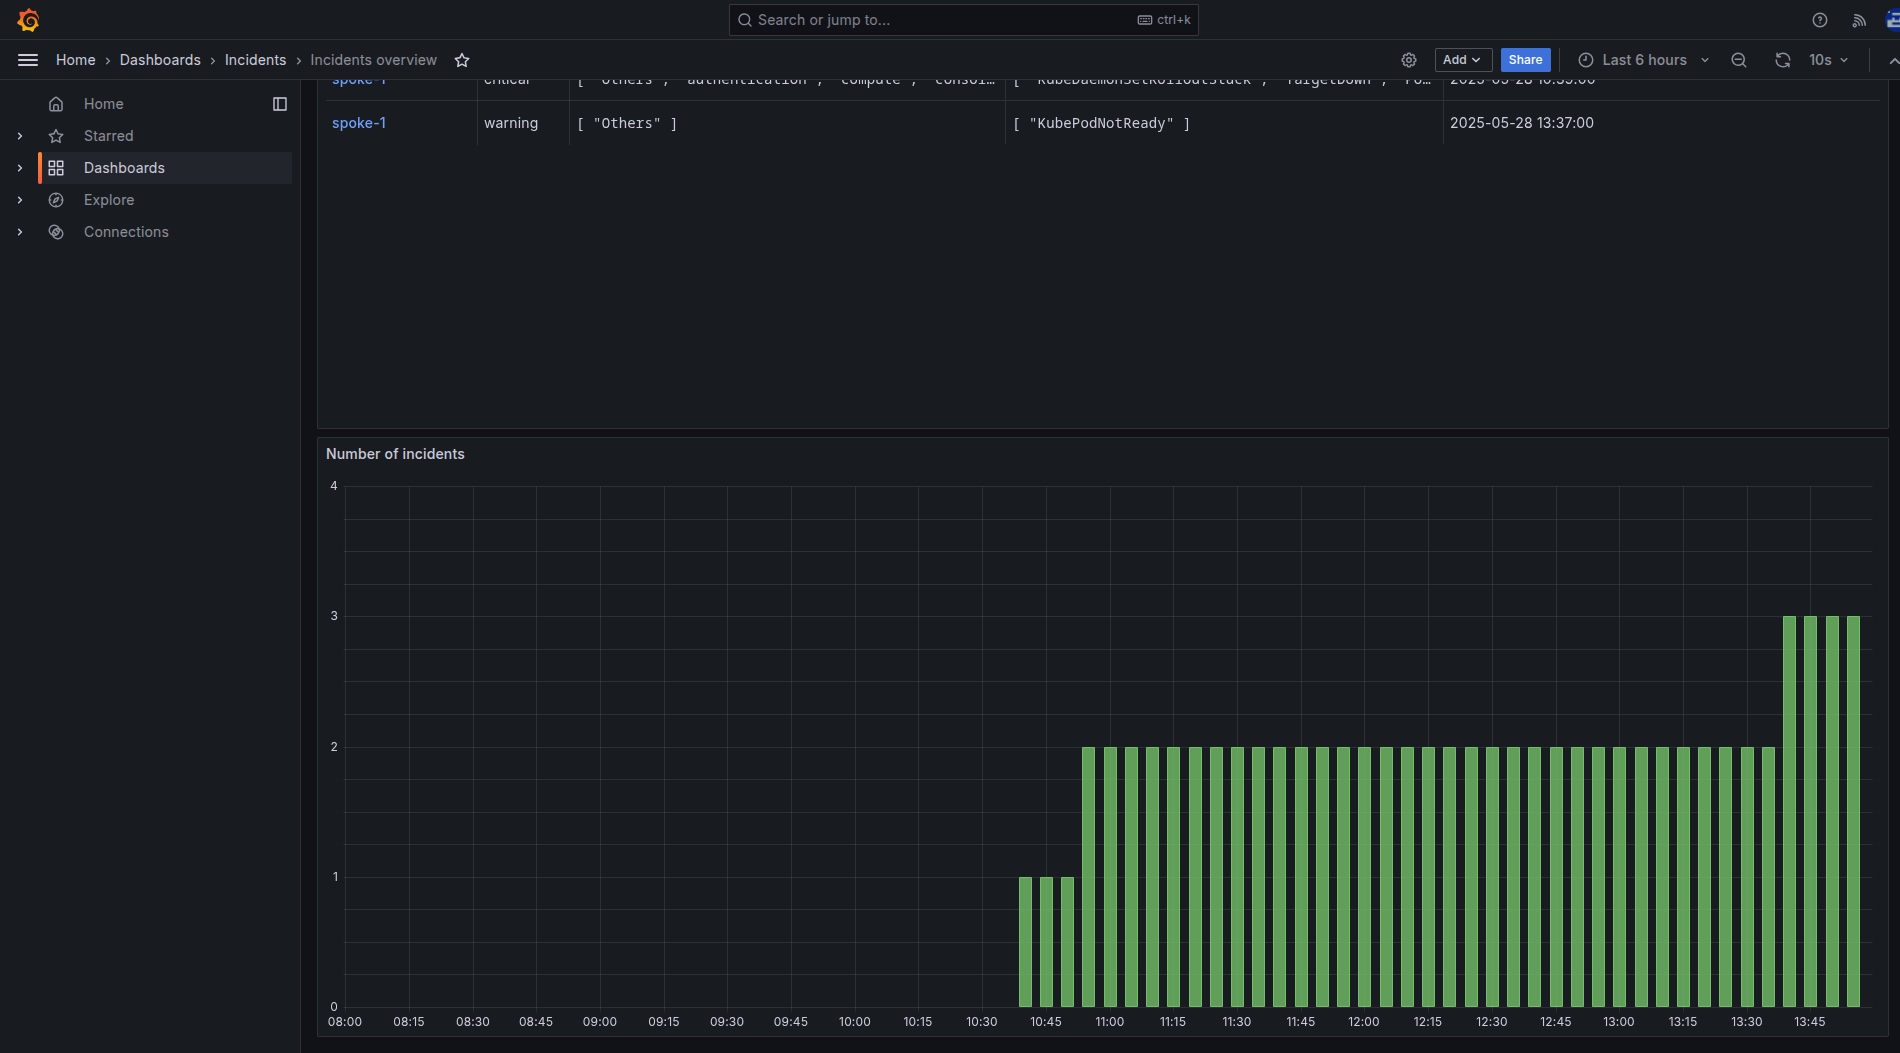
More importantly, the required Prometheus metrics will be forwarded to the Advanced Cluster Management Thanos instance and you can review the Incidents overview in the RHACM Grafana instance in the Dashboards → Incidents → Incidents Overview. See Figure 4.
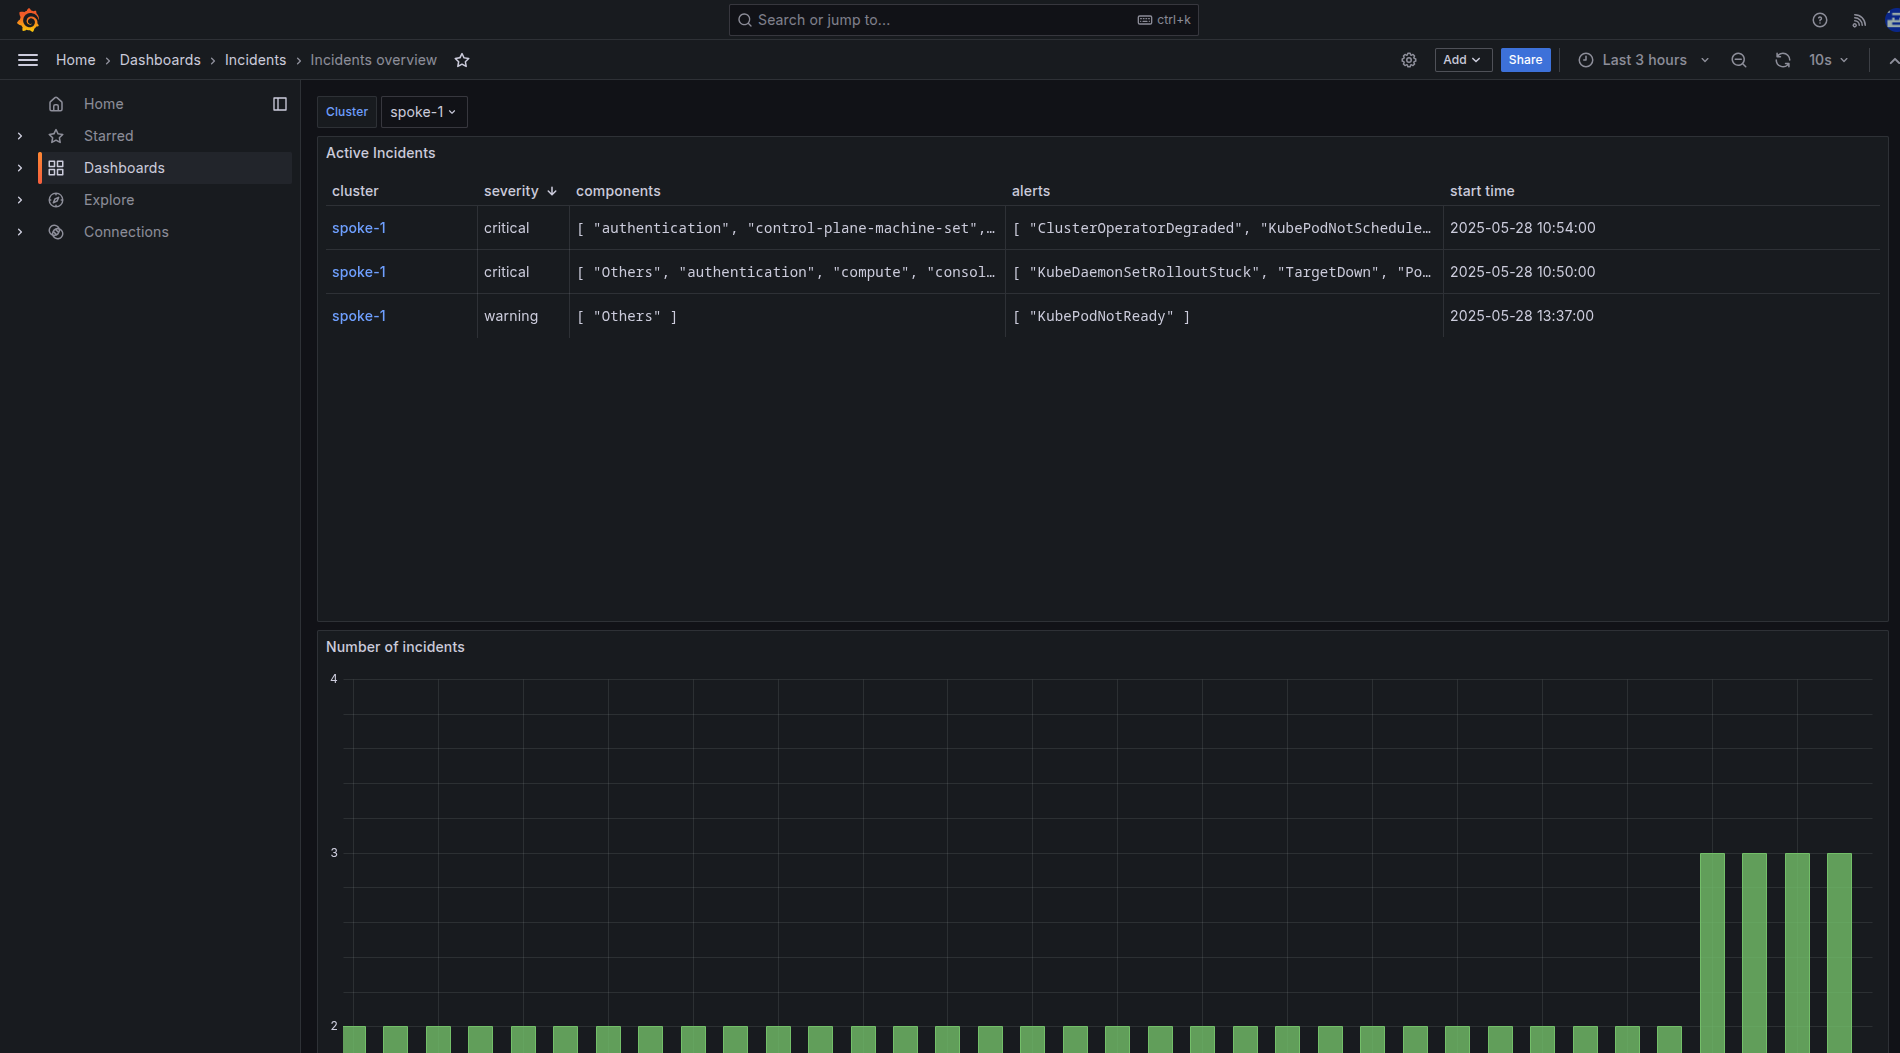
The incidents overview displays a dropdown list for filtering the clusters, followed by a table of active incidents within the selected cluster. Incidents in the table are sorted by priority in descending order and each row in the table corresponds to a single incident. The Incident detail user interface within the OpenShift web console is displayed as shown in Figure 5.
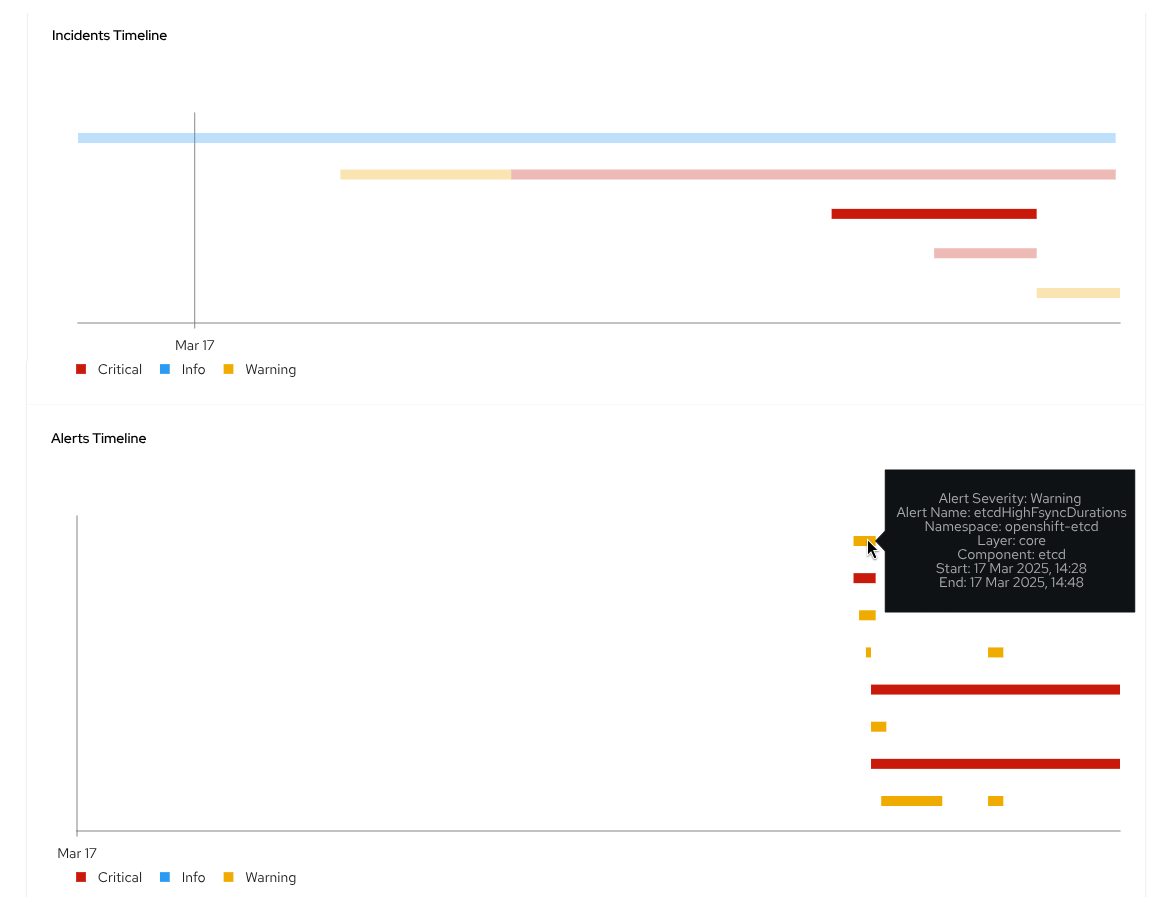
A link to the corresponding incident detail in the OpenShift Container Platform web console of the respective cluster is available in the first column on the left. The Incident detail user interface requires OpenShift version 4.19 (or later) and Cluster Observability Operator version 1.2 (or later) to function.
The next columns show the incident's severity, the components involved, and the alerts involved. The rightmost column indicates the incident's occurrence time.
Figure 6 shows the active incidents in each cluster, there is a graph displaying the number of incidents over time.
Interactive demo
Check out the following interactive demo to see a snapshot of this feature, and understand on how to identify abnormal, suspicious, or critical events occurring within a cluster and timely plan a course of action.
What’s next?
Ready to experience incident detection in Red Hat Advanced Cluster Management 2.14? Existing customers can upgrade through their usual channels. If you're a new user, visit the Red Hat Advanced Cluster Management product page to learn more, start a trial, or explore the documentation.
We’d also like you to help shape the future of this feature. We are looking forward to receiving your feedback. You can share your questions and recommendations with us using the Red Hat OpenShift feedback form.
Last updated: August 18, 2025