Collecting troubleshooting data, like creating a heap dump, can considerably impact the performance of an application, particularly critical ones. Creating a heap dump on production can (and most of the time will) directly impact the Java Virtual Machine's (JVM) performance for a few seconds of applications deployed.
To reduce the overhead of usage (i.e., overhead on data capture), one alternative is to use a lower overhead capturing framework such as Java Flight Recording (JFR) data. This data can be later analyzed offline and used to track down memory usage, high CPU utilization, and thread inspection, for example. But it can be even more useful depending on the events it records.
For Red Hat OpenShift deployments, you can collect data via the Red Hat build of Cryostat Operator, which is a supported approach for OpenShift deployments.
This article introduces Java Flight Recorder and Java Mission Control for recording/analysis. I will also introduce the Cryostat Operator and briefly explain three use cases. See also the conclusion notes about the Cryostat 3.0 release at the end.
Java Flight Recorder
Java Flight Recorder (JFR) is a feature in Java that enables the recording of events with data in their payloads, similar to other tools such as LTTng or e-BPF. The JFR has little overhead, i.e., less than a heap dump, for instance. JFR does not need to be externalized by the JVM in a certain format such as the heap dump that is externalized as hprof file, which is one of the main reasons why heap dumps have a high overhead.
To record JFR in a Java application, use Java Diagnostics (jcmd) to record a file. This file can be exported to be analyzed using Java Mission Control (JCM) (see below). This alternative can be used for the standalone collection of JFR data. Finally, the record file will be created with inputs from events, such as the Java Flight Recorder Events. More details on the events can be found here.
Inside Red Hat OpenShift Container Platform (RHOCP) 4.x, users can use Cryostat Operator to deploy data directly using the console and its Custom Resources: Cryostat and ClusterCryostat.
Java Mission Control
JDK Mission Control (JMC) is a tool that enables inspecting the Java Flight Recording files offline for example. But it also enables creating new JFR live by detecting the Java application.
Cryostat Operator
RHOCP allows the usage of Operators to do certain procedures by the creation of custom APIs, called CustomResourcesDefinitions (CRD) that are used to create CustomResources (CRs).
Red Hat’s build of Cryostat Operator is used to create the JFR recordings inside RHOCP 4 via the usage of the Cryostat CustomResource.
Currently, the Cryostat Operator provides two APIs (as in CRD provided by the Operator for the user to create CRs). See Figure 1.
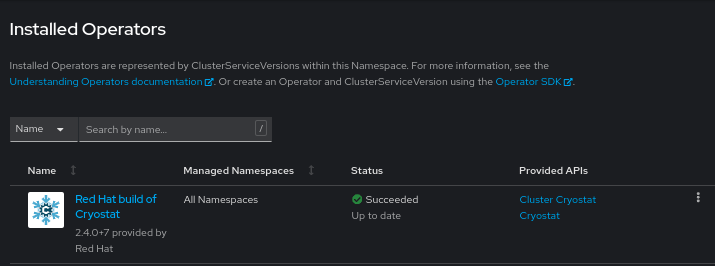
Cryostat: the main CRD provided by Cryostat and provides the basic footprint for JFR recording.ClusterCryostat: essentially the same as Cryostat CRD, but it's cluster-scoped and allows you to deploy a Cryostat instance that works with multiple namespaces. Update on this matter:ClusterCryostatin the next release (after June 2024), i.e., cluster Cryostat will no longer be provided.
In a nutshell, ClusterCryostatAPIs are specifically for users who want one Cryostat application to be able to monitor multiple namespaces. Reasons for this could be to save on resources, or maybe they want to have access to all their applications at a glance.
There are three approaches for the interface of application <-> Cryostat:
- JMX
- Cryostat Agent
- Cryostat Agent with JMX (it works over HTTP, but it might be a bit more complex to set up)
In terms of recording, as explained in Cryostat GitHub's main document, the recording file will record events, and for Cryostat Operator this is controlled by something called a template file in jfc format. Therefore the user can select custom events to be recorded by providing a custom template via configMap:
apiVersion: operator.cryostat.io/v1beta1
kind: Cryostat
metadata:
  name: cryostat-sample
spec:
  eventTemplates:
  - configMapName: custom-template
    filename: my-custom-events-template.jfc
Where the my-custom-events-template.jfc has the events to be recorded. As an example:
<?xml version="1.0" encoding="UTF-8"?>
<!--
     Recommended way to edit .jfc files is to use the configure command of
     the 'jfr' tool, i.e. jfr configure, or JDK Mission Control
     see Window -> Flight Recorder Template Manager
-->
<configuration version="2.0" label="custom_continuous" description="Low overhead configuration safe for continuous use in production environments, typically less than 1 % overhead." provider="chris">
    <event name="jdk.ThreadAllocationStatistics">
      <setting name="enabled">true</setting>
      <setting name="period">everyChunk</setting>
    </event>
    <event name="jdk.ClassLoadingStatistics">
      <setting name="enabled">true</setting>
      <setting name="period">1000 ms</setting>
    </event>
Let's compare JFR and Cryostat with tools that are already well-known.
JFR versus heap dump: In terms of comparison with the head dump vs the Java Flight Recording (JFR file), JFR will have much lower overhead, i.e., impact on the application running, and can be used for investigations and analysis, as long as it a) was recorded during the issue, and b) the events that help on that issue were recorded, given evidently that JFR won't be able to assist in situations where certain were not recorded.
Cryostat versus
jcmdusage: In terms of generating the JFR via Cryostat or Java Diagnostics tool (jcmd), the primary advantage of using Cryostat instead of just creating the JFR data set via$ jcmdinside the container is that the user does not need to login into the container. Secondly, Cryostats enables faster deployments via console as well as well as control of events. In summary, Cryostat improves diagnostics and analysis over purejcmdgeneration as a result giving short preview, easier creation, and Automated Analysis options.
Installation in RHOCP 4
For installation on RHOCP 4, go to the OperatorHub and search for "Red Hat Build of Cryostat" as shown in Figure 2 and then confirm installation.
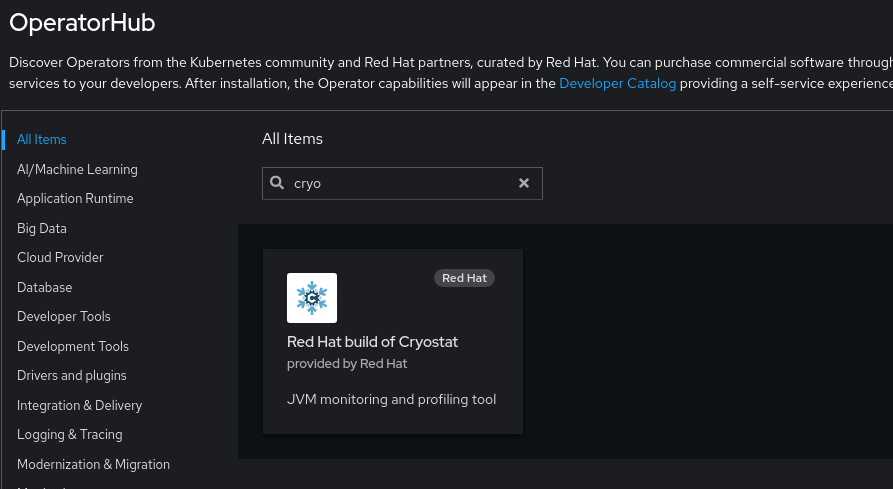
By default, the Cryostat Operator will be installed inside the openshift-operators namespace as cluster-wide Operator—not namespace bounded (given the default OperatorGroup already present in the openshift-operators).
Application instrumentation
For the application to be listened to by Cryostat, the user's application needs to communicate with it. So we use one of the following options: Cryostat Agent, JMX, or Cryostat with JMX. The application needs to be instrumented accordingly:
- With the Cryostat agent jar: By injecting the jar inside the application, the exposing service must be created.
- With the JMX: The application must expose JMX, the JMX properties must be set, and the exposing service created.
Usage of Cryostat in RHOCP 4
For usage, the user needs to create a Cryostat CR (or ClusterCryostat). This can be done by the Console or via YAML creation (create a YAML with the Cryostat specifications). After the creation of the Cryostat CR, one more pod will be created—this pod contains three containers and will be the Cryostat deployment itself, which the user can access via URL.
The installation of the Cryostat Operator will result in the creation of the Cryostat Operator controller manager pod in the selected namespace.
Regarding namespace limits, if you're using the Cryostat CRD then the application must be in the same service, if you're using the ClusterCryostat CRD, then the application can be in any of the namespaces specified under spec.targetNamespaces:
apiVersion: operator.cryostat.io/v1beta1
    kind: ClusterCryostat
    metadata:
      name: clustercryostat-sample
    spec:
      enableCertManager: true
      installNamespace: cryostat-testing
      minimal: false
      reportOptions:
        resources: {}
      storageOptions:
        pvc:
          spec:
            resources: {}
      targetNamespaces: ← set the targetNamespce
      - cryostat-testing
      - my-apps-a
      - my-apps-b
Dashboard and recording
By deploying an application, the communication starts and one can see the statistics displayed on the dashboard (Figure 3).
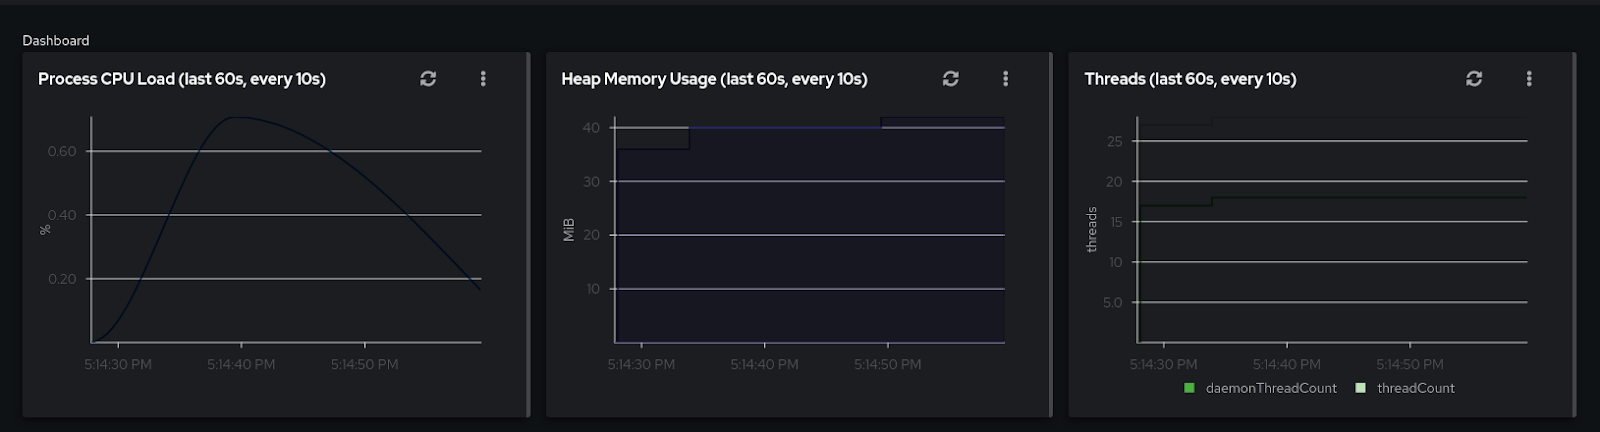
To create a Recording, select the Recordings section on the left menu, and then Custom Flight Recordings.
Example Cryostat resource:
spec:
enableCertManager: false
minimal: false
reportOptions:
resources: {}
storageOptions:
pvc:
spec:
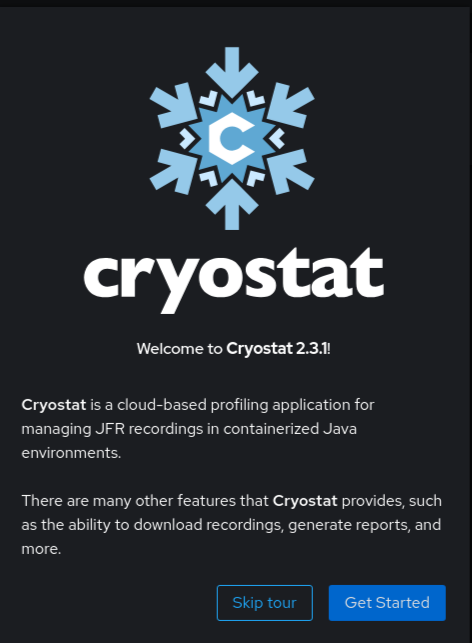
resources: {}The first access will return to the following page (Figure 4).
Use cases
Example use case 1: Memory allocation
Java developers sometimes over-allocate memory to their workloads in RHOCP 4, so Cryostat can be used on exactly this use case to easily check the actual memory usage of a JVM and how much of the allocated memory is useful/wasted.
For this type of investigation, enable the recording and analyze the recording verifying the memory usage/allocation.
Example use case 2: Unexpected shutdowns: SIGTERM/SIGKILL
Another interesting use case is capturing recordings for unexpected shutdowns: what happens if my application shuts down unexpectedly? What if Kubernetes decides to kill the pod via SIGTERM/SIGKILL after the probes don't respond?
Cryostat can be used in this case to check what was happening on the application during this process and how the threads were behaving so then pinpoint the threads being stuck.
For this type of investigation, enable the trace via agent instrumentation and then investigate the post-mortem file. This can be done only via agent instrumentation because the agent will install a signal handler to the JVM that gives an application a hook to dump the recording on exit.
Example use case 3: High CPU usage
Finally, another interesting use case is capturing recordings for high CPU investigation. As long as the events with high CPU usage are properly set, to then it is possible to investigate them via the Java Flight Recordings.
For instance, the user deploys an application in RHOCP 4 using the deployment.yaml with the Cryostat Agent. Then install the Cryostat Operator and collect the Java Flight Record, which later can reveal the high CPU usage, as long as the CPU load events are recorded, such as jdk.CPUInformation and jdk.CPULoad events must be recorded. For high CPU usage, an example can be found here.
Analysis in Java Mission Control (JMC)
For analysis of the JFR file via Cryostat: from the context menu of the recording, you can view it in Grafana (need the credentials from <cr name>-grafana-basic), or instead download the JFR file to open locally in JMC, where we can see the events, such as high CPU events for example—see use case 3 above.
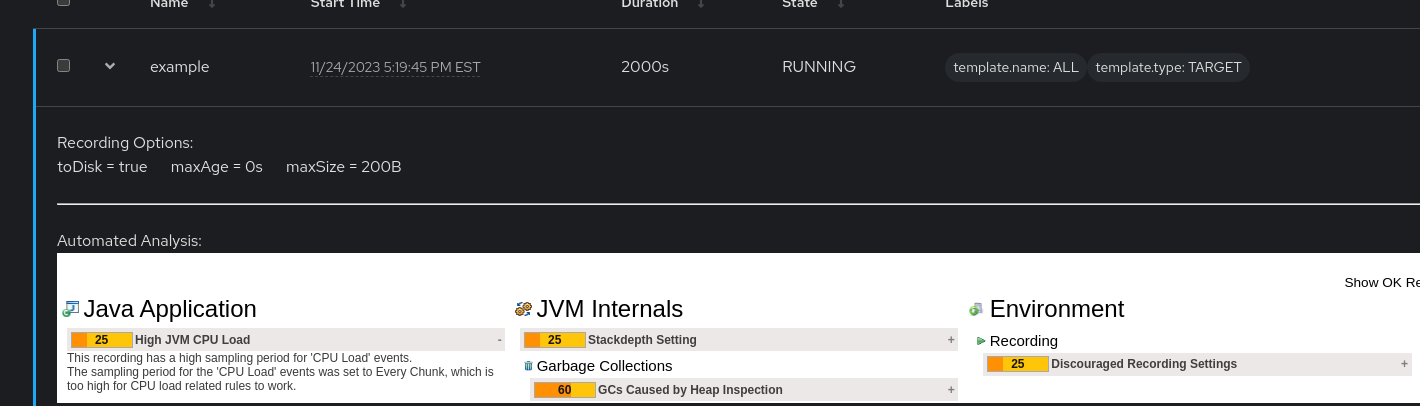
In terms of analysis, the data can be exported and opened with Java Mission Control. From the example above capturing the recording one can see the automated analysis on the dashboard. See Figure 5.
Conclusion
This article aims to help explain and educate readers on the matters of JFR/JMC for the creation and analysis of flight recording data and the usage of Cryostat Operator, which is used to create the recording inside RHOCP 4, and its usage via JMX/Cryostat Agent.
The Operator provides a straightforward approach for recording JFR files and provides some options for instrumenting the application and for post-mortem investigations agent instrumentation might be more adequate for example, rather than JMX. Also depending on the use case a custom event template must be used. See above for details.
Thank you Will Russell for your editorial review of this article. And special thanks to the Cryostat team, Chris Mah and Alex Macdonald, for the great input on this blog post.
Important note:
After the conclusion of this article, during its publication, Cryostat 3.0 was released, and it brings several features such as implementation in Quarkus (instead of Eclipse Vert.x), Postgres database by default, and S3-compatible object storage. ClusterCryostat CR will be removed in this next release (after July 2024), i.e., cluster Cryostat CR will no longer be provided. Finally, now cluster-wide installation is preferred, so namespace installation is being deprecated.
Additional resources
Where can I get the latest version of Cryostat? You can install Cryostat using our Kubernetes operator on OperatorHub.io or via a Helm Chart.
For providing feedback: Please reach out to the Cryostat group at cryostat-development@googlegroups.com or create a discussion in GitHub with any questions or comments.
To learn more about the JFR, see this reference. For Cryostat, see this one. And for JMC, see this one. For JMC tutorials and examples, see this reference.
For any other specific inquiries, please open a case with Red Hat support. Our global team of experts can help you with any issues.
Last updated: July 17, 2024