Three years ago, we introduced kube-burner to the Kubernetes performance and scale communities. Since then, kube-burner has steadily continued its journey, adding a diverse range of features that help solve unique challenges in performing and analyzing results from performance and scale tests on Kubernetes and Red Hat OpenShift.
Over the last few years, multiple new features and usability improvements were added to kube-burner. In this article, we will go beyond the basics, exploring some new bells and whistles added to the tool recently and laying out our vision for the future.
The story so far
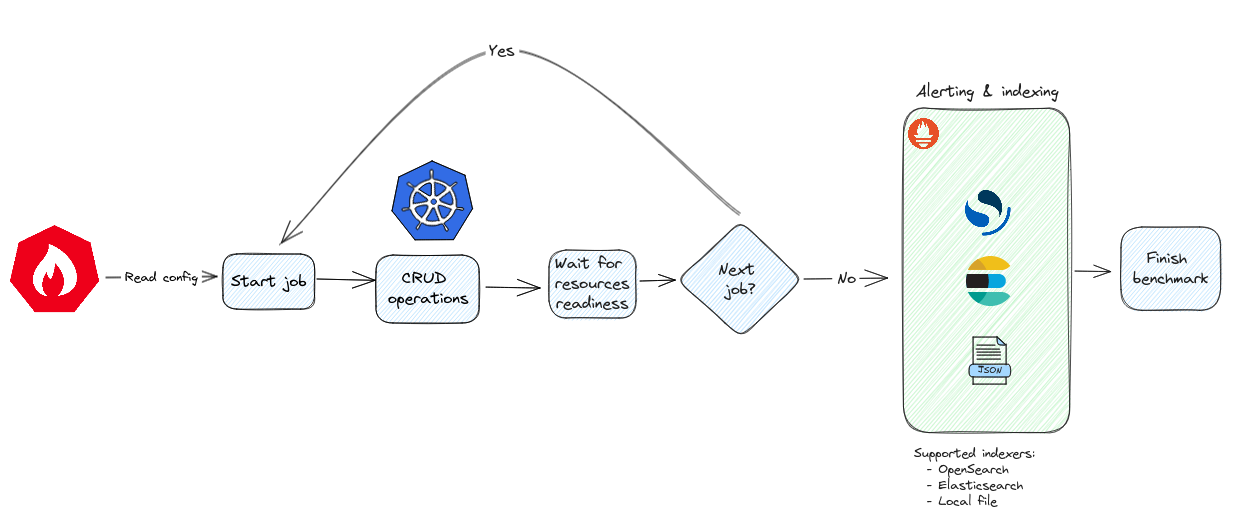
For the uninitiated and at a high level, kube-burner is a flexible open source Kubernetes performance and scale testing tool. It’s capable of creating, deleting, and updating Kubernetes resources as per user defined requirements, obtaining platform performance metrics and indexing performance results along with those metrics into a desired long term storage solution. Kube-burner makes use of a YAML configuration file that holds a set of instructions and jobs. Jobs consist of a series of resource templates and parameters that handle how these resources are going to be created, deleted or patched. Each job runs for the number of times specified by the jobIterations parameter. Figure 1 illustrates this process.
Measurements
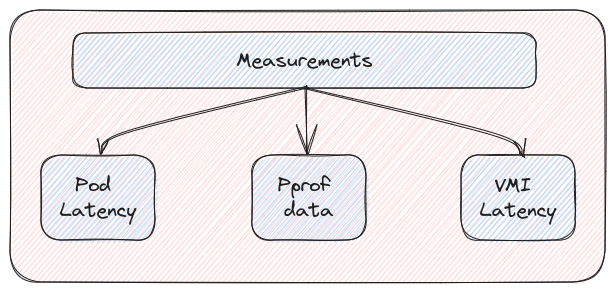
The initial post on kube-burner touched on its capabilities to scrape platform metrics from Prometheus and index them to a disk or other long term storage like Elasticsearch/OpenSearch. In this section we will briefly look into the custom measurements that kube-burner supports to augment the metrics available in Prometheus and enhance a user’s insights into the performance of the platform as well as applications.
- Pod latency: Calculates the time it takes for a pod to go all the way from Scheduling to Ready using timestamps captured during each pod lifecycle event. These latencies can be used to evaluate the performance of several core OpenShift and Kubernetes components.
- VMI latency: Similar to pod latency but for OpenShift Virtualization/KubeVirt virtual machines (VMs).
- Pprof: This can be used to fetch periodic profiling information (pprof files) from OpenShift infrastructure pods (openshift-apiserver, etcd, etc.) as well as Golang apps running in a pod. See Figure 2.
Support for multiple Prometheus endpoints
Initially, kube-burner supported scraping metrics from only one Prometheus endpoint. During the course of our testing, we realized the need to scrape metrics spread across multiple Prometheus stacks. Consider the case of a Prometheus user workload monitoring stack that exists in addition to the platform monitoring stack, or multiple Prometheus stacks deployed in the case of HyperShift. Scenarios like these necessitate the ability to scrape multiple endpoints each with its custom set of queries. We now have the option to scrape from multiple Prometheus endpoints and publish the results to the target indexer (JSON file on local filesystem or Elasticsearch/OpenSearch instance) with a single uuid. For this we can either use -e or --metrics-endpoint option on the CLI or the metricsEndpoint option from the configuration file.
$ kube-burner init -c cluster-density.yml -e metrics-endpoints.yaml

And a metrics-endpoints.yaml file with valid keys for the init command would look something like this:

- endpoint: http://localhost:9090
  token: <token>
  profile: metrics.yaml
  alertProfile: alert-profile.yaml

- endpoint: http://remotehost:9090
  token: <token>
Moving common functionality and reusable code to a shared library
As we worked to close the gaps on requirements for orchestrating performance and scale tests through kube-burner, we wanted to:
- Use observability data from the platform Prometheus
- Index result metadata into a configured backend for long term storage
- Retrieve and gather metadata about the platform to enhance regression testing capabilities.
As we did this, it became very apparent that certain aspects of kube-burner’s functionality and portions of its code could be leveraged by other performance and scale testing tools. To this end, we split this code out into a shared library called go-commons and evolved kube-burner’s code to consume this library. This was a giant leap forward in reducing code duplication and confirming consistency of operations across different performance and scale testing tools that each have some common requirements regardless of what aspects of Kubernetes they focus on testing (for example, dataplane testing tools, which target use cases quite different from kube-burner, can still use this library).
Continuous integration
We also introduced a comprehensive testing framework that includes linting and style checks as well as bats test for functional testing on actual Kubernetes and OpenShift clusters. This helped to provide quicker feedback on PRs and improve the quality of resulting code.
The end-to-end testing framework is powered by bats and kind among others, allowing us to develop a more structured and scalable testing experience which can be executed either in GitHub actions or in a local environment after meeting just a few requirements
OCP wrapper
Kubernetes provides the foundational components of OpenShift, which in turn provides a unified application platform to support building, modernizing and deploying even the most demanding applications. The process of taking barebones Kubernetes and transforming it into a turnkey app platform means there are additional API objects as well as Container Network Interface (CNI) and Container Storage Interface (CSI) plugins that need to be tested in order to provide for the performance and scalability of OpenShift.
Kube-burner has always supported creating, deleting and patching various kinds of resources at scale based on the configuration file as well as resource templates provided by the user. The Performance and Scale team at Red Hat recognized the need to have some canned workloads that represent real world customer use cases and at the same time exercise OpenShift-specific scenarios.
As a result, a decision was made to create the kube-burner-ocp wrapper, which provided a net new CLI subcommand. This became a single point of entry into running several performance and scale tests to mimic production workloads that would stress OpenShift components. This was made in a way that opened up the possibility of creating other wrappers around kube-burner, perhaps focused on other distributions or use cases that built on core kube-burner functionality.
$ kube-burner ocp help

This subcommand is meant to be used against OpenShift clusters and serve as a shortcut to trigger well-known workloads

Usage:

  kube-burner ocp [command]

Available Commands:

  cluster-density-ms                               Runs cluster-density-ms workload

  cluster-density-v2                               Runs cluster-density-v2 workload

  crd-scale                                        Runs crd-scale workload

  index                                            Runs index sub-command

  networkpolicy-matchexpressions                   Runs networkpolicy-matchexpressions workload

  networkpolicy-matchlabels                        Runs networkpolicy-matchlabels workload

  networkpolicy-multitenant                        Runs networkpolicy-multitenant workload

  node-density                                     Runs node-density workload

  node-density-cni                                 Runs node-density-cni workload

  node-density-heavy                               Runs node-density-heavy workload

  pvc-density                                      Runs pvc-density workload

  web-burner-cluster-density                       Runs web-burner-cluster-density workload

  web-burner-init                                  Runs web-burner-init workload

  web-burner-node-density                          Runs web-burner-node-density workload

Flags:

      --alerting                                   Enable alerting (default true)

      --burst int                                  Burst (default 20)

      --es-index string                            Elastic Search index

      --es-server string                           Elastic Search endpoint

      --extract                                    Extract workload in the current directory

      --gc                                         Garbage collect created namespaces (default true)

      --gc-metrics                                 Collect metrics during garbage collection

      -h, --help                                   help for ocp

      --local-indexing                             Enable local indexing

      --metrics-endpoint string                    YAML file with a list of metric endpoints

      --profile-type string                        Metrics profile to use, supported options are: regular, reporting or both (default "both")

      --qps int                                    QPS (default 20)

      --timeout duration                           Benchmark timeout (default 4h0m0s)

      --user-metadata string                       User provided metadata file, in YAML format

      --uuid string                                Benchmark UUID (default "9e14107b-3d15-4904-843b-eac6d23ebd40")

Global Flags:

      --log-level string   Allowed values: debug, info, warn, error, fatal (default "info")

Use "kube-burner ocp [command] --help" for more information about a command.
The OCP wrapper offers several advantages, including:
- Streamlined execution of supported workloads, requiring only a few essential flags.
- Indexing of OpenShift metadata alongside the benchmark results. You can locate this document using the query
uuid: <benchmark-uuid> AND metricName.keyword: "clusterMetadata". - Eliminates the requirement of configuration files to adjust certain workload parameters.
- Automatic discovery of the Prometheus URL and authentication token, eliminating the necessity for users to perform these operations before utilizing them.
- Two different profiles are available for the OCP wrapper workloads, enabling kube-burner to scrape Kubernetes and OpenShift specific metrics.
- An alert profile is also available, which currently makes a kube-burner benchmark fail when a critical Prometheus alert is detected.
- Indexing mode, similar to the regular kube-burner entrypoint, the OCP wrapper ships an indexing mode, which adds the discovered OCP metadata to the indexed documents.
To initiate any of the supported workloads using this subcommand, you need to execute kube-burner with the OCP subcommand. The workloads are integrated into the kube-burner binary:
Executing node-density with 100 pods per node:
$ kube-burner ocp node-density --pods-per-node=100
With the above command, the wrapper will determine the necessary number of pods to deploy across all worker nodes in the cluster so that the total number of pods running per worker node is 100 and we are able to stress/observe Kubelet and the container runtime.
Let us now look at a few of the workloads that currently exist within the OCP wrapper.
Cluster density workloads
This collection of workloads is designed with a focus on control-plane performance and scalability through creating a variety of resources across the cluster. It comprises two distinct variants: cluster-density-v2 and cluster-density-ms.
Each iteration of these workloads creates and operates within a new namespace, and the two variants share the same configuration flags.
These workloads also support a feature called churn which deletes and recreates a percentage of the created resources for a predefined time interval to mimic real world use cases where a cluster in steady state has a subset of the existing resources being deleted and new resources being created.
cluster-density-v2
In each iteration, the following objects are generated within each created namespace:
- 1 image stream.
- 1 build. Prior setup of the OCP internal container registry is necessary, as the resulting container image will be pushed there.
- 3 deployments, each with two pods and 2 replicas (nginx), mounting 4 secrets, 4 config maps and 1 downward API volume each.
- 2 deployments, each with two pods and 2 replicas (curl), mounting 4 secrets, 4 config maps and 1 downward API volume each. These pods are equipped with a readiness probe that makes a request to one of the services and one of the routes created by this workload every 10 seconds.
- 5 services, each pointing to the TCP/8080 port of one of the nginx deployments.
- 2 edge routes pointing to the first and second services, respectively.
- 10 secrets containing a 2048-character random string.
- 10 config maps containing a 2048-character random string.
- 3 network policies:
- Deny-all traffic.
- Allow traffic from client/nginx pods to server/nginx pods.
- Allow traffic from the openshift-ingress namespace (where routers are deployed by default) to the namespace.
cluster-density-ms
This is the lighter version of the control plane workloads in the cluster-density family. In each iteration, the following objects are created within each generated namespace:
- 1 image stream.
- 4 deployments, each with two pod replicas (pause), mounting 4 secrets, 4 config maps, and 1 downward API volume each.
- 2 services, each pointing to the TCP/8080 and TCP/8443 ports of the first and second deployments, respectively.
- 1 edge route pointing to the first service.
- 20 secrets containing a 2048-character random string.
- 10 config maps containing a 2048-character random string.
Node density workloads
The workloads within this family generate namespaces containing a specific set of pods, deployments, and services.
node-density
This workload is designed to load all worker nodes in the cluster with pause pods (pods whose entrypoint is just sleep inf). This workload helps assess the performance of the control plane as well as workers by providing performance metrics about kube-scheduler, kubelet, and the container runtime.
node-density-cni
Each iteration of this workload establishes two deployments—a client/curl and a server/nginx and one service supported by the preceding server pods. The client application is configured with a startup probe that makes requests to the preceding service every second, with a timeout of 600 seconds. This helps establish the time taken by the CNI plug-in to establish network connectivity between pods to identify potential bottlenecks.
Note: This workload calculates the number of iterations based on the number of nodes and desired pods per node. To provide for the test's scalability and performance, chunks of 1000 iterations are each grouped into one namespace, utilizing the configuration variable iterationsPerNamespace.
node-density-heavy
Each iteration of this workload creates two deployments, a PostgreSQL database and a simple client that executes periodic insert queries (configured through liveness and readiness probes) on the aforementioned database. Additionally, a service is established, which the client uses to connect to the database. This workload creates significant load at the node level.
Note: Similar to the node-density-cni workload, this one calculates the number of iterations based on the number of nodes and desired pods per node. To maintain scalability and performance, chunks of 1000 iterations will be distributed across separate namespaces, leveraging the configuration variable iterationsPerNamespace.
Network policy workloads
Utilizing the networkpolicy object in Kubernetes allows us to manage traffic flow at the IP address or port level, offering various configurations such as allowing or denying traffic from specific namespaces, denying traffic from specific pod IPs, denying all traffic and more. To comprehensively test the performance of NetworkPolicy and the CNI, we've designed the following test cases.
networkpolicy-multitenant
- 500 namespaces.
- 20 pods in each namespace, with each pod serving as both a server and a client.
- Initially, a default deny network policy is applied, blocking traffic to any test namespace.
- Each namespace has three network policies: allowing traffic from the same namespace and two other namespaces using namespace selectors.
networkpolicy-matchlabels
- 5 namespaces.
- 100 pods in each namespace, with each pod acting as both a server and a client.
- Each pod is assigned 2 labels, and each label is shared by 5 pods.
- A default deny network policy is applied initially.
- For each unique label in a namespace, a network policy is created with that label as a
podSelector, allowing traffic from pods with some other randomly selected label. This results in 40 network policies per namespace.
networkpolicy-matchexpressions
- 5 namespaces.
- 25 pods in each namespace, with each pod acting as both a server and a client.
- Each pod is assigned 2 labels, and each label is shared by 5 pods.
- A default deny network policy is applied initially.
- For each unique label in a namespace, a network policy is created with that label as a
podSelector, allowing traffic from pods that don't have some other randomly selected label. This results in 10 network policies per namespace.
CRD scale workload
Operators which are based on Custom Resource Definitions (CRDs) and custom controllers have been pivotal in establishing the dominance of OpenShift in the world of Kubernetes-based, enterprise application platforms. A key question that keeps popping up as customers extend the Kubernetes API through CRDs and manage the lifecycle of their apps through the operator framework is how many CRDs is too many? To help answer this question, kube-burner now has a CRD scale workload which creates a user defined number of cluster scoped CRDs in a namespace.
Telco specific workloads
As people became familiar with kube-burner internally and externally, several wrappers and scripts that utilized kube-burner mushroomed to cater to unique use cases. One such use case was to run telco specific control plane testing of OpenShift. As OpenShift became an increasingly common method to deploy infrastructure and container-native network functions, the need to establish the performance and scalability of OpenShift on bare metal became of paramount importance to our customers, partners and Red Hat alike.
Our telco performance and scale team had initially created a wrapper around kube-burner to perform some telco specific setup, configuration and testing of OpenShift on bare metal. As kube-burner’s development roadmap has always been sensitive to providing an easy-to-use but flexible tool that works across a range of use cases, we worked on migrating those bespoke scripts into mainline kube-burner, under the OCP wrapper umbrella.
Customizing workloads
One can personalize any of the workload configurations mentioned above by extracting, modifying, and subsequently executing them:
$ kube-burner ocp node-density --extract

$ ls

alerts.yml  metrics.yml  node-density.yml  pod.yml  metrics-report.yml

$ vi node-density.yml                                                                           # Perform modifications accordingly

$ kube-burner ocp node-density --pods-per-node=100    # Run workload
Metrics-profile type
Kube-burner aims to capture a wealth of granular data for performance engineers as they work to better identify anomalies in system behavior. As a consequence of this, a large number of documents that capture metrics for the duration of the kube-burner benchmark are indexed into the local file system as JSON files or an Elasticsearch/OpenSearch endpoint depending on the configuration of the user. This presents obvious storage as well as infrastructure upkeep and maintenance problems.
To cater to cases where granular metric data may be unnecessary, --profile-type CLI option which supports a “reporting” mode was introduced. Kube-burner can employ three distinct “profile-types” for retrieving metrics from Prometheus—“regular”, “reporting” or “both”. When utilizing the “regular” mode, kube-burner uses the metrics-aggregated or metrics metrics profiles to perform scraping and indexing of time series metrics resulting in a large number of indexed documents. The reporting mode uses a metrics profile that consists of metrics representing summary statistics like average, max, min, and etc. that are directly used to query Prometheus to reduce the number of metrics captured from Prometheus. Using the “reporting” profile type shows a marked reduction in the number of documents sent to the configured indexer. The default configuration is “both,” meaning that it will utilize the regular metrics profiles associated with the workload of concern, as well as the reporting metrics profile.
Indexing: Cluster metadata
Once the benchmark concludes, kube-burner will index the cluster metadata in the designated indexer. Presently, this process relies on the following Golang struct:
type BenchmarkMetadata struct {
  ocpmetadata.ClusterMetadata
  UUID         string                 `json:"uuid"`
  Benchmark    string                 `json:"benchmark"`
  Timestamp    time.Time              `json:"timestamp"`
  EndDate      time.Time              `json:"endDate"`
  Passed       bool                   `json:"passed"`
  UserMetadata map[string]interface{} `json:"metadata,omitempty"`
}
Where ocpmetadata.ClusterMetadata is an embedded struct inherited from the go-commons library, which has the following fields:
// Type to store cluster metadata

type ClusterMetadata struct {
  MetricName       string `json:"metricName,omitempty"`
  Platform         string `json:"platform"`
  OCPVersion       string `json:"ocpVersion"`
  OCPMajorVersion  string `json:"ocpMajorVersion"`
  K8SVersion       string `json:"k8sVersion"`
  MasterNodesType  string `json:"masterNodesType"`
  WorkerNodesType  string `json:"workerNodesType"`
  MasterNodesCount int    `json:"masterNodesCount"`
  InfraNodesType   string `json:"infraNodesType"`
  WorkerNodesCount int    `json:"workerNodesCount"`
  InfraNodesCount  int    `json:"infraNodesCount"`
  TotalNodes       int    `json:"totalNodes"`
  SDNType          string `json:"sdnType"`
  ClusterName      string `json:"clusterName"`
  Region           string `json:"region"`
  ExecutionErrors  string `json:"executionErrors"`
}
Looking ahead
Kube-burner has a well defined roadmap that includes several usability as well as feature improvements. With the traction kube-burner is seeing in the community, we are planning on building an ecosystem around it by restructuring the code into kube-burner-core. This would primarily focus on driving job execution and metrics collection, with additional repositories to house the ocp-wrapper as well as the grafonnet code for the dashboards used to visualize indexed data in Elasticsearch/Opensearch.