This quick tip shows you how to export traffic analytics from your Red Hat 3scale API Management environment to a third-party data visualization tool. For this example, we will use Datawrapper, which is provided free for personal use without any trial basis at the time of this writing.
Prerequisites
This article assumes that you have a 3scale developer account and a 3scale application with API credentials. In 3scale, create a product and run through some requests for the API. For more details on how to create a product, add a back end, and send requests to the product's API refer to the 3scale documentation.
Step 1: Export the 3scale Analytics API
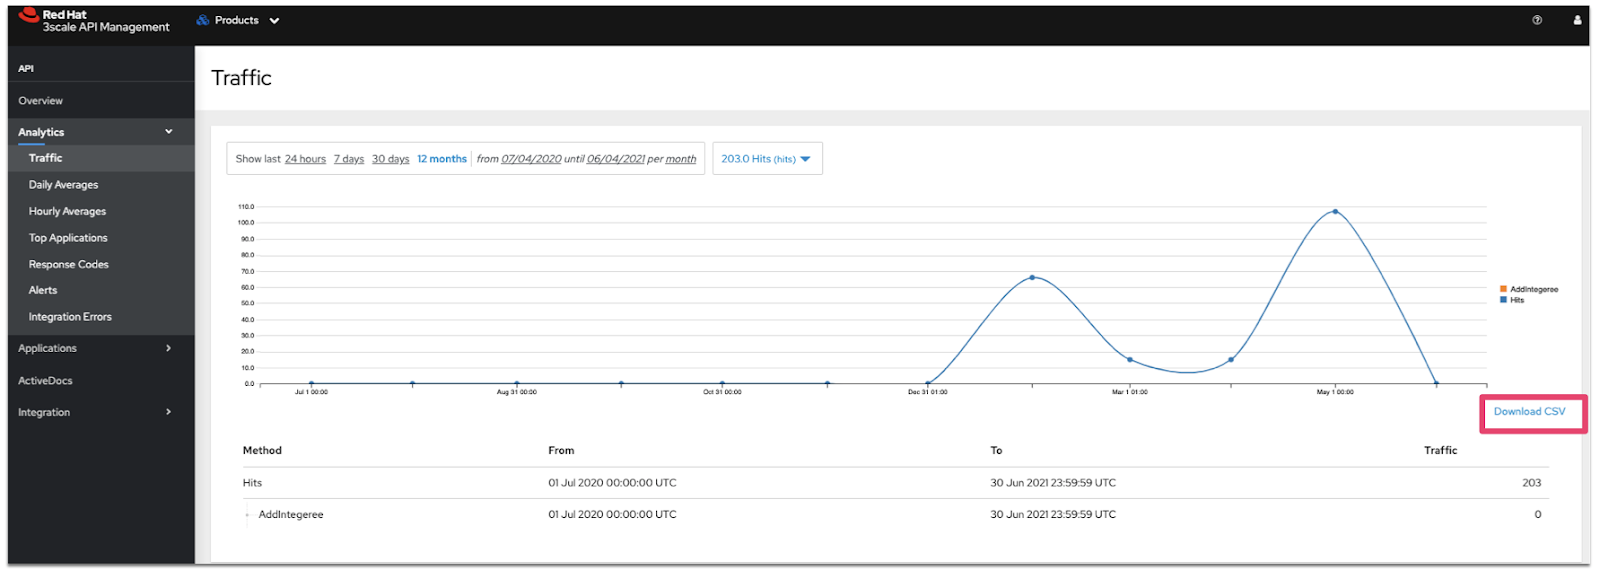
Next, you will export your product's traffic analytics from the 3scale Analytics API. Go to Products->Analytics->Traffic and click Download CSV, as shown in Figure 1.

Step 2: Upload the analytics into a data visualization tool
The steps to import and display the traffic analytics are as follows:
- Create a free Datawrapper account.
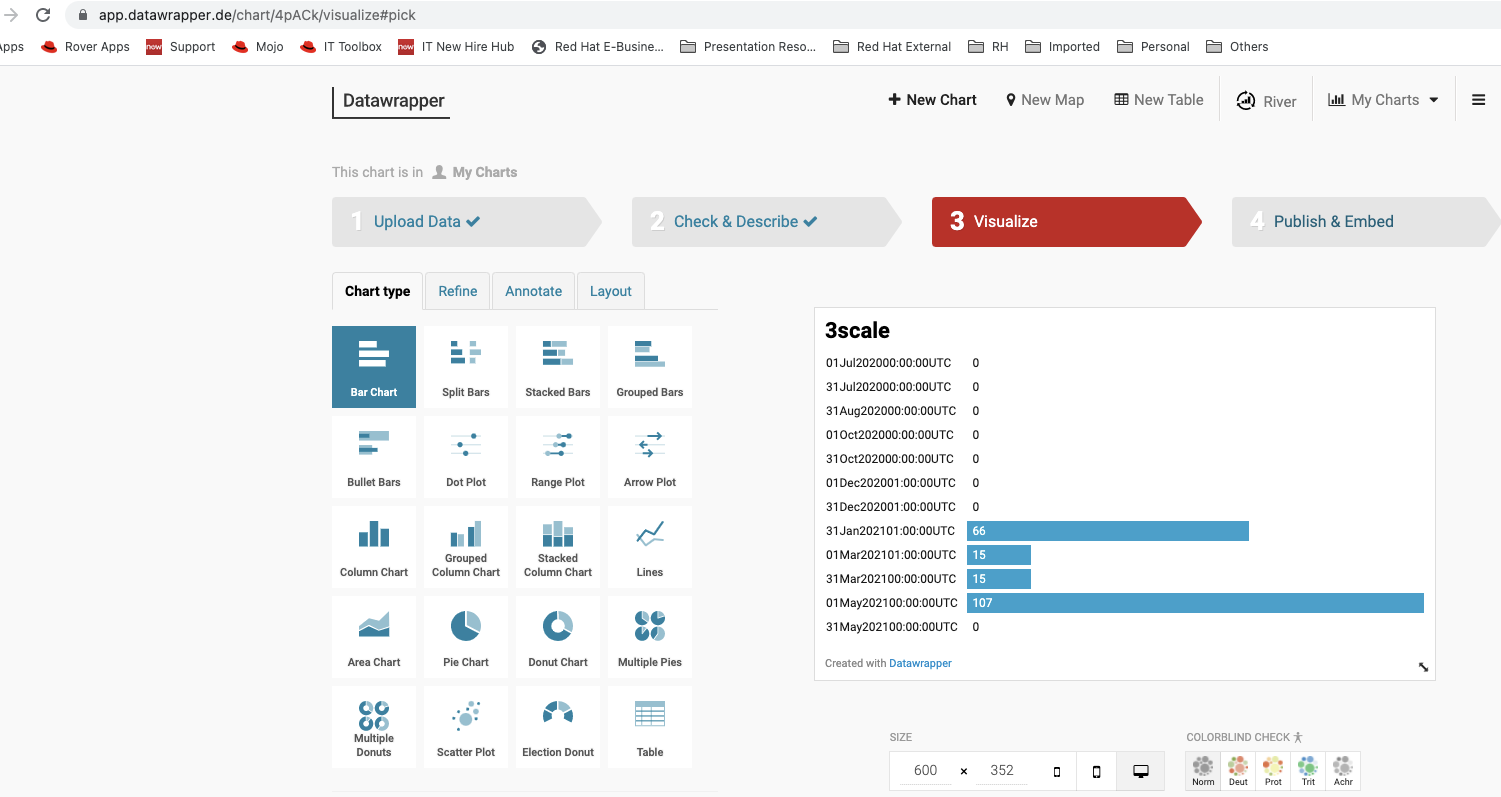
- Click Create New Chart and upload the CSV file you've just downloaded from 3scale.
- Use the options shown in Figure 2 to customize the graphs and select different kinds of visualizations.

Conclusion
The instructions in this tip were for exporting and importing a 3scale CSV file to Datawrapper. The instructions can be applied to other formats and visualization tools. As an example, you could use 3scale's REST API to export analytics in JSON and XML format. You can export and import 3scale analytics files to any data visualization tool that supports them. For more details, see Exporting 3scale API analytics beyond built-in capabilities.
Last updated: September 19, 2023