William Cohen
William Cohen has been a developer of performance tools at Red Hat for over a decade and has worked on a number of the performance tools in Red Hat Enterprise Linux and Fedora such as OProfile, PAPI, SystemTap, and Dyninst.
William Cohen's contributions

Article
Making SystemTap instrumentation easier with tapsets
William Cohen
Use existing SystemTap tapsets to make your SystemTap scripts more concise and more portable. Write your own tapsets to allow yourself and others to reuse SystemTap code across multiple instrumentation scripts.
Article
Write a SystemTap script to trace code execution on Linux
William Cohen
Learn from our experts about how SystemTap allows you to add instrumentations to Linux systems to better understand kernel and application behavior.
Article
Use a SystemTap example script to trace kernel code operation
William Cohen
Identify anomalous behavior in the Linux kernel or userspace applications, down to the level of particular lines of code, using SystemTap. Learn more.
Article
Debugging function parameters with Dyninst
William Cohen
Automate app analysis by using Dyninst to debug function parameters. The suite simplifies the process via dynamic and static analysis and instrumentation tools.
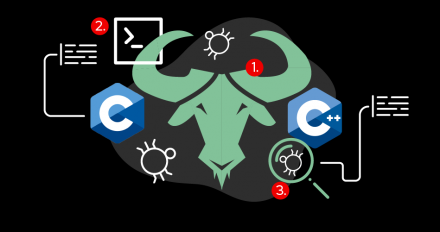
Article
How to debug C and C++ programs with rr
William Cohen
Learn how you can go back in time and replay what went wrong in a C/C++ program with rr (a GNU Debugger Linux enhancement) in this short demo.

Article
Debuginfo is not just for debugging programs
William Cohen
Discover how debuginfo can help you improve your code beyond debugging, thanks to the information it maps between the executable and the source code.

Article
Possible issues with debugging and inspecting compiler-optimized binaries
William Cohen
Save time and frustration when investigating a buggy program by learning why developers are encouraged to use -Og instead of enabling compiler optimization.
Article
How to count software events using the Linux perf tool
William Cohen
In this tutorial, learn how to use the Linux perf tool to count system calls.

Making SystemTap instrumentation easier with tapsets
Use existing SystemTap tapsets to make your SystemTap scripts more concise and more portable. Write your own tapsets to allow yourself and others to reuse SystemTap code across multiple instrumentation scripts.

Write a SystemTap script to trace code execution on Linux
Learn from our experts about how SystemTap allows you to add instrumentations to Linux systems to better understand kernel and application behavior.

Use a SystemTap example script to trace kernel code operation
Identify anomalous behavior in the Linux kernel or userspace applications, down to the level of particular lines of code, using SystemTap. Learn more.

Debugging function parameters with Dyninst
Automate app analysis by using Dyninst to debug function parameters. The suite simplifies the process via dynamic and static analysis and instrumentation tools.

How to debug C and C++ programs with rr
Learn how you can go back in time and replay what went wrong in a C/C++ program with rr (a GNU Debugger Linux enhancement) in this short demo.

Debuginfo is not just for debugging programs
Discover how debuginfo can help you improve your code beyond debugging, thanks to the information it maps between the executable and the source code.

Possible issues with debugging and inspecting compiler-optimized binaries
Save time and frustration when investigating a buggy program by learning why developers are encouraged to use -Og instead of enabling compiler optimization.

How to count software events using the Linux perf tool
In this tutorial, learn how to use the Linux perf tool to count system calls.
