In this article, I examine the performance of two virtual machines (VMs) using huge pages in the Linux kernel. One VM is configured to use transparent huge pages (THP), which happens by default. The other is configured to use 1GiB static huge pages (SHP), which requires special configuration on the virtualization host and in the virtual machine definition.
Huge pages in the Linux kernel
It is one of the Linux kernel's responsibilities to manage the translation between virtual and physical addresses for each process. Memory is organized into pages; a page table is consulted when performing virtual-to-physical address translation. In order to avoid repeatedly walking the page table, a cache known as the translation lookaside buffer (TLB) is utilized to improve performance. The size of the TLB is limited, so on machines with large amounts of physical memory, it can be advantageous to use larger page sizes to reduce the number of TLB misses.
On the x86-64 architecture, the default page size is 4KiB, though larger page sizes of 2MiB and 1GiB are both supported. The 1GiB huge pages are supported only on processors with the pdpe1gb CPU flag.
QEMU/KVM, by default, attempts to allocate virtual machine memory using the transparent huge page mechanism, which uses 2MiB pages. Larger 1GiB pages may be allocated to the virtual machine if both the virtualization host and virtual machine have been configured to use them. These 1GiB huge pages may be allocated either statically at boot time or dynamically at runtime. I ran my experiments using static boot-time allocation. Dynamic allocation is somewhat more complicated; other resources should be consulted if you want to use dynamic, non-transparent huge page allocation. It should also be understood that 2MiB pages may be statically allocated, but doing so is not as compelling because the transparent huge page mechanism already uses this page size.
1GiB static huge page configuration on the virtualization host
On the virtualization host, 1GiB huge pages are reserved by adding the following parameters to the Linux kernel command line:
hugepagesz=1G hugepagesz=1G hugepages=N
You would, of course, replace N with some suitable number. For instance, on my virtualization host, I'm using hugepages=48. This, in conjunction with the other command-line parameters, allocates 48GiB of memory for use as 1GiB static huge pages. I didn't actually require this many huge pages for my experiments. I wanted to test using a scenario that I might use in my daily work, where I have several virtual machines in constant use.
Kernel command-line parameters can be set using grubby as described for Red Hat Enterprise Linux (RHEL). Kernel command-line arguments can also be added to GRUB_CMDLINE_LINUX in /etc/default/grub and then enabled by running grub2-mkconfig as appropriate for your installation. I used this latter approach for configuring the virtualization host in my experiments.
Huge page configuration for virtual machines
As noted earlier, QEMU attempts to use transparent huge pages to allocate memory for virtual machines. Non-transparent huge pages, either static or dynamic, may instead be used by making changes to the XML definition for the machine. All you have to do is to add the following lines to the libvirt domain defining the machine:
<memoryBacking>
  <hugepages/>
</memoryBacking>
For my experiments, I made the change via the XML tab in virt-manager. It is also possible to use the virsh edit vmname command to make this change.
Virtualization host
The virtualization host that I used for my experiments has 128GiB of RAM with a 16-core (32 thread) AMD Ryzen Threadripper 2950X processor. This processor has a base clock speed of 3.5GHz and a maximum boost clock speed of 4.4GHz. Total L1, L2, and L3 cache sizes are 1.5MiB, 8MiB, and 32MiB, respectively. The processor was not overclocked, but I did use the RAM's XMP profile (which is technically a type of overclocking) in order to utilize the RAM's advertised speed. Table 1 summarizes the specifications for the host.
| Processor | AMD Ryzen Threadripper 2950X |
| Memory size | 128GiB |
| Memory details | 8x16GB Corsair Vengeance LPX 2666MHz (PC4 21300) |
| Motherboard | ASRock X399 Professional Gaming |
| OS | Fedora 32 |
| Linux kernel version | 5.7.17-200.fc32.x86_64 |
| QEMU version | 4.2.1-1.fc32.x86_64 |
Virtual machines
I created a virtual machine on which I installed Fedora 32 along with all the packages that I needed for my experiments. Next, I created a second virtual machine by cloning the disk image and machine definition from the first. Finally, I changed the definition of what would become the 1GiB huge page VM to use the following code as part of the machine definition:
<memoryBacking>
  <hugepages/>
</memoryBacking>
Table 2 summarizes the test VM configuration.
| THP | 1GiB SHP | |
| Cores | 14 | 14 |
| Memory size | 12GiB | 12GiB |
| OS | Fedora 32 | Fedora 32 |
| Linux kernel version | 5.7.7-200.fc32.x86_64 | 5.7.7-200.fc32.x86_64 |
| Additional configuration | None | <memoryBacking><hugepages/></memoryBacking> added to XML |
I wanted to avoid over-provisioning the virtualization host, so I allocated only 14 cores to each virtual machine. The virtualization host provides 32 virtual cores. Allocating 14 cores to each VM means that they collectively use 28 cores, leaving 4 cores free for the virtualization host.
With regard to RAM size, 12GiB is more than enough for each of the benchmarks that I ran. Swap space was provisioned, but was never needed.
Benchmarks
I ran many trials of three separate benchmarks on each machine. For each benchmark, I appended either time or benchmark-related output to a benchmark-specific file, which was later analyzed. Prior to this testing, I ran 40 to 50 trials for each benchmark by hand, recording the results in a spreadsheet. However, there was a remarkable degree of variability from one run to the next, which was borne out by a fairly large standard deviation for these early trials. Therefore, in order to obtain statistically meaningful results, a much larger number of trials would have to be run. A back-of-the-envelope calculation for build testing for the GNU Project debugger (GDB) showed that at least 6,000 samples would be needed. In the end, I ran four times this number of trials per machine, resulting in a suitably small margin of error using a 99.99% confidence interval.
Benchmark: Sysbench memory
According to its man page, Sysbench "is a modular, cross-platform and multi-threaded benchmark tool for evaluating OS parameters that are important for a system running a database under intensive load." For database testing, it can test both MySQL and PostgreSQL. But it can also test lower-level system attributes, including fileio, cpu, memory, threads, and mutexes. I was interested in testing memory performance, so I used Sysbench's memory test.
The package name and version that I used for testing was sysbench-1.0.17-4.fc32.x86_64. I experimented with different command-line parameters, settling on this command to use as a benchmark:
$ sysbench memory --memory-block-size=64M --memory-total-size=4096G --time=500 --threads=14 run
I ran this benchmark concurrently, in a loop, on each virtual machine. During my early investigations, I did notice that results would likely be significantly faster if only one virtual machine ran the benchmark at a time. Although it might have been interesting to compare the results of running the benchmark on only one machine at a time, I was more interested in what would happen when both machines had a significant concurrent load. Table 3 summarizes the results.
| THP | 1GiB SHP | |
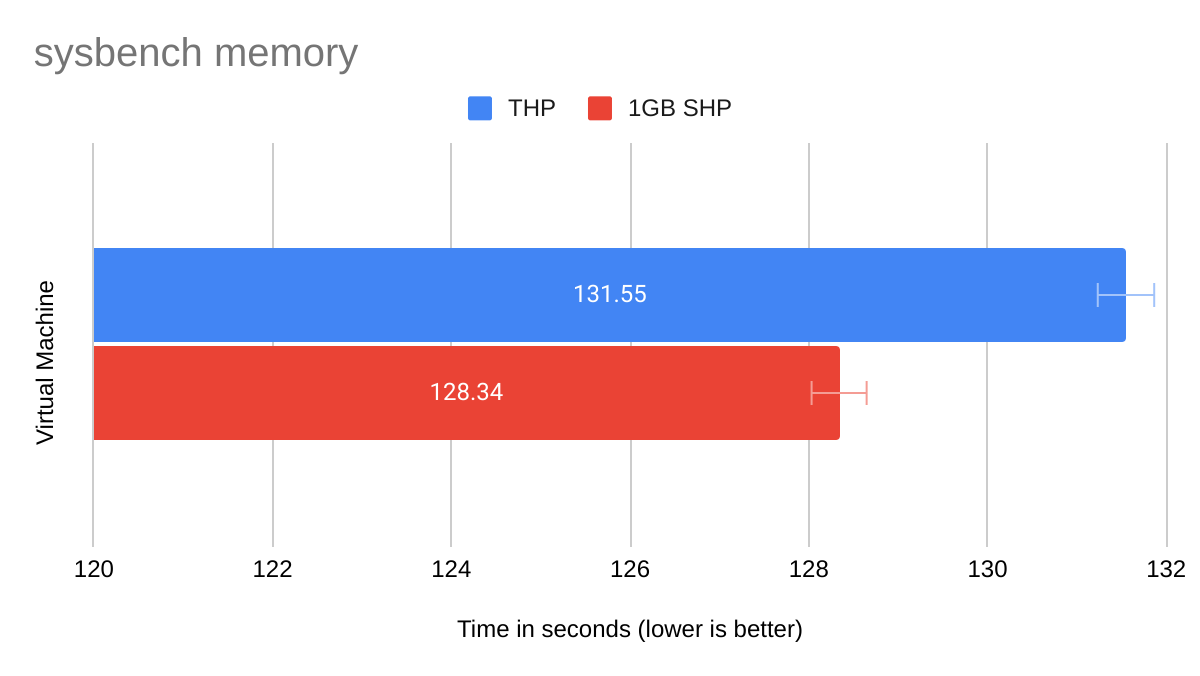
| Mean | 131.55 secs | 128.34 secs |
| Samples | 5000 | 5000 |
| Standard deviation | 4.38 secs | 4.2 secs |
| Min | 102.96 secs | 101.99 secs |
| Max | 148.28 secs | 144.95 secs |
| Confidence level | 99.99% | 99.99% |
| Margin of error | 0.24 secs | 0.23 secs |
On average, the 1GiB SHP virtual machine is faster than the THP virtual machine by 3.21 seconds or 2.4%. Note, too, that the 1GiB SHP VM had lower minimum and maximum times than the THP VM. A comparison of the means is summarized by the bar chart in Figure 1. The error bars show the margin of error for a 99.99% confidence level.
Benchmark: iperf3
The iperf3 tests network throughput. The tool is typically used between different physical interfaces on machines in a network; this is not only to test throughput between machines, but also to check for problems. For instance, on my local network, I once used iperf3 to identify a problem in which a particular network interface locked up when jumbo frames were enabled on all interfaces (and on the network switch).
iperf3 can also be used to check throughput between a virtual machine and its virtualization host. As described later, the GDB-build benchmarking I did took place over NFS, so I thought it would be good to know how much network performance impacted any performance differences for that benchmark.
I used the iperf3-3.7-3.fc32.x86_64 package both on the virtualization host and on each virtual machine.
On the virtualization host, the following command is run; it starts iperf3 as a server that runs until interrupted:
iperf3 -s
On each virtual machine, iperf3 is run as a client that connects to the server:
iperf3 -c virtualization-host
Output from each run was appended to a file that was later analyzed. Specifically, the sender's bandwidth was extracted for analysis. Also, unlike the testing performed for the other benchmarks, iperf3 testing ran on only one virtual machine at a time. (Starting the server as shown earlier allows only one client connection at a time.) Table 4 summarizes the results.
| THP | 1GiB SHP | |
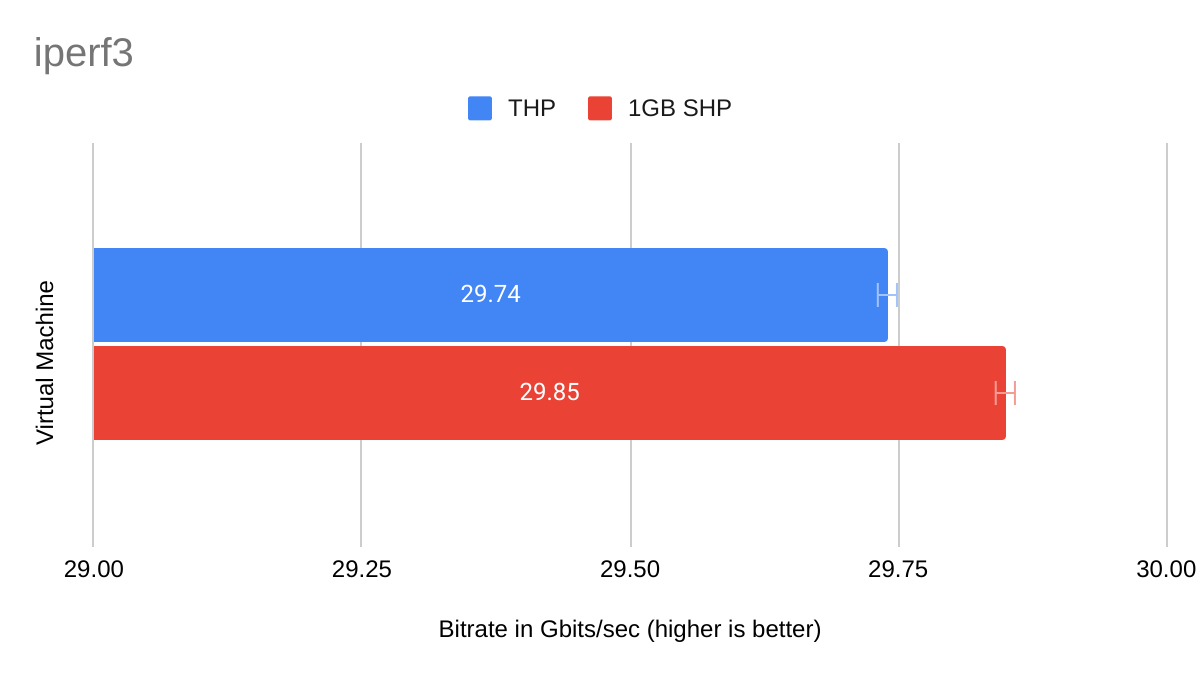
| Mean | 29.74 Gbits/sec | 29.85 Gbits/sec |
| Samples | 37000 | 37000 |
| Standard deviation | 1.58 Gbits/sec | 1.4 Gbits/sec |
| Min | 16.2 Gbits/sec | 18.7 Gbits/sec |
| Max | 33 Gbits/sec | 32.8 Gbits/sec |
| Confidence level | 99.99% | 99.99% |
| Margin of error | 0.03 Gbits/sec | 0.03 Gbits/sec |
This benchmark shows a less compelling result than the Sysbench memory benchmark, with only a 0.11 gigabit per second (or 0.4%) advantage for the 1GiB SHP VM over the THP VM. It's interesting, too, that the THP VM shows a markedly lower minimum (indicating poor performance) but also the highest maximum (indicating better performance). I will note, however, that the 33 gigabit per second maximum was achieved somewhat late during testing. I would not be surprised to see the 1GiB SHP VM also achieve an identical or better maximum result if even more tests were run.
Figure 2 shows the difference in means, with error bars representing a 99.99% confidence level.
Benchmark: GDB build
I work on GDB for my day job, so I'm interested in ways to achieve faster builds of this software project. I was curious to see whether a virtual machine configured to use 1GiB huge pages would build GDB faster than a virtual machine using transparent huge pages.
However, I'm also interested in convenience: I keep GDB source trees on NFS mounted storage and do nearly all builds on NFS mounted storage, as well. I know for a fact that I can achieve faster build times by building on "local" storage. However, I find this less convenient because building on local storage means that build trees are distributed across the local storage of a number of machines, some of which may not be running or even still in existence. So in this case, even though building and testing GDB is faster using local storage, I opt to keep my build trees centralized on an NFS server. For many of the virtual machines that I run, this server is also the virtualization host.
With that configuration in mind, I devised a GDB build benchmark to closely mimic the builds that I actually do as a GDB developer: Both source and build trees are located on an NFS-mounted file system in which the virtualization host is also the NFS server.
After running a suitable top-level configure command, I directed the output of the following time command into a host-specific file for later analysis:
time make -j12
The time command outputs three time values for each command that it times. For this experiment, I was interested only in wall clock (real) time because, as a developer, that's the amount of time that I need to wait for the build to finish.
Table 5 summarizes the results.
| THP | 1GiB SHP | |
| Mean | 147.08 sec | 145.43 sec |
| Samples | 24000 | 24000 |
| Standard deviation | 14.53 sec | 14.42 sec |
| Min | 102.31 sec | 101.25 sec |
| Max | 592.13 sec | 562.92 sec |
| Confidence level | 99.99% | 99.99% |
| Margin of error | 0.36 sec | 0.36 sec |
Table 5 shows that, on average, the 1GiB SHP virtual machine finished its GDB builds 1.65 seconds or 1.1% faster than the THP virtual machine. Both minimum and maximum times were better for the static huge page virtual machine. The maximum times for both machines are really high though; I'll have more to say about that later.
Figure 3 summarizes the difference in means, along with error bars for a 99.99% confidence level:

Do GDB build time samples represent a normal distribution?
Statistical formulae for calculating standard error and margin of error assume that the collected data fit a bell curve shape indicating a normal distribution. I became concerned that the GDB build time samples might not be "normal" because the maximum times for the GDB builds are over 22σ (that is, 22 standard deviations) away from the mean. If these data represent a normal distribution, this is extremely unlikely. For the THP tests, six samples were at least +6σ from the mean and 139 samples were at least +3σ from the mean. For the 1GiB SHP tests, 11 samples were at least +6σ from the mean and 131 samples were at least +3σ from the mean. I am less concerned about the minimum times because all of them are pretty close to within -3σ from the mean.
I wanted to see what the data looked like visually, so I created histograms showing the data for each machine. Figures 4 and 5 show the histograms.
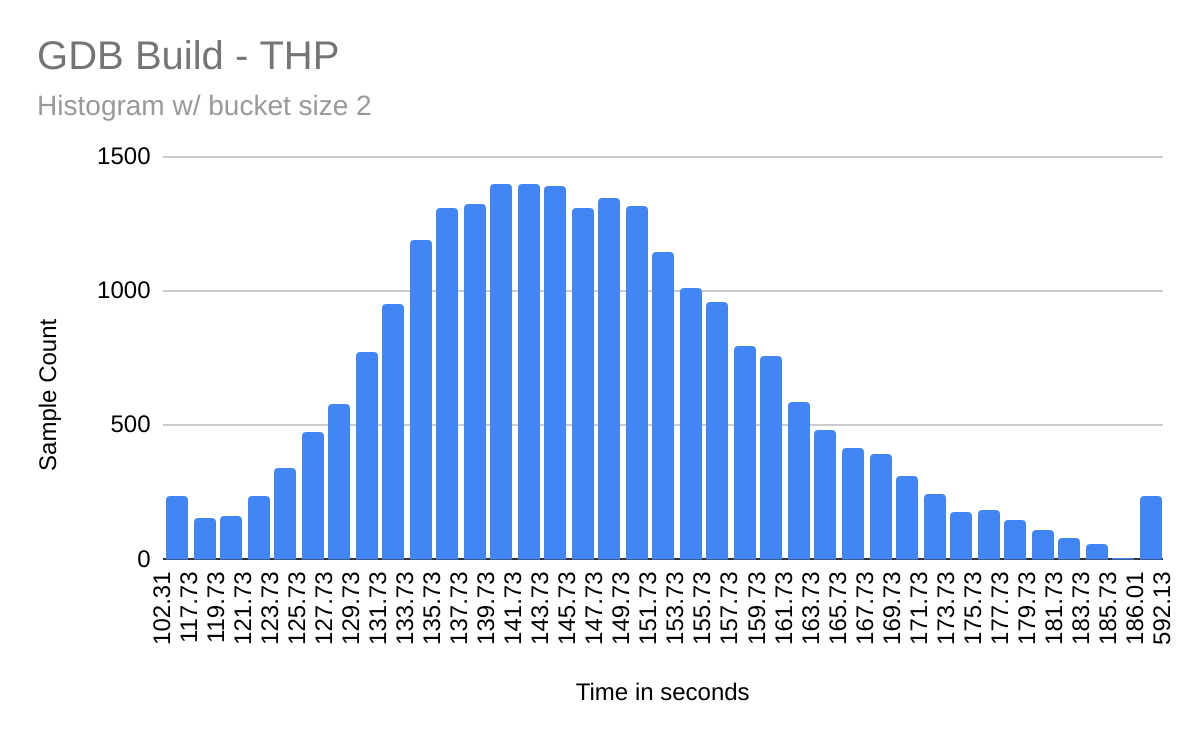

Except for the outliers at each end, these histograms look fairly "normal" to me. I don't have enough knowledge of statistics to say whether the outliers present a problem for the use of statistical formulae to calculate the margin of error.
Why is the standard deviation so large?
The -j flag of Make causes portions of the GDB build to run in parallel. I used -j12, which means that up to 12 different Make-related tasks might run simultaneously. I occasionally watched virt-manager's CPU usage graph as builds were taking place and noticed that, although there were periods of time when all cores were utilized, much of the time they were not. The reason is that Make must wait for various dependencies to complete prior to being able to start another stage of the build. This was most obvious when the compilation of C or C++ files was finishing up prior to running the linker on a group of object files to form an executable or shared object. Running configure scripts for the various subdirectories also has a serializing effect on the build.
During the fast builds, I think it's likely that longer or harder compilations were fortuitously assigned to cores that could achieve a higher boost clock at that moment. If everything meshes just right, Make doesn't need to wait very long before starting the linker. Likewise, a slow build might do just the opposite.
I don't know why the really slow builds—the outliers mentioned earlier—were as slow as they were. Collecting 24,000 samples per machine for the GDB build benchmark alone took over 40 days. The iperf3 and sysbench memory benchmarks required several additional weeks of testing. During this entire time, the virtualization host and each virtual machine were entirely dedicated to benchmark testing and were used for no other purpose. That said, there are occasional system-related tasks—such as checking for software updates—that occur on a regular basis. I didn't disable any of these tasks, nor have I looked at their resource consumption. I still find it astonishing that several of the GDB builds, in which the mean build time is only a minute and 20-some seconds, took over nine minutes to complete!
During my early investigations, I attempted to reduce the standard deviation by making BIOS changes to either underclock or overclock the CPU. I had thought that doing so might cause all cores to run at the same speed, which in turn might result in a more deterministic build behavior. My attempts at disabling the CPU boost were unsuccessful, though, and in hindsight, this was probably for the best.
Conclusion
Each benchmark shows a performance improvement when using 1GiB static huge pages. The iperf3 benchmark showed a tiny 0.4% improvement, while sysbench memory showed a more substantial 2.4% boost in performance. GDB builds were in the middle with a 1.1% improvement in performance.
For a software developer doing dozens of builds per day, that 1.1% improvement from using static huge pages isn't especially exciting, since it decreases the build time by only roughly 1.7 seconds for a two-minute and twenty-some-second build. However, a server dedicated to building software continuously will get more work done per day. Using the hardware and software configuration described in this post, nearly seven additional GDB builds per day can be completed. For a backlogged build machine, this could provide a small, but still welcome, performance improvement.
A drawback of allocating static huge pages at boot time is that they cannot be used for non-huge page allocations. These huge pages can be effectively used if one or more virtual machines are constantly running. On the other hand, if virtual machines (or other applications that might use huge pages) run only occasionally, reserving and not using huge pages means that this memory is unavailable for other purposes. In this case, it is probably better to use the transparent huge page mechanism instead.
I started these experiments because I had seen static huge pages mentioned in the performance tuning sections of several virtualization guides. It wasn't clear to me, however, what performance benefits I might see. Now that I know there is a slight performance benefit for my use case, I plan to allocate static huge pages for virtual machines that I plan to have constantly running. The remainder will continue to use transparent huge pages.
Last updated: February 5, 2024