JBoss Tools 4.14.0 and Red Hat CodeReady Studio 12.14 for Eclipse 4.14 (2019-12) are here and waiting for you. For this release, we focused on improving container-based development, adding tooling for the Quarkus framework, and fixing bugs. We also updated the Hibernate Tools runtime provider and Java Developer Tools (JDT) extensions, which are now compatible with Java 13. Additionally, we made many UI changes to platform views, dialogs, and toolbars.
In these two articles, I introduce the highlights of these new releases and show you how to get started with using them in your Java projects. Keep reading to learn more about the updates and new features in JBoss Tools 4.14.0. In this first article, I focus on these features:
-
- Red Hat OpenShift Container Platform 4.3 compatibility
- OpenShift Application Explorer view
- OpenShift Application Explorer feedback loop
- New tooling for Quarkus
- Preview: Content assistance for Quarkus
- Conclusion
Installation
First, let's look at how to install these updates. Red Hat CodeReady Studio (previously Red Hat Developer Studio) comes with everything pre-bundled in its installer. Simply download the installer from the Red Hat CodeReady Studio product page and run it as follows:
$ java -jar codereadystudio-<installername>.jar
On the other hand, installing JBoss Tools 4.14.0—aka "bring-your-own Eclipse (BYOE) CodeReady Studio"—requires a bit more effort. This release requires at least Eclipse 4.14 (2019-12), but we recommend installing the latest Eclipse 4.14 2019-12 Java EE bundle. Installing the newest bundle ensures you get the most current Java dependencies.
Once you have Eclipse 4.14 (2019-12) or higher installed, you can open the Eclipse Marketplace tab and look for either JBoss Tools or Red Hat CodeReady Studio. Alternatively, you could download JBoss Tools 4.14.0 directly from our update site.
OpenShift Container Platform 4.3 compatibility
JBoss Tools is now compatible with OpenShift Container Platform (OCP) 4.3. You can now access the new release in JBoss Tools by defining your connection to an OpenShift Container Platform 4.3 cluster, just as you did before for an OpenShift Container Platform 3 cluster.
OpenShift Application Explorer view
We've also added a new OpenShift Application Explorer view, in addition to the standard OpenShift Explorer. Based on OpenShift Do (odo), the new view simplifies user experience and introduces feedback loops and an improved debugging console.
To see the new view in action, open your JBoss Tools 4.14.0 workspace. You should see OpenShift Application Explorer in the list of views available on the bottom part of the screen, as shown in Figure 1.

If the view is not automatically listed, you can find it using Window -> Show View -> Other. From the Other window, type open in the provided textbox, then select OpenShift Application Explorer from the JBoss Tools drop-down list, as shown in Figure 2.
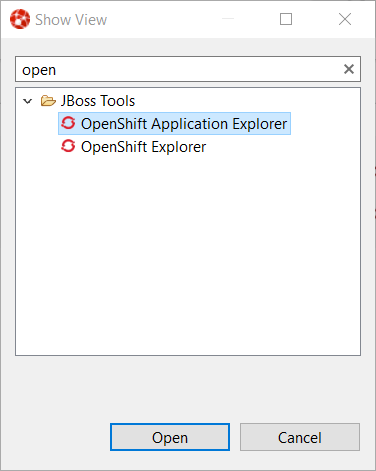
You'll see OpenShift Application Explorer in a new tab, as shown in Figure 3.

Expanding the root node will display the list of projects available on the OpenShift Container Platform cluster, as shown in Figure 4.

OpenShift Application Explorer feedback loop
We also added a new feedback loop feature, which gives you fast feedback on code changes. To best understand this feature, it helps to create a sample application. Once you have created the sample application, continue here.
Now that you have the new OpenShift Application Explorer open and running let's try it out with an example application.
Develop a Java-based microservice with JBoss Tools 4.14.0
In this section, I'll show you how to use OpenShift Container Platform 4.3 and the new OpenShift Application Explorer in JBoss Tools 4.14.0. We'll use these tools to develop a Java-based microservice.
Before we start working on the application, we need to load the component source code into our workspace. To start, click Ctrl+N and select the Launcher project wizard from the drop-down list, as shown in Figure 5.
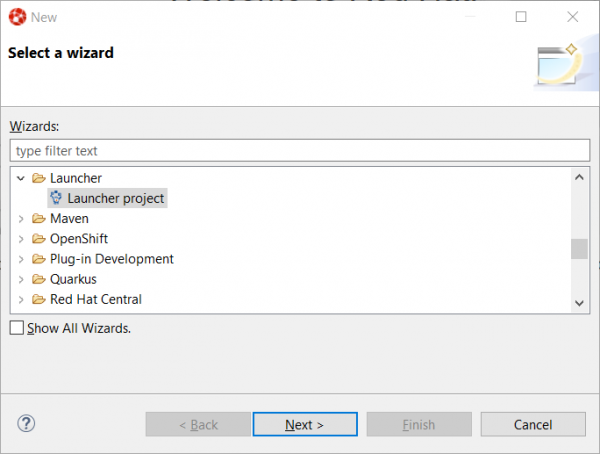
Click Next, then enter the following information in the given fields:
- Type
rest-httpin the Mission field. - Type
vert.x communityin the Runtime field. - Type
myservicein the Project name field.
Figure 6 shows these entries.

Click Finish to add the new project to your workspace. Once the dependencies are resolved, we can start playing with the cluster.
Step 1: Create a new microservices component
The first thing we'll do is create the microservices component. From OpenShift Application Explorer, right-select myproject, then click New -> Component. This action will lead you to the Create a component window shown in Figure 7.

In the Name field, enter myservice, then click the Browse button to select the new project you've just created. In the Component type field, select java. In the Component version field, select 8. Finally, enter myapp in the Application field, then uncheck the Push after create checkbox. All of these selections are shown in Figure 8.

Click Finish to create the component, then expand the project node to view the application. That view is shown in Figure 9.

Expanding the application displays the new component, as shown in Figure 10.

Step 2: Build and deploy the component
We've created the myservice component, but note that we unchecked the Push after create checkbox. We'll have to deploy the component on our cluster manually. Deploy it by right-selecting the component and clicking the Push button. OpenShift Container Platform will create the deployment and launch a build.
Once that's done, you'll see a new window created in the Console view. After a while, you should see the output in Figure 11.

Step 3: Define a URL
The component is now deployed to the cluster, but we cannot yet access it. Our next step is to define a URL that allows us to access the component externally. Right-select the component and click New -> URL, as shown in Figure 12.

Enter url1 in the Name field and select 8080 in the Port field, as shown in Figure 13.
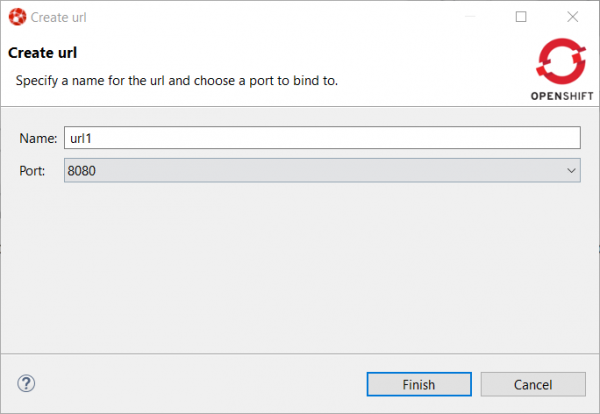
Now click Finish.
Step 4: Synchronize the configuration
We have created the URL, but it's not yet live on the OpenShift Container Platform cluster. Pushing the component out again will synchronize the local configuration with the configuration on the cluster. In Figure 14, a message in the Console view informs us that the push is required.

To push the component out again, click component -> Push.
Step 5: Test the new microservice
Let's check that we can now access the service. Expanding the component to one more level lets us see the URL we've just created, as shown in Figure 15.

Right-select the URL and click Open in Browser. You should now see a new browser window, as shown in Figure 16.

To test the service, enter demo in the text box, then click Invoke. You'll see a new screen for the service, as shown in Figure 17.

With just a few configurations, we have a new microservice up and running on OpenShift Container Platform. Next, I'll introduce two additional features available in OpenShift Application Explorer: A feedback loop that lets you quickly see the results of code changes, and the new debugging console.
Create the feedback loop
Now that we have an example application to work with, we can explore the new feedback loop in OpenShift Application Explorer. Let's modify the example application's code and try it out.
In the Project Explorer tab, locate the HttpApplication.java file, which is shown in Figure 18.

Double-click on the file to open it in a new editor window, as shown in Figure 19.

On line 14, change:
protected static final String template = "Hello, %s!";
to:
protected static final String template = "Hello, %s!, we modified the code";
When you're done, press Ctrl+S to save the file.
Now, right-click the service component (myservice) and click Push. Doing this sends your changes to the cluster, where the component will be rebuilt with your code changes. After a few seconds, the component will be available again, as shown in Figure 20.

Return to the browser window and refresh it. Enter demo1 in the textbox (changing the value in this field avoids reloading the cached version), then click Invoke. Figure 21 shows the resulting screen.
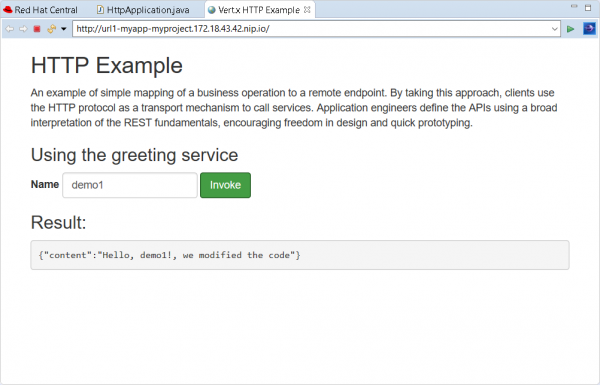
While our change was straightforward, it's enough to demonstrate the new feedback loop. We were able to modify the code for our example microservice, synchronize the changes with a push to the cluster, and then get rapid feedback by simply refreshing the service in a browser.
Note: If you don't want to manually push code changes back to the cluster, you could opt to automatically synchronize to the cluster with a watch action. If you set a watch action, a new build will be launched automatically on the cluster each time you change the code on your workstation.
Test the feedback loop in the debugging console
Testing an application with a quick feedback loop is a great achievement, but for more complex applications, we also need to understand how the code behaves. In this section, we'll use OpenShift Application Explorer's debugging console to debug the application live on the cluster.
To start, we'll set a breakpoint in the application code. Select the HttpApplication.java file, then scroll down to the greeting() method, which is shown in Figure 22.

Find line 41, then double-click that number in the left-hand ruler column. Doing that sets the breakpoint, as shown in Figure 23.

We are now ready to debug the application. To start, we need to launch a local debugger (a Java debugger, in this case), which will connect to our application on the cluster. Right-select myservice in the console, then click Debug. As shown in Figure 24, this initiates port forwarding, which will allow our local debugger to connect to the remote Java virtual machine (JVM).

Next, we'll check that we can debug the application. Select the browser window again, enter demo2 in the textbox, and click Invoke. When the debugger hits the breakpoint at line 41, you'll be asked if you want to switch to the Debug perspective, as shown in Figure 25. (Note that you might not see this message if you've previously selected the Remember my decision option.)

When you click the Switch button, you will see the Debug perspective, as shown in Figure 26.

You can now debug the Java component running on a remote cluster in the same way that you would if it was running locally on your workstation.
Note: We used a Java-based component for this example, but JBoss Tools also supports the debugging console for Node.js-based components.
New tooling for Quarkus
With JBoss Tools 4.14.0, we've also added new tooling for applications built on top of the supersonic, subatomic Java-based framework, Quarkus. In this section, we'll set up and debug an example application using the new tools.
Step 1: Create a new Quarkus project
We've added a wizard for creating a new Quarkus application project in your JBoss Tools workspace. To get started with it, click Ctrl+N to get the list of available wizards, shown in Figure 27.

In the text box, enter qu. Doing this filters the list of wizards for Quarkus, as shown in Figure 28.
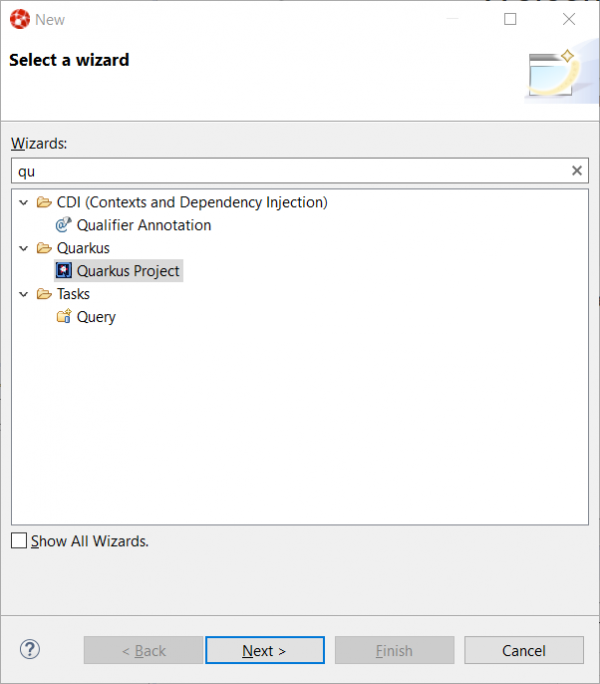
After you select the Quarkus Project wizard, click the Next button. This leads to the Project type screen shown in Figure 29.

This screen invites you to choose either Maven or Gradle for managing your project. We'll use Maven for this example.
After you've selected Maven, enter a project name (code-with-quarkus), then click Next. The dialog shown in Figure 30 asks you to define project coordinates such as group ID, artifact ID, and the version number for your application, as well as information about your REST endpoint. Defaults are already filled in, so we can just accept these and click Next.

Then, you'll be asked to select the Quarkus extensions you want for your project. As shown in Figure 31, the extensions are grouped by category. We'll select the Web category.

Now, you see the list of extensions shown in Figure 32. If you want to add an extension, double-click on it.
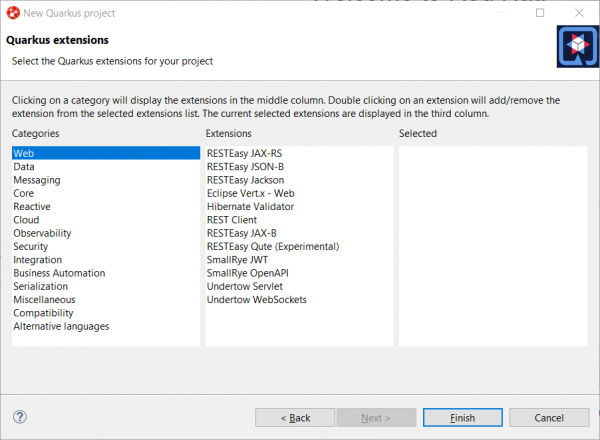
As shown in Figure 33, we'll select the RESTEasy JAX-RS and RESTEasy Qute extensions. (Note that RESTEasy Qute is a templating engine.)

You should see that the extensions you've selected have been added to the table on the far-right side of the screen. If you want to remove an extension from your list, just double-click it again in either of the tables where it appears.
We're done setting up the project, so click Finish. The project will be launched, and its dependencies will be retrieved. After a while, you'll see the new project in your Project Explorer view, as shown in Figure 34.

We've successfully created a new Quarkus project. Next, I'll show you how to build and run the Quarkus application.
Step 2: Build and run the Quarkus application
Select Run-->Run Configurations… to display the dialog shown in Figure 35.

Scroll down to Quarkus Application and select that option, as shown in Figure 36.

Select the New configuration option, as shown in Figure 37.

Next, you need to associate a workspace project with the configuration, so click Browse. You will see a single project, as shown in Figure 38.

Because the workspace contains a single project, it has been automatically selected. Click OK, and you will move to the dialog shown in Figure 39.

The configuration needs to be built before we can use it, so start that process by clicking Run. The new Console view shows the build output, as displayed in Figure 40.

At this point, the application is being built. After a while, it will be started. Figure 41 shows the remaining build output.

Step 3: Debug the Quarkus application
Debugging a Quarkus application is simple: All we need to do is launch the new configuration we've just created in Debug. Select the Run -> Debug Configurations menu option, then click Debug.
Doing this connects a remote JVM debug configuration to your running Quarkus application. If you've set breakpoints in your application code (like we did in the Java microservices demo), then the execution will automatically stop on the first breakpoint.
Preview: Content assistance for Quarkus
I've shown you how to create, run, and debug a Quarkus application using the new tooling features introduced in JBoss Tools 4.14.0. I also want to introduce a feature that is scheduled for integration with our next JBoss Tools release: Content assistance with the application.properties file. that you can begin experimenting with now.
The application.properties file
Every Quarkus application is configured using the application.properties file. The content of application.properties depends on the Quarkus extensions you've selected for your application. Some settings are mandatory, and some are not. The possible values for each setting are specific to its nature; for instance, you might have boolean, integer, or a limited set of values (enumerations).
As a developer, it's up to you to study the guides and documentation for your project and its extensions. Starting with JBoss Tools 4.14.0, you can also find content assistance for specific files under Quarkus Tools. Content assistance is provided for tools that validate the content of your application.properties files, and that feature provides possibly setting names and values.
To see the new content assistance feature in action, go to src/main/resources/application.properties in the example project we just created. Right-click the application.properties file and select Open With -> Generic Text Editor. The Text Editor view is shown in Figure 42.

Go to the third line of the file shown in Figure 43 and enter Ctrl+Space. Doing this invokes code completion, as shown in Figure 43.

Mouse over a setting to display its documentation. As an example, try adding quarkus.http.port to the application.properties file, then mouse over it. The resulting documentation is shown in Figure 44.

If you enter a wrong value, such as entering false instead of a numeric value, the content assistant will highlight the error, as shown in Figure 45.

The new content assistant is the first of a set of features that will be integrated into the next version of JBoss Tools. We encourage you to use it, and if you find we're missing features or enhancements, don't hesitate to report them using the JBoss Tools issue tracker.
Conclusion
These are only some of the new and updated features available through JBoss Tools 4.14.0 and Red Hat CodeReady Studio 12.14 for Eclipse 4.14 (2019-12). This article addressed the features related to OpenShift Container Platform, OpenShift Application Explorer, and Quarkus. The next article will focus on:
- Hibernate Tools updates.
- Forge, JST, and VPE last updates before deprecation.
- Platform changes to views, dialogs, and toolbars.
- Many general updates.
