It is a common practice to test software from the user's perspective before releasing it. With this assumption, I have set out on a quest to find a VS Code extension with automated end-to-end tests. My quest ended in failure. Naturally, a lazy person like me then asked: "Why would nobody try to automate this?" It turns out that automating this was, in fact, quite difficult.
My quest then became finding a solution that would enable developers to do just the thing. It is my pleasure to announce that no more hours need be wasted on this menial, manual activity. Enter the aptly named vscode-extension-tester: A framework that lets you create automated tests for your VS Code extensions and launch them with ease. All you need is an npm package.
How it works
VS Code is based on Electron, so it is a web application. Hence, the idea was to automate the tests using the Selenium WebDriver. For that purpose, we needed to:
-
- Download the appropriate version of ChromeDriver, which meant knowing the version of Chromium packaged inside the Electron browser our VS Code uses.
- Add ChromeDriver to our PATH.
- Choose the appropriate VS Code binary (which is different in every OS).
- Set up our VS Code to run the tests properly. We cannot, for instance, use the native title bar.
- Download another instance of VS Code just for testing. (We do not want to mess up the instance of VS Code we actually use.)
- Build our extension.
- Install the extension into the new instance.
Finally, we were all set to begin writing our tests, but Figure 1 shows what we would have had to sift through in order to push a button and open a view:
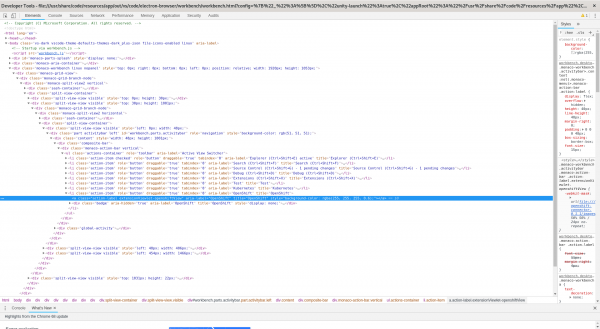
Figure 1: The mass of VS Code DOM contents we would have to sift through. That’s 15 layers of block elements just to find an icon representing a view container, which is quite a tall order to find a simple element. You can imagine what the rest of the DOM looks like.But enough scare tactics, we are here to make testing exciting. Almost as exciting as coding itself, because we are turning testing into coding. Let’s see how easy all of this becomes once we employ the
vscode-extension-testerframework.Making it simple
To demonstrate, we will take an extension and create end-to-end tests for it using our framework. As a first step, I like to use something simple, like the
helloworldsample extension from Microsoft’s extension samples repo. This extension contributes a new command calledHello Worldthat shows a notification sayingHello World!Now we need to write tests to verify that the command works properly.
Figure 2: The Hello World command: Enlarge to play. Getting the dependencies
First, we need to get the necessary dependencies. To start, we need the Extension Tester itself, along with the test framework it integrates into: Mocha. We can get both from the
npmregistry:$ npm install --save-dev vscode-extension-tester mocha @types/mocha
I will also use Chai for assertions. You can use whichever assertion library you like:
$ npm install --save-dev chai @types/chai
Setting up the test
Now that we have our dependencies installed, we can start putting all the pieces together. Let us start by creating a test file. Our test files will rest in the
src/ui-testfolder, but you can use any path that is covered by your tsconfig, because we will write our tests in TypeScript just like the rest of the extension. Let’s go ahead and create the folder we chose and create a test file inside. I will call minehelloworld-test.ts. Our file structure should now look like Figure 3: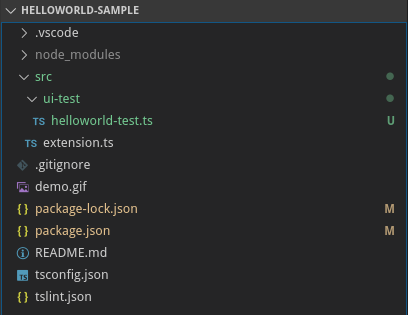
Figure 3: Our beginning file structure. Next, we need a way to launch our tests. For that purpose, we create a new script in our
package.jsonfile. Let’s call our new scriptui-test, and use the CLI that comes with the Extension Tester, calledextest. For this demo, we want to use the default configuration with the latest version of VS Code, the default settings, and the default storage location (which we will come back to momentarily).We also want to perform all of the setup and then run our tests within a single command. For that purpose, we can use the
setup-and-runcommand that takes the path to our test files as an argument in the form of a glob. Note that we cannot use the original.tsfiles to launch the tests. Instead, we need to use the compiled.jsfiles, which in this case are located in theout/folder. The script will then look something like this:"ui-test": "extest setup-and-run out/ui-test/*.js"
It is also important to compile our tests before attempting to run them, which we can do along with the rest of the code. For that purpose, this extension has a compile script we can use. The final script will then look like this:
"ui-test": "npm run compile && extest setup-and-run out/ui-test/*.js"
Setting up the build
Now is the time to talk about the importance of the storage folder I mentioned earlier. This is where the framework stores everything it needs for the tests to run, including a fresh instance of VS Code, the ChromeDriver binary, and potentially screenshots from failed tests. It is imperative to exclude this folder from compilation and
vscepackaging. Otherwise, you are bound to run into build errors. We also recommend adding the storage folder into your.gitignorefile. By default, this folder is calledtest-resources, and is created in the root of your extension repository.First, let us exclude the folder from compilation. We need to open the
tsconfig.jsonfile and add the storage folder into the"exclude"array. This is what my tsconfig now looks like:{ "compilerOptions": { "module": "commonjs", "target": "es6", "outDir": "out", "sourceMap": true, "strict": true, "rootDir": "src" }, "exclude": ["node_modules", ".vscode-test", "test-resources"] }With that code, our extension should not run into build errors with the folder present. Next, we need to make sure the folder is not included in the final
.vsixfile when we package the extension. For that purpose, we can utilize the.vscodeignorefile. Let's go ahead and create one in the root of our repository if it doesn’t already exist. Then, put the folder into it just like we would with.gitignore, as shown in Figure 4: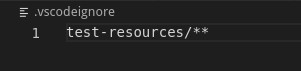
Figure 4: Excluding the test-resources directory from packaging. With these three simple steps completed, we are ready to dive into writing our tests. If you wish to get additional information about the test setup, check out the framework’s wiki.
Writing the tests
Remember that dreadful screenshot from the VS Code DOM? If you are familiar with WebDriver testing, you know how tedious it can become when the element structure is that complex.
Introducing page objects
Luckily, we do not need to bother ourselves with the DOM now. The Extension Tester framework brings us a comprehensive Page Object API.
Each type of component in VS Code is represented by a particular typescript class and can be manipulated by a set of easy-to-understand methods. We recommend going through the page objects quick guide to get an understanding of what each object represents in the browser. Additionally, each object extends the vanilla WebDriver’s WebElement, so you can use plain WebDriver code to your heart’s desire.
Back to the test at hand
First, we need to create a test suite and a test case using the Mocha BDD format. The first step of our test case is to execute the command
Hello World. For that purpose, we can use theWorkbenchclass and itsexecuteCommandmethod. Our test file now looks a bit like this:import { Workbench } from 'vscode-extension-tester'; describe('Hello World Example UI Tests', () => { it('Command shows a notification with the correct text', async () => { const workbench = new Workbench(); await workbench.executeCommand('Hello World'); }); });Simple, isn't it? Now, we need to assert that the correct notification has appeared. This command will take time to execute and display the result, so we cannot do this assertion straight away. Therefore, we use WebDriver to wait for the notification to appear. For that, we need a suitable wait condition.
Our wait condition needs to view the currently displayed notifications and return the notification that matches our needs. In this case, the notification would be one that contains, say, the text
Hello. If no such condition is found, do not return anything (return undefined). This way, the wait will terminate once the first truthy value is returned:async function notificationExists(text: string): Promise<Notification | undefined> { const notifications = await new Workbench().getNotifications(); for (const notification of notifications) { const message = await notification.getMessage(); if (message.indexOf(text) >= 0) { return notification; } } }With this condition set up, we now start waiting. To do this, we need a reference to the underlying WebDriver instance. We can get that reference from the
VSBrowserobject, which is the entry point to the Extension Tester API. We will use thebeforefunction to initialize the WebDriver instance before the tests run by adding the following lines to the beginning of our suite:let driver: WebDriver; before(() => { driver = VSBrowser.instance.driver; });Initiating the wait is now as simple as this:
const notification = await driver.wait(() => { return notificationExists('Hello'); }, 2000) as Notification;Note the cast at the end. Our wait condition may return undefined, and we need to work with a
Notificationobject.The last step is to assert that our notification has the correct attributes by checking if the notification has the correct text, and is of an
infotype. Using Chai'sexpectto accomplish this task looks like this:expect(await notification.getMessage()).equals('Hello World!'); expect(await notification.getType()).equals(NotificationType.Info);At this point, our first test is finished. The whole test file should look as follows:
import { Workbench, Notification, WebDriver, VSBrowser, NotificationType } from 'vscode-extension-tester';
import { expect } from 'chai';

describe('Hello World Example UI Tests', () => {
    let driver: WebDriver;

    before(() => {
        driver = VSBrowser.instance.driver;
    });

    it('Command shows a notification with the correct text', async () => {
        const workbench = new Workbench();
        await workbench.executeCommand('Hello World');
        const notification = await driver.wait(() => { return notificationExists('Hello'); }, 2000) as Notification;

        expect(await notification.getMessage()).equals('Hello World!');
        expect(await notification.getType()).equals(NotificationType.Info);
    });
});

async function notificationExists(text: string): Promise<Notification | undefined> {
    const notifications = await new Workbench().getNotifications();
    for (const notification of notifications) {
        const message = await notification.getMessage();
        if (message.indexOf(text) >= 0) {
            return notification;
        }
    }
}
Launching the tests
All that is left now is to launch our tests. To do that, we can head to our favorite terminal and launch the script we created during the setup phase:
$ npm run ui-test
Now we can watch as the tooling runs the setup for us automatically:
[video width="1920" height="1080" webm="https://developers.redhat.com/blog/wp-content/uploads/2019/11/extest_screencast.webm"][/video]
Our test run was a success: We verified our extension's feature works. And best of all, we do not need to do all of this work manually anymore.
Learning more
If you wish to learn more about using the Extension Tester, be sure to visit the GitHub repository or the npm registry page. The wiki, in particular, might be of interest.
To find detailed descriptions of all the steps we have gone through in this article, see the links below:
Interested in the sample project we used in this article? Check out its code in the sample projects section, complete with commented tests.
We also already have a few working test suites for real extensions (not just example ones). Feel free to take a look for inspiration:
- The Apache Camel extension test suite.
- Fuse tooling's UI test tooling, extending the Extension Tester.
- Extension Tester's own test suite, which covers almost every available page object.
If you would like to get involved, check out the Contributor's guide. We are always happy to see your feedback and suggestions, or indeed your code contributions.


