Redhat Developers  Logo
  • Products

    Featured

    • Red Hat Enterprise Linux
      Red Hat Enterprise Linux Icon
    • Red Hat OpenShift AI
      Red Hat OpenShift AI
    • Red Hat Enterprise Linux AI
      Linux icon inside of a brain
    • Image mode for Red Hat Enterprise Linux
      RHEL image mode
    • Red Hat OpenShift
      Openshift icon
    • Red Hat Ansible Automation Platform
      Ansible icon
    • Red Hat Developer Hub
      Developer Hub
    • View All Red Hat Products
    • Linux

      • Red Hat Enterprise Linux
      • Image mode for Red Hat Enterprise Linux
      • Red Hat Universal Base Images (UBI)
    • Java runtimes & frameworks

      • JBoss Enterprise Application Platform
      • Red Hat build of OpenJDK
    • Kubernetes

      • Red Hat OpenShift
      • Microsoft Azure Red Hat OpenShift
      • Red Hat OpenShift Virtualization
      • Red Hat OpenShift Lightspeed
    • Integration & App Connectivity

      • Red Hat Build of Apache Camel
      • Red Hat Service Interconnect
      • Red Hat Connectivity Link
    • AI/ML

      • Red Hat OpenShift AI
      • Red Hat Enterprise Linux AI
    • Automation

      • Red Hat Ansible Automation Platform
      • Red Hat Ansible Lightspeed
    • Developer tools

      • Red Hat Trusted Software Supply Chain
      • Podman Desktop
      • Red Hat OpenShift Dev Spaces
    • Developer Sandbox

      Developer Sandbox
      Try Red Hat products and technologies without setup or configuration fees for 30 days with this shared Openshift and Kubernetes cluster.
    • Try at no cost
  • Technologies

    Featured

    • AI/ML
      AI/ML Icon
    • Linux
      Linux Icon
    • Kubernetes
      Cloud icon
    • Automation
      Automation Icon showing arrows moving in a circle around a gear
    • View All Technologies
    • Programming Languages & Frameworks

      • Java
      • Python
      • JavaScript
    • System Design & Architecture

      • Red Hat architecture and design patterns
      • Microservices
      • Event-Driven Architecture
      • Databases
    • Developer Productivity

      • Developer productivity
      • Developer Tools
      • GitOps
    • Secure Development & Architectures

      • Security
      • Secure coding
    • Platform Engineering

      • DevOps
      • DevSecOps
      • Ansible automation for applications and services
    • Automated Data Processing

      • AI/ML
      • Data Science
      • Apache Kafka on Kubernetes
      • View All Technologies
    • Start exploring in the Developer Sandbox for free

      sandbox graphic
      Try Red Hat's products and technologies without setup or configuration.
    • Try at no cost
  • Learn

    Featured

    • Kubernetes & Cloud Native
      Openshift icon
    • Linux
      Rhel icon
    • Automation
      Ansible cloud icon
    • Java
      Java icon
    • AI/ML
      AI/ML Icon
    • View All Learning Resources

    E-Books

    • GitOps Cookbook
    • Podman in Action
    • Kubernetes Operators
    • The Path to GitOps
    • View All E-books

    Cheat Sheets

    • Linux Commands
    • Bash Commands
    • Git
    • systemd Commands
    • View All Cheat Sheets

    Documentation

    • API Catalog
    • Product Documentation
    • Legacy Documentation
    • Red Hat Learning

      Learning image
      Boost your technical skills to expert-level with the help of interactive lessons offered by various Red Hat Learning programs.
    • Explore Red Hat Learning
  • Developer Sandbox

    Developer Sandbox

    • Access Red Hat’s products and technologies without setup or configuration, and start developing quicker than ever before with our new, no-cost sandbox environments.
    • Explore Developer Sandbox

    Featured Developer Sandbox activities

    • Get started with your Developer Sandbox
    • OpenShift virtualization and application modernization using the Developer Sandbox
    • Explore all Developer Sandbox activities

    Ready to start developing apps?

    • Try at no cost
  • Blog
  • Events
  • Videos

Tracing Kubernetes applications with Jaeger and Eclipse Che

November 14, 2019
Gary Brown
Related topics:
IDEsKubernetes
Related products:
Developer Tools

Share:

    Developing distributed applications is complicated. You can wait to monitor for performance issues once you launch the application on your test or staging servers, or in production if you’re feeling lucky, but why not track performance as you develop? This allows you to identify improvement opportunities before rolling out changes to a test or production environment. This article demonstrates how two tools can work together to integrate performance monitoring into your development environment: Eclipse Che and Jaeger.

    According to the Eclipse Che website:

    "Che brings your Kubernetes application into your development environment and provides an in-browser IDE, allowing you to code, build, test, and run applications exactly as they run on production from any machine."

    In this article, we show how simple it is to add Jaeger to your Eclipse Che development workspace and observe how your Kubernetes application performs. We will use che.openshift.io as the hosting environment, although you could set up a local Che server if you prefer.

    Create the workspace

    Che 7 introduced the capability to define a development workspace in a YAML format called a devfile. Example devfiles can be found in the Red Hat Developers GitHub.

    For this post, we use a modified version of the Spring Boot getting started devfile, which adds the Jaeger all-in-one backend to the workspace. The main change is to add the following section just before the commands top-level node:

    -  
        type: dockerimage  
        alias: tracing  
        image: jaegertracing/all-in-one:latest  
        env:  
          - name: MEMORY_MAX_TRACES  
            value: "5000"  
          - name: COLLECTOR_ZIPKIN_HTTP_PORT  
            value: "9411"  
        memoryLimit: 128Mi  
        endpoints:  
          - name: 'tracing-ui'  
            port: 16686  
          - name: 'collector-grpc'  
            port: 14250  
            attributes:  
               public: 'false'  
          - name: 'collector-http'  
            port: 14268  
            attributes:  
               public: 'false'  
          - name: 'collector-zipkin'  
            port: 9411  
            attributes:  
               public: 'false'  
          - name: 'agent-config'  
            port: 5778  
            attributes:  
               public: 'false'  
          - name: '6831/udp'  
            port: 6831  
            attributes:  
               public: 'false'  
          - name: '6832/udp'  
            port: 6832  
            attributes:  
               public: 'false'  
        volumes:  
          - name: tmp  
            containerPath: /tmp
    

    The fully modified version of the devfile can be found here, with the additional memory limit changes required for using che.openshift.io.

    To start the workspace on che.openshift.io, point a browser to this url. Chrome is recommended due to issues on some versions of Firefox.

    Add OpenTracing instrumentation

    When the workspace is initially opened, the application has no OpenTracing instrumentation, as you can see in Figure 1:

    The initial workspace

    Figure 1: The initial workspace.">

    OpenTracing instrumentation can implicitly be added by including a dependency on opentracing-spring-jaeger-cloud-starter (shown in the updated pom.xml file in Figure 2), along with updating the spring-boot-starter-parent version to 2.2.0.RELEASE (which is required by the OpenTracing instrumentation):

    OpenTracing

    Figure 2: Adding the OpenTracing instrumentation.">

    This dependency automatically instruments the inbound and outbound HTTP requests. It also bootstraps the Jaeger tracer to report the tracing data to the Jaeger back end (included in the workspace). The default tracer configuration will report the data via UDP to the Jaeger agent, although the application can be configured to report the data via HTTP directly to the collector.

    The final step is to add a property that defines the service name within the tracing data. This goal is achieved by creating the src/main/resources folder and then creating the file application.properties with the contents shown in Figure 3:

    Figure 3: Defining the service name within the tracing data.">

    Trace the running application

    On the right side of the workspace is a cube symbol. When selected, this icon expands a tree. Under the User Runtimes/tools tree node is a task called run webapp. Selecting this option will run the Spring Boot application. When it starts, a window appears with the button Open Link as shown in Figure 4. Press this button to start a browser for the application.

    Figure 4: Opening a browser for the application.

    Figure 4: Opening a browser for the application.">

    In the same tree, select the User Runtimes/tracing option tracing-ui, which launches the Jaeger UI in a separate browser tab as shown in Figure 5:

    Launching a new browser tab for tracing

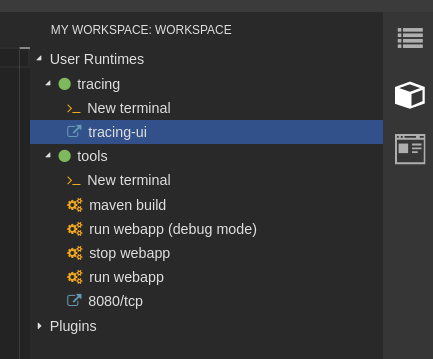
    Figure 5: Launching a new browser tab for tracing.">

    Press the refresh button at the top of the browser a couple of times to see the text Span reported in the console window, as shown at the bottom of Figure 6:

    Running application with console log showing spans being reported

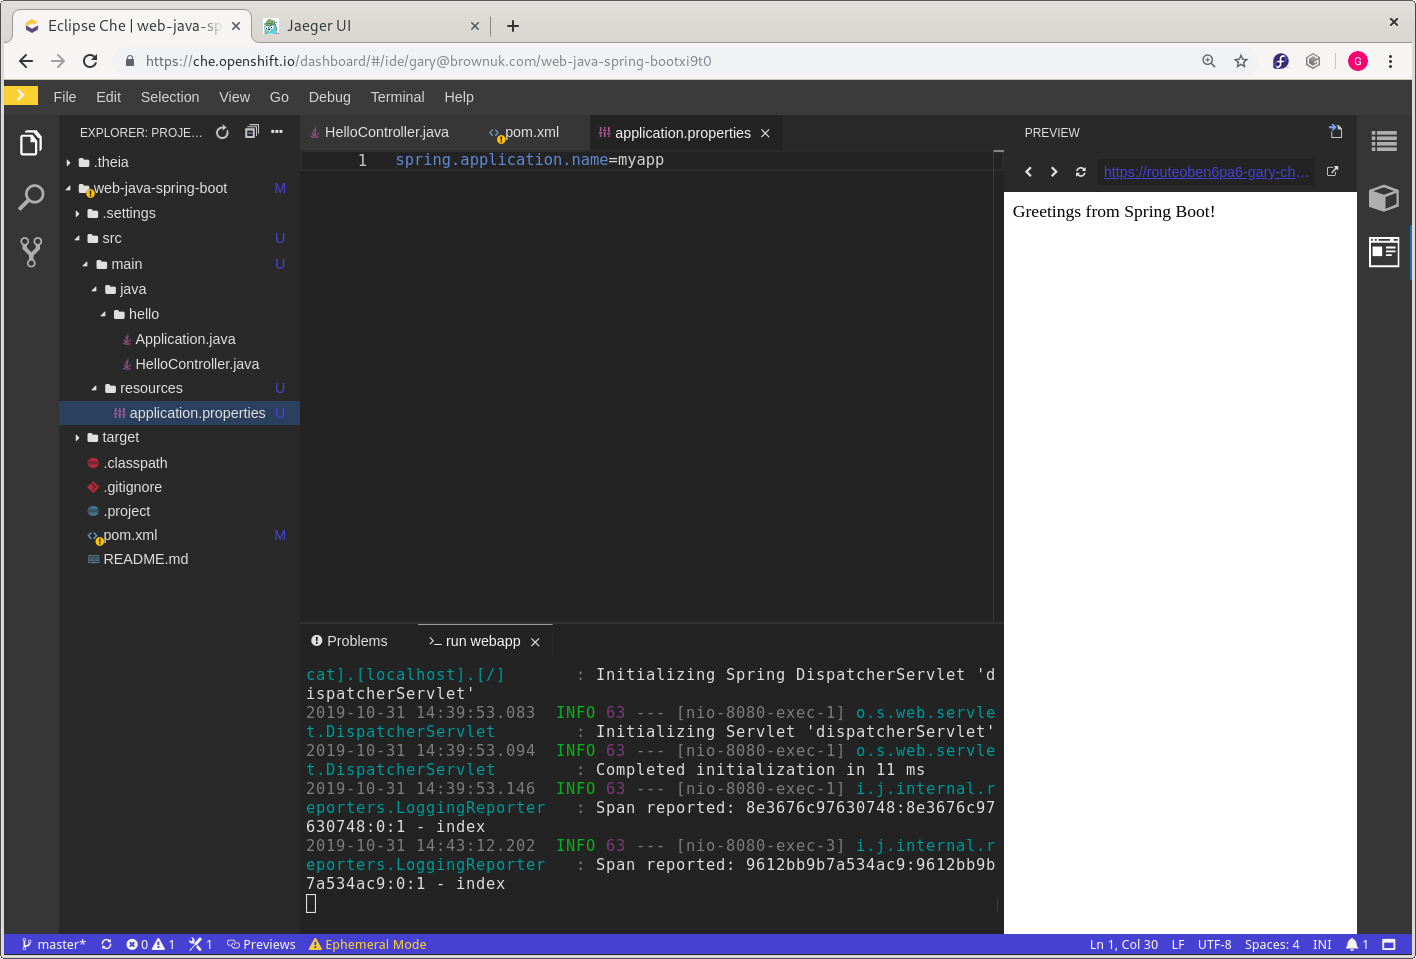
    Figure 6: Running application with console log showing spans being reported.">

    Change to the Jaeger UI tab to see the resulting traces that were reported from the application, as shown in Figures 7 and 8:

    Figure 7: The completed traces.

    Figure 7: The completed traces.">

    Details for the first completed trace

    Figure 8: Details for the first completed trace.">

    Summary

    This article has shown how OpenTracing with Jaeger can easily be introduced into an Eclipse Che workspace so you can obtain tracing information from applications during development.

    This particular example is simple and only captures tracing from a single service. The benefit offered by Che is enabling complete applications (multiple services) to be used within the same workspace, thus producing more interesting traces and helping developers understand the performance of their developed service in the context of the complete application.

    Last updated: November 8, 2023

    Recent Posts

    • Expand Model-as-a-Service for secure enterprise AI

    • OpenShift LACP bonding performance expectations

    • Build container images in CI/CD with Tekton and Buildpacks

    • How to deploy OpenShift AI & Service Mesh 3 on one cluster

    • JVM tuning for Red Hat Data Grid on Red Hat OpenShift 4

    Red Hat Developers logo LinkedIn YouTube Twitter Facebook

    Products

    • Red Hat Enterprise Linux
    • Red Hat OpenShift
    • Red Hat Ansible Automation Platform

    Build

    • Developer Sandbox
    • Developer Tools
    • Interactive Tutorials
    • API Catalog

    Quicklinks

    • Learning Resources
    • E-books
    • Cheat Sheets
    • Blog
    • Events
    • Newsletter

    Communicate

    • About us
    • Contact sales
    • Find a partner
    • Report a website issue
    • Site Status Dashboard
    • Report a security problem

    RED HAT DEVELOPER

    Build here. Go anywhere.

    We serve the builders. The problem solvers who create careers with code.

    Join us if you’re a developer, software engineer, web designer, front-end designer, UX designer, computer scientist, architect, tester, product manager, project manager or team lead.

    Sign me up

    Red Hat legal and privacy links

    • About Red Hat
    • Jobs
    • Events
    • Locations
    • Contact Red Hat
    • Red Hat Blog
    • Inclusion at Red Hat
    • Cool Stuff Store
    • Red Hat Summit
    © 2025 Red Hat

    Red Hat legal and privacy links

    • Privacy statement
    • Terms of use
    • All policies and guidelines
    • Digital accessibility

    Report a website issue